---
title: VST01
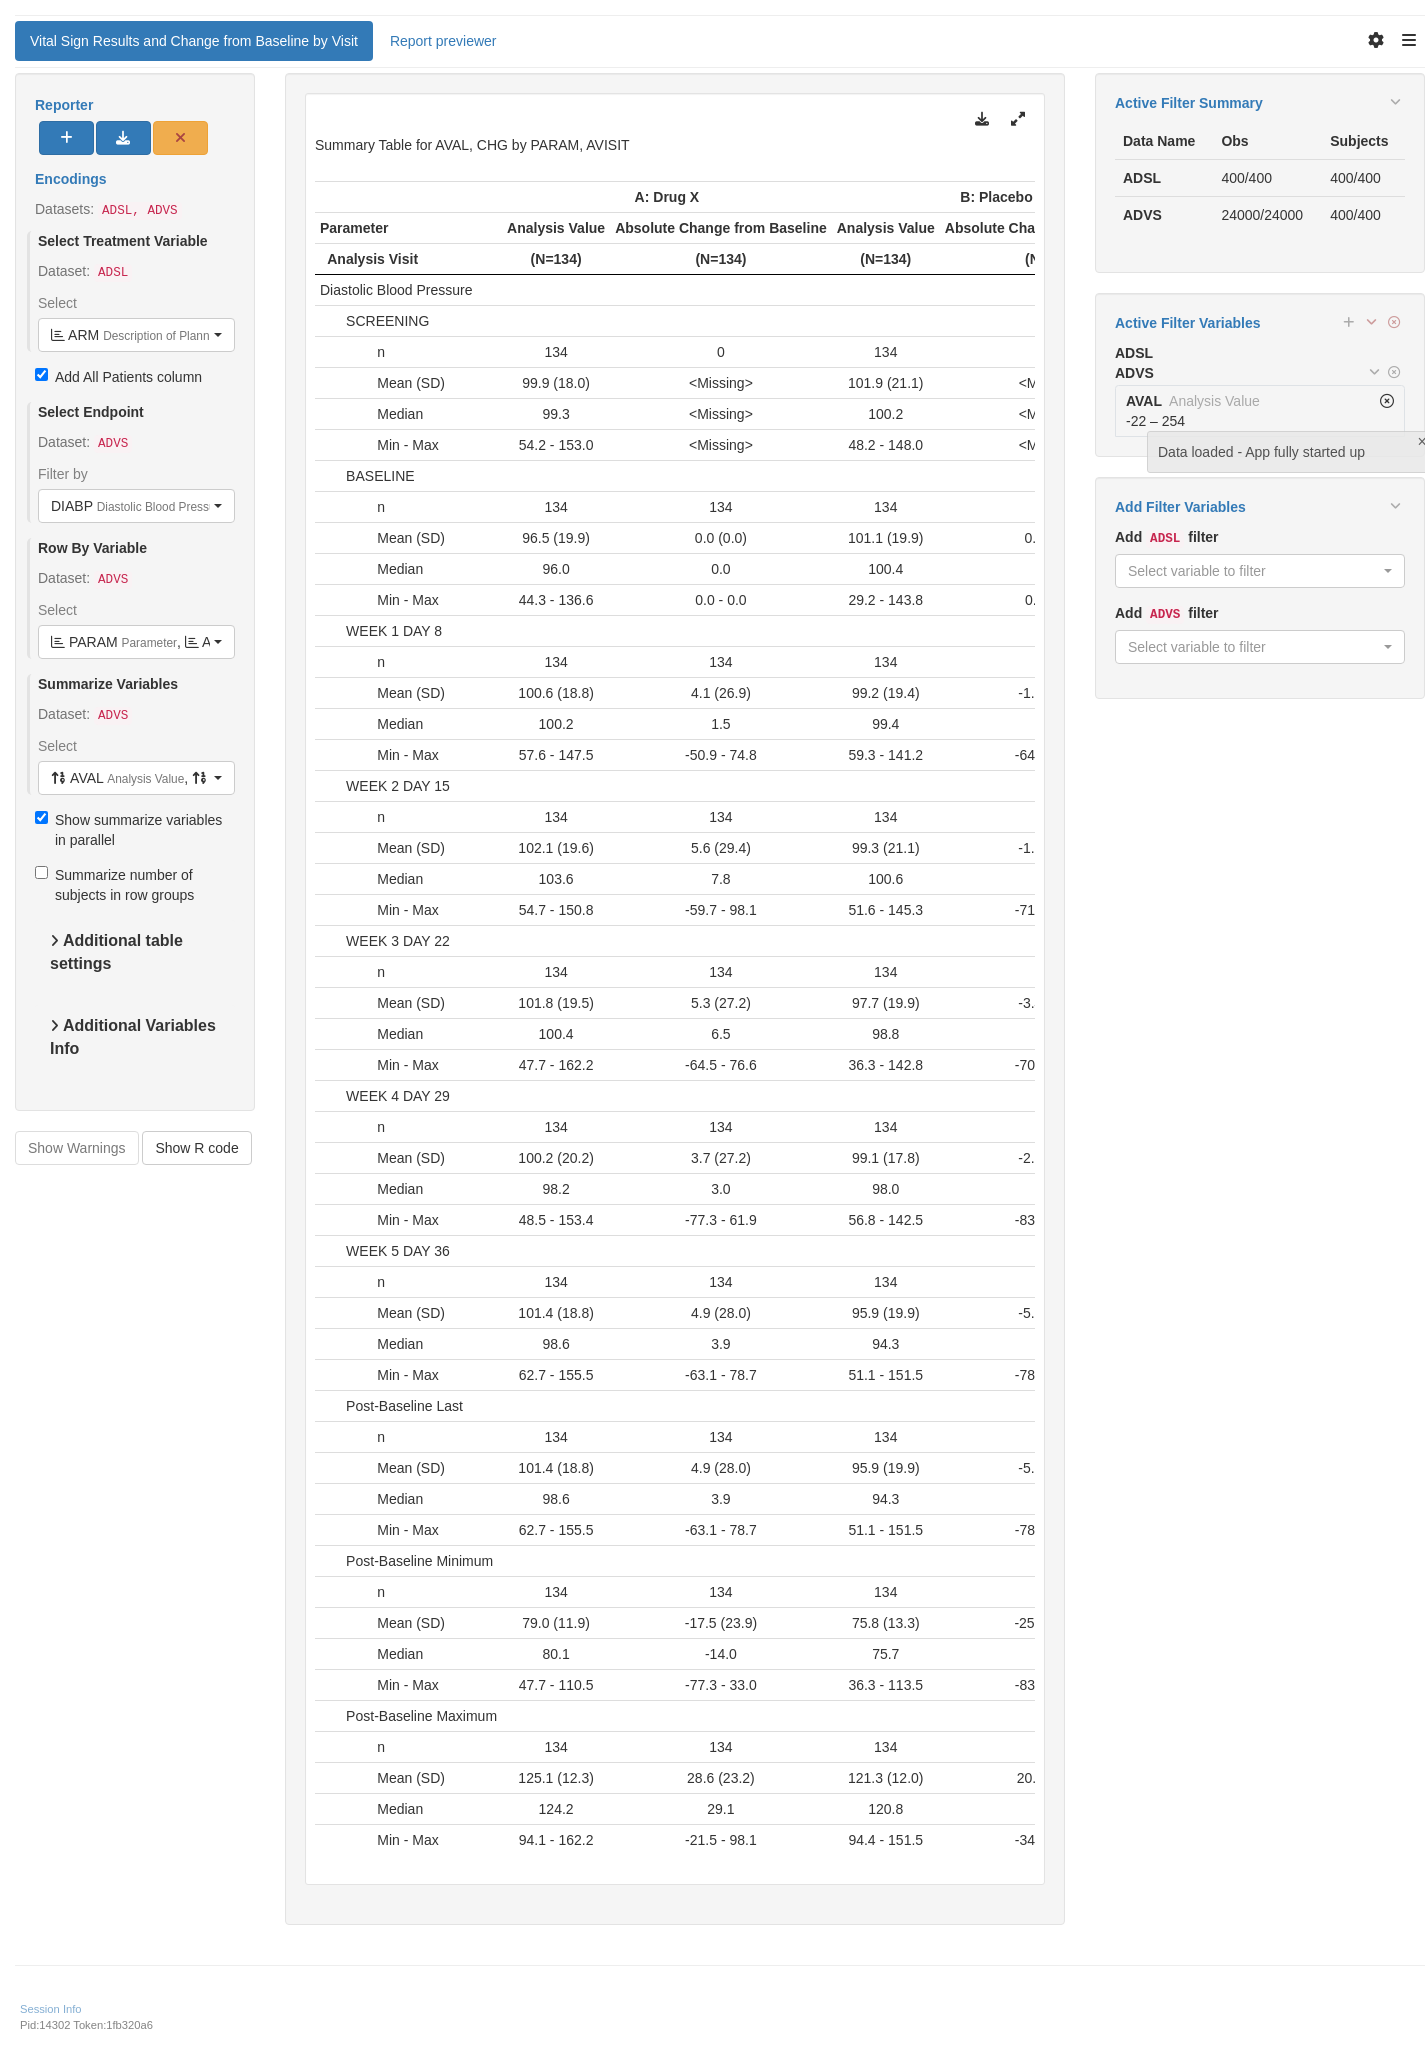
subtitle: Vital Sign Results and Change from Baseline by Visit
---
------------------------------------------------------------------------
{{< include ../../_utils/envir_hook.qmd >}}
```{r setup, echo = FALSE, warning = FALSE, message = FALSE}
library(tern)
library(dplyr)
adsl <- random.cdisc.data::cadsl
advs <- random.cdisc.data::cadvs
# Ensure character variables are converted to factors and empty strings and NAs are explicit missing levels.
adsl <- df_explicit_na(adsl)
advs <- df_explicit_na(advs)
advs_label <- var_labels(advs)
advs <- advs %>%
filter(
PARAMCD == "DIABP",
PARAM == "Diastolic Blood Pressure"
) %>%
mutate(
PARAMCD = droplevels(PARAMCD),
PARAM = droplevels(PARAM)
)
# post-baseline
advs_pb <- advs %>%
filter(ABLFL != "Y", ABLFL2 != "Y")
advs_pb_max <- advs_pb %>%
group_by(PARAM, USUBJID) %>%
arrange(desc(AVAL)) %>%
slice(1) %>%
ungroup() %>%
mutate(AVISIT = "Post-Baseline Maximum")
advs_pb_min <- advs_pb %>%
group_by(PARAM, USUBJID) %>%
arrange(AVAL) %>%
slice(1) %>%
ungroup() %>%
mutate(AVISIT = "Post-Baseline Minimum")
advs_pb_last <- advs_pb %>%
group_by(PARAM, USUBJID) %>%
arrange(desc(AVISITN)) %>%
slice(1) %>%
ungroup() %>%
mutate(AVISIT = "Post-Baseline Last")
# Please note that for real data, per ADaM Spec 1.1, the advs_f can be obtained by filtering on PARAMCD, then
# ANL01FL == 'Y' or AVISIT in c('POST-BASELINE MAXIMUM', 'POST-BASELINE MINIMUM', 'POST-BASELINE LAST')
advs_f <- rbind(
advs,
advs_pb_last,
advs_pb_min,
advs_pb_max
)
advs_f <- advs_f %>%
mutate(AVISIT = droplevels(AVISIT))
var_labels(advs_f) <- advs_label
```
```{r include = FALSE}
webr_code_labels <- c("setup")
```
{{< include ../../_utils/webr_no_include.qmd >}}
## Output
:::: panel-tabset
## Standard Table
::: {.panel-tabset .nav-justified group="webr"}
## {{< fa regular file-lines sm fw >}} Preview
```{r variant1, test = list(result_v1 = "result")}
split_fun <- drop_split_levels

afun <- function(x, .var, .spl_context, ...) {
  n_fun <- sum(!is.na(x), na.rm = TRUE)
  if (n_fun == 0) {
    mean_sd_fun <- c(NA, NA)
    median_fun <- NA
    min_max_fun <- c(NA, NA)
  } else {
    mean_sd_fun <- c(mean(x, na.rm = TRUE), sd(x, na.rm = TRUE))
    median_fun <- median(x, na.rm = TRUE)
    min_max_fun <- c(min(x), max(x))
  }
  is_chg <- .var == "CHG"
  is_baseline <- .spl_context$value[which(.spl_context$split == "AVISIT")] == "BASELINE"
  if (is_baseline && is_chg) n_fun <- mean_sd_fun <- median_fun <- min_max_fun <- NULL

  in_rows(
    "n" = n_fun,
    "Mean (SD)" = mean_sd_fun,
    "Median" = median_fun,
    "Min - Max" = min_max_fun,
    .formats = list("n" = "xx", "Mean (SD)" = "xx.xx (xx.xx)", "Median" = "xx.xx", "Min - Max" = "xx.xx - xx.xx"),
    .format_na_strs = list("n" = "NE", "Mean (SD)" = "NE (NE)", "Median" = "NE", "Min - Max" = "NE - NE")
  )
}

lyt <- basic_table(show_colcounts = TRUE) %>%
  split_cols_by("ACTARM") %>%
  split_rows_by("AVISIT", split_fun = split_fun, label_pos = "topleft", split_label = "\n\nAnalysis Visit") %>%
  split_cols_by_multivar(
    vars = c("AVAL", "CHG"),
    varlabels = c("Value at Visit", "Change from\nBaseline")
  ) %>%
  analyze_colvars(afun = afun)

result <- build_table(lyt = lyt, df = advs_f, alt_counts_df = adsl)
result
```
```{r include = FALSE}
webr_code_labels <- c("variant1")
```
{{< include ../../_utils/webr.qmd >}}
:::
## Data Setup
```{r setup}
#| code-fold: show
```
::::
{{< include ../../_utils/save_results.qmd >}}
## `teal` App
::: {.panel-tabset .nav-justified}
## {{< fa regular file-lines fa-sm fa-fw >}} Preview
```{r teal, opts.label = c("skip_if_testing", "app")}
library(teal.modules.clinical)

## Data reproducible code
data <- teal_data()
data <- within(data, {
  library(dplyr)

  ADSL <- random.cdisc.data::cadsl
  ADVS <- random.cdisc.data::cadvs
  advs_label <- col_labels(ADVS)

  # post-baseline
  advs_pb <- ADVS %>%
    filter(
      ABLFL != "Y",
      ABLFL2 != "Y"
    )

  advs_pb_max <- advs_pb %>%
    group_by(PARAM, USUBJID) %>%
    arrange(desc(AVAL)) %>%
    slice(1) %>%
    ungroup() %>%
    mutate(AVISIT = "Post-Baseline Maximum")

  advs_pb_min <- advs_pb %>%
    group_by(PARAM, USUBJID) %>%
    arrange(AVAL) %>%
    slice(1) %>%
    ungroup() %>%
    mutate(AVISIT = "Post-Baseline Minimum")

  advs_pb_last <- advs_pb %>%
    group_by(PARAM, USUBJID) %>%
    arrange(desc(AVISITN)) %>%
    slice(1) %>%
    ungroup() %>%
    mutate(AVISIT = "Post-Baseline Last")

  ADVS <- rbind(
    ADVS,
    advs_pb_last,
    advs_pb_min,
    advs_pb_max
  ) %>%
    mutate(AVISIT = droplevels(AVISIT))

  col_labels(ADVS) <- advs_label
})
join_keys(data) <- default_cdisc_join_keys[c("ADSL", "ADVS")]

## Reusable Configuration For Modules
ADSL <- data[["ADSL"]]
ADVS <- data[["ADVS"]]

## Setup App
app <- init(
  data = data,
  modules = modules(
    tm_t_summary_by(
      label = "Vital Sign Results and Change from Baseline by Visit",
      dataname = "ADVS",
      arm_var = choices_selected(
        choices = variable_choices(ADSL, c("ARM", "ARMCD")),
        selected = "ARM"
      ),
      by_vars = choices_selected(
        choices = variable_choices(ADVS, c("PARAM", "AVISIT")),
        selected = c("AVISIT", "PARAM")
      ),
      summarize_vars = choices_selected(
        choices = variable_choices(ADVS, c("AVAL", "CHG")),
        selected = c("AVAL", "CHG")
      ),
      useNA = "ifany",
      paramcd = choices_selected(
        choices = value_choices(ADVS, "PARAMCD", "PARAM"),
        selected = "DIABP"
      ),
      parallel_vars = TRUE
    )
  ),
  filter = teal_slices(teal_slice("ADVS", "AVAL", selected = NULL))
)

shinyApp(app$ui, app$server)
```
{{< include ../../_utils/shinylive.qmd >}}
:::
{{< include ../../repro.qmd >}}