---
title: LBT11_BL
subtitle: Time to First Increase in Liver Laboratory Test Result Meeting Hy's Law Laboratory Critieria (with Respect to Baseline)
---
------------------------------------------------------------------------
{{< include ../../_utils/envir_hook.qmd >}}
```{r setup, echo = FALSE, warning = FALSE, message = FALSE}
library(tern)
library(dplyr)
adsl <- random.cdisc.data::cadsl
adaette <- random.cdisc.data::cadaette
# Ensure character variables are converted to factors and empty strings and NAs are explicit missing levels.
adsl <- df_explicit_na(adsl)
adaette <- df_explicit_na(adaette)
adsl_safl <- dplyr::filter(adsl, .data$SAFFL == "Y")
anl <- adaette %>%
dplyr::filter(
SAFFL == "Y",
PARAMCD == "HYSTTEBL"
) %>%
dplyr::mutate(
AVAL = .data$AVAL * dplyr::case_when( # convert to days, if possible
.data$AVALU == "WEEKS" ~ 7,
.data$AVALU == "MONTHS" ~ 30.4375,
.data$AVALU == "YEARS" ~ 365,
TRUE ~ 1
),
AVALU = factor(dplyr::case_when(
.data$AVALU %in% c("WEEKS", "MONTHS", "YEARS") ~ factor("DAYS"),
TRUE ~ .data$AVALU
), levels = "DAYS"),
is_event = CNSR == 0, # this will be a LLT event
event_grp = factor(
dplyr::case_when(
CNSR == 0 ~ "Patients with LLT event (%)",
CNSR == 1 ~ "Patients without LLT event (%)"
),
levels = c(
"Patients with LLT event (%)",
"Patients without LLT event (%)"
)
)
)
```
```{r include = FALSE}
webr_code_labels <- c("setup")
```
{{< include ../../_utils/webr_no_include.qmd >}}
## Output
:::::: panel-tabset
## Time-To-Event Summary
::: {.panel-tabset .nav-justified group="webr"}
## {{< fa regular file-lines sm fw >}} Preview
```{r variant1, test = list(result_v1 = "result")}
lyt <- basic_table(show_colcounts = TRUE) %>%
  split_cols_by(var = "ARMCD", ref_group = "ARM A") %>%
  count_occurrences(vars = "event_grp") %>%
  surv_time(
    vars = "AVAL",
    var_labels = paste0("Time to 1st LLT Event (", levels(anl$AVALU), ")"),
    is_event = "is_event",
    table_names = "time_to_event"
  ) %>%
  coxph_pairwise(
    vars = "AVAL",
    is_event = "is_event",
    var_labels = "Unstratified Analysis",
    control = control_coxph(pval_method = "log-rank"),
    table_names = "coxph_unstratified"
  )

result <- build_table(lyt, df = anl, alt_counts_df = adsl_safl)
result
```
```{r include = FALSE}
webr_code_labels <- c("variant1")
```
{{< include ../../_utils/webr.qmd >}}
:::
## Time-To-Event Summary <br/> Selecting Sections to Display
::: {.panel-tabset .nav-justified group="webr"}
## {{< fa regular file-lines sm fw >}} Preview
```{r variant2, test = list(result_v2 = "result")}
lyt <- basic_table(show_colcounts = TRUE) %>%
  split_cols_by(var = "ARMCD", ref_group = "ARM A") %>%
  count_occurrences(vars = "event_grp") %>%
  surv_time(
    vars = "AVAL",
    var_labels = paste0("Time to 1st LLT Event (", levels(anl$AVALU), ")"),
    is_event = "is_event",
    table_names = "time_to_event"
  )

result <- build_table(lyt, df = anl, alt_counts_df = adsl_safl)
result
```
```{r include = FALSE}
webr_code_labels <- c("variant2")
```
{{< include ../../_utils/webr.qmd >}}
:::
## Time-To-Event Summary <br/> with Stratified Analysis
::: {.panel-tabset .nav-justified group="webr"}
## {{< fa regular file-lines sm fw >}} Preview
```{r variant3, test = list(result_v3 = "result")}
strata <- c("RACE", "SEX")

lyt <- basic_table(show_colcounts = TRUE) %>%
  split_cols_by(var = "ARMCD", ref_group = "ARM A") %>%
  count_occurrences(vars = "event_grp") %>%
  surv_time(
    vars = "AVAL",
    var_labels = paste0("Time to 1st LLT Event (", levels(anl$AVALU), ")"),
    is_event = "is_event",
    table_names = "time_to_event"
  ) %>%
  coxph_pairwise(
    vars = "AVAL",
    is_event = "is_event",
    var_labels = "Unstratified Analysis",
    control = control_coxph(pval_method = "log-rank"),
    table_names = "coxph_unstratified"
  ) %>%
  coxph_pairwise(
    vars = "AVAL",
    is_event = "is_event",
    var_labels = paste0("Stratified By: ", paste(strata, collapse = ", ")),
    strata = strata,
    table_names = "coxph_stratified"
  )

result <- build_table(lyt, df = anl, alt_counts_df = adsl_safl)
result
```
```{r include = FALSE}
webr_code_labels <- c("variant2")
```
{{< include ../../_utils/webr.qmd >}}
:::
## Data Setup
```{r setup}
#| code-fold: show
```
::::::
{{< include ../../_utils/save_results.qmd >}}
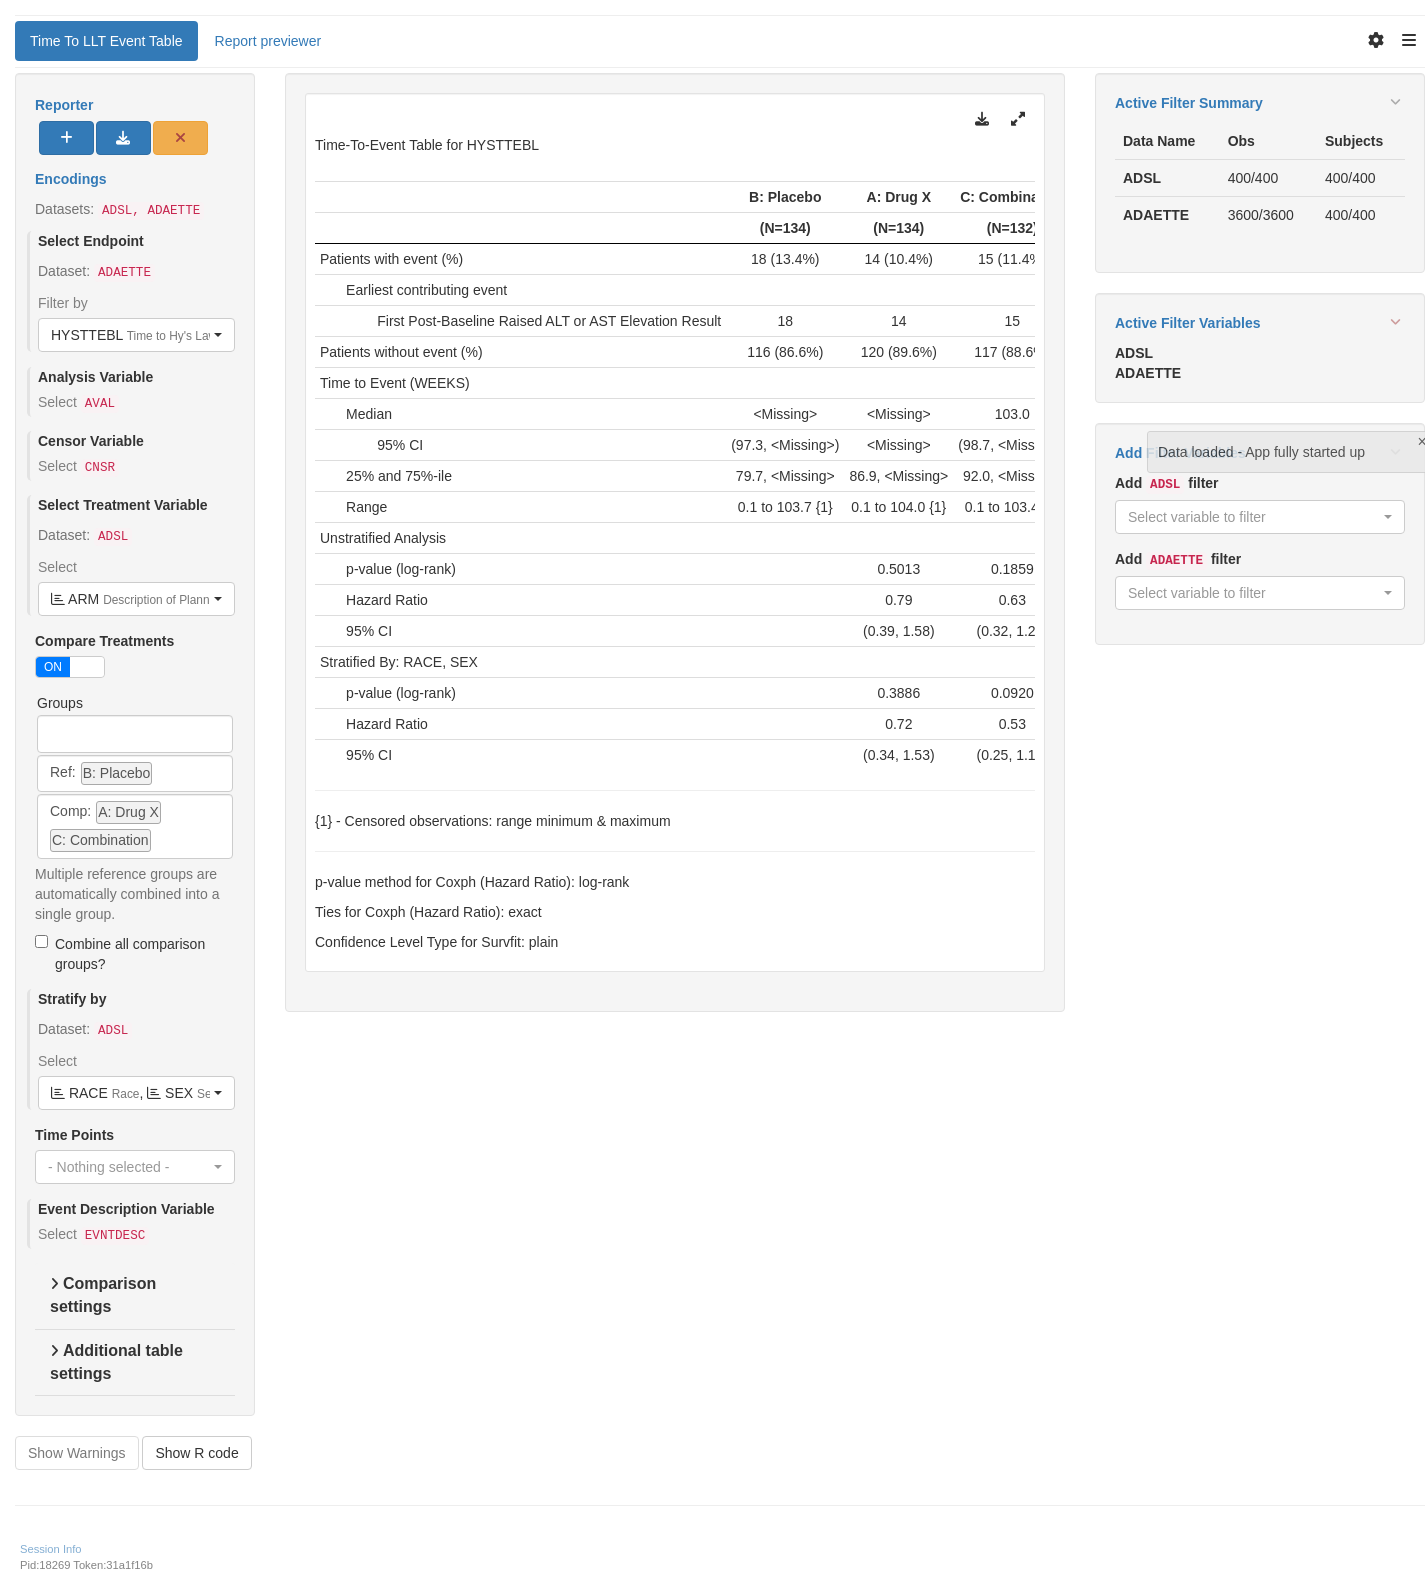
## `teal` App
::: {.panel-tabset .nav-justified}
## {{< fa regular file-lines fa-sm fa-fw >}} Preview
```{r teal, opts.label = c("skip_if_testing", "app")}
library(teal.modules.clinical)

## Data reproducible code
data <- teal_data()
data <- within(data, {
  library(dplyr)

  ADSL <- random.cdisc.data::cadsl
  ADAETTE <- random.cdisc.data::cadaette

  # Ensure character variables are converted to factors and empty strings and NAs are explicit missing levels.
  ADSL <- df_explicit_na(ADSL)
  ADAETTE <- df_explicit_na(ADAETTE)

  ADSL <- filter(ADSL, .data$SAFFL == "Y")
  ADAETTE <- filter(ADAETTE, .data$SAFFL == "Y")
})
join_keys(data) <- default_cdisc_join_keys[c("ADSL", "ADAETTE")]

## Reusable Configuration For Modules
ADSL <- data[["ADSL"]]
ADAETTE <- data[["ADAETTE"]]
arm_ref_comp <- list(
  ACTARMCD = list(
    ref = "ARM B",
    comp = c("ARM A", "ARM C")
  ),
  ARM = list(
    ref = "B: Placebo",
    comp = c("A: Drug X", "C: Combination")
  )
)

## Setup App
app <- init(
  data = data,
  modules = modules(
    tm_t_tte(
      label = "Time To LLT Event Table",
      dataname = "ADAETTE",
      arm_var = choices_selected(
        variable_choices(ADSL, c("ARM", "ARMCD", "ACTARMCD")),
        "ARM"
      ),
      arm_ref_comp = arm_ref_comp,
      paramcd = choices_selected(
        value_choices(ADAETTE, "PARAMCD", "PARAM"),
        "HYSTTEBL"
      ),
      strata_var = choices_selected(
        variable_choices(ADSL, c("RACE", "SEX")),
        c("RACE", "SEX")
      ),
      time_points = choices_selected(0, NULL),
      event_desc_var = choices_selected("EVNTDESC", "EVNTDESC", fixed = TRUE)
    )
  )
)

shinyApp(app$ui, app$server)
```
{{< include ../../_utils/shinylive.qmd >}}
:::
{{< include ../../repro.qmd >}}