---
title: LBT15
subtitle: Laboratory Test Shifts to NCI CTCAE Grade 3-4 Post-Baseline
---
------------------------------------------------------------------------
{{< include ../../_utils/envir_hook.qmd >}}
```{r setup, echo = FALSE, warning = FALSE, message = FALSE}
library(tern)
library(dplyr)
library(forcats)
adsl <- random.cdisc.data::cadsl
adlb <- random.cdisc.data::cadlb
adlb <- adlb %>%
mutate(
PARAM = with_label(.data$PARAM, "Laboratory Test"),
ANRIND = with_label(.data$ANRIND, "Direction of Abnormality")
) %>%
mutate(
PARCAT1 = LBCAT
) %>%
mutate(
ANRIND = fct_collapse(.data$ATOXGR,
"LOW" = c("-3", "-4"),
"MODERATE/NORMAL" = c("-2", "-1", "0", "1", "2"),
"HIGH" = c("3", "4")
),
BNRIND = fct_collapse(.data$BTOXGR,
"LOW" = c("-3", "-4"),
"MODERATE/NORMAL" = c("-2", "-1", "0", "1", "2"),
"HIGH" = c("3", "4")
),
PARCAT1 = LBCAT
) %>%
filter(ONTRTFL == "Y")
adlb_alt_cut <- adlb %>%
mutate(
ANRIND = fct_collapse(.data$ATOXGR,
"LOW" = c("-2", "-3", "-4"),
"MODERATE/NORMAL" = c("-1", "0", "1"),
"HIGH" = c("2", "3", "4")
),
BNRIND = fct_collapse(.data$BTOXGR,
"LOW" = c("-2", "-3", "-4"),
"MODERATE/NORMAL" = c("-1", "0", "1"),
"HIGH" = c("2", "3", "4")
)
) %>%
filter(ONTRTFL == "Y")
adlb <- adlb %>% var_relabel(
PARCAT1 = "Category for Lab Test",
PARAM = "Parameter"
)
```
```{r include = FALSE}
webr_code_labels <- c("setup")
```
{{< include ../../_utils/webr_no_include.qmd >}}
## Output
::::: panel-tabset
## Standard Table
::: {.panel-tabset .nav-justified group="webr"}
## {{< fa regular file-lines sm fw >}} Preview
```{r variant1, test = list(result_v1 = "result")}
# Argument exclude_base_abn must be TRUE to include patients with normal or abnormal in the opposite
# direction in the denom.
# So for "High" direction, subjects with baseline grade 3-4 are not in the denom.
lyt <- basic_table(show_colcounts = TRUE) %>%
  split_cols_by(var = "ARM") %>%
  add_overall_col("All Patients") %>%
  split_rows_by(
    "PARCAT1",
    split_fun = drop_split_levels, label_pos = "topleft", split_label = obj_label(adlb$PARCAT1)
  ) %>%
  split_rows_by(
    "PARAM",
    split_fun = drop_split_levels, label_pos = "topleft", split_label = obj_label(adlb$PARAM)
  ) %>%
  count_abnormal(
    var = "ANRIND",
    abnormal = list(Low = "LOW", High = "HIGH"),
    variables = list(id = "USUBJID", baseline = "BNRIND"),
    exclude_base_abn = TRUE,
    .indent_mods = 4L
  ) %>%
  append_topleft("            Direction of Abnormality")

result <- build_table(lyt, adlb, alt_counts_df = adsl)
result
```
```{r include = FALSE}
webr_code_labels <- c("variant1")
```
{{< include ../../_utils/webr.qmd >}}
:::
## Table Modifying Cut Point
::: {.panel-tabset .nav-justified group="webr"}
## {{< fa regular file-lines sm fw >}} Preview
```{r variant2, test = list(result_v2 = "result")}
result <- build_table(lyt, adlb_alt_cut, alt_counts_df = adsl)
result
```
```{r include = FALSE}
webr_code_labels <- c("variant1", "variant2")
```
{{< include ../../_utils/webr.qmd >}}
:::
## Data Setup
Because the `random.cdisc.data` dataset `adlb` doesn't have the `PARCAT1` variable, this variable is created from `LBCAT` in pre-processing.
```{r setup}
#| code-fold: show
```
:::::
{{< include ../../_utils/save_results.qmd >}}
## `teal` App
::: {.panel-tabset .nav-justified}
## {{< fa regular file-lines fa-sm fa-fw >}} Preview
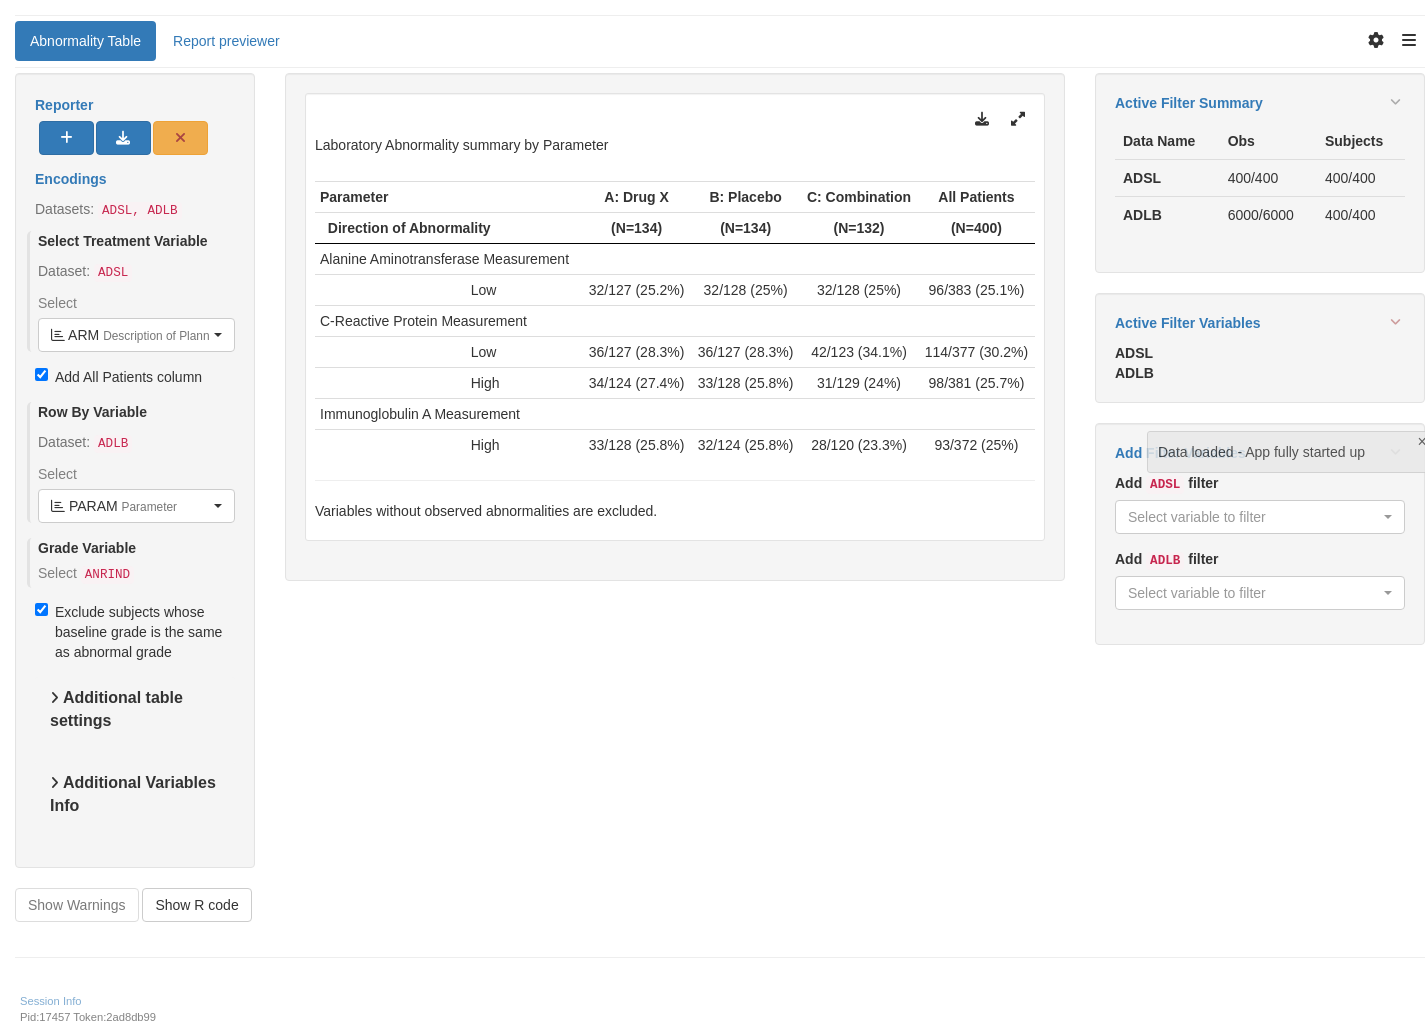
The current module `tm_t_abnormality` is only displaying rows that are not all-zero, so the result could be a little different from static output where all-zero rows can be shown.
```{r teal, opts.label = c("skip_if_testing", "app")}
library(teal.modules.clinical)

## Data reproducible code
data <- teal_data()
data <- within(data, {
  library(dplyr)
  library(forcats)

  ADSL <- random.cdisc.data::cadsl
  ADLB <- random.cdisc.data::cadlb %>%
    mutate(
      ANRIND = fct_collapse(ATOXGR,
        "LOW" = c("-3", "-4"),
        "MODERATE/NORMAL" = c("-2", "-1", "0", "1", "2"),
        "HIGH" = c("3", "4")
      ),
      BNRIND = fct_collapse(.data$BTOXGR,
        "LOW" = c("-3", "-4"),
        "MODERATE/NORMAL" = c("-2", "-1", "0", "1", "2"),
        "HIGH" = c("3", "4")
      )
    ) %>%
    filter(ONTRTFL == "Y") %>%
    col_relabel(ANRIND = "Direction of Abnormality")
})
join_keys(data) <- default_cdisc_join_keys[c("ADSL", "ADLB")]

## Reusable Configuration For Modules
ADSL <- data[["ADSL"]]
ADLB <- data[["ADLB"]]

## Setup App
app <- init(
  data = data,
  modules = modules(
    tm_t_abnormality(
      label = "Abnormality Table",
      dataname = "ADLB",
      arm_var = choices_selected(
        choices = variable_choices(ADSL, subset = c("ARM", "ARMCD")),
        selected = "ARM"
      ),
      by_vars = choices_selected(
        choices = variable_choices(ADLB, subset = c("PARAM")),
        selected = c("PARAM"),
        keep_order = TRUE
      ),
      grade = choices_selected(
        choices = variable_choices(ADLB, subset = "ANRIND"),
        selected = "ANRIND",
        fixed = TRUE
      ),
      baseline_var = choices_selected(
        choices = variable_choices(ADLB, subset = "BNRIND"),
        selected = "BNRIND",
        fixed = TRUE
      ),
      abnormal = list(Low = "LOW", High = "HIGH"),
      exclude_base_abn = TRUE
    )
  )
)

shinyApp(app$ui, app$server)
```
{{< include ../../_utils/shinylive.qmd >}}
:::
{{< include ../../repro.qmd >}}

