---
title: EGT03
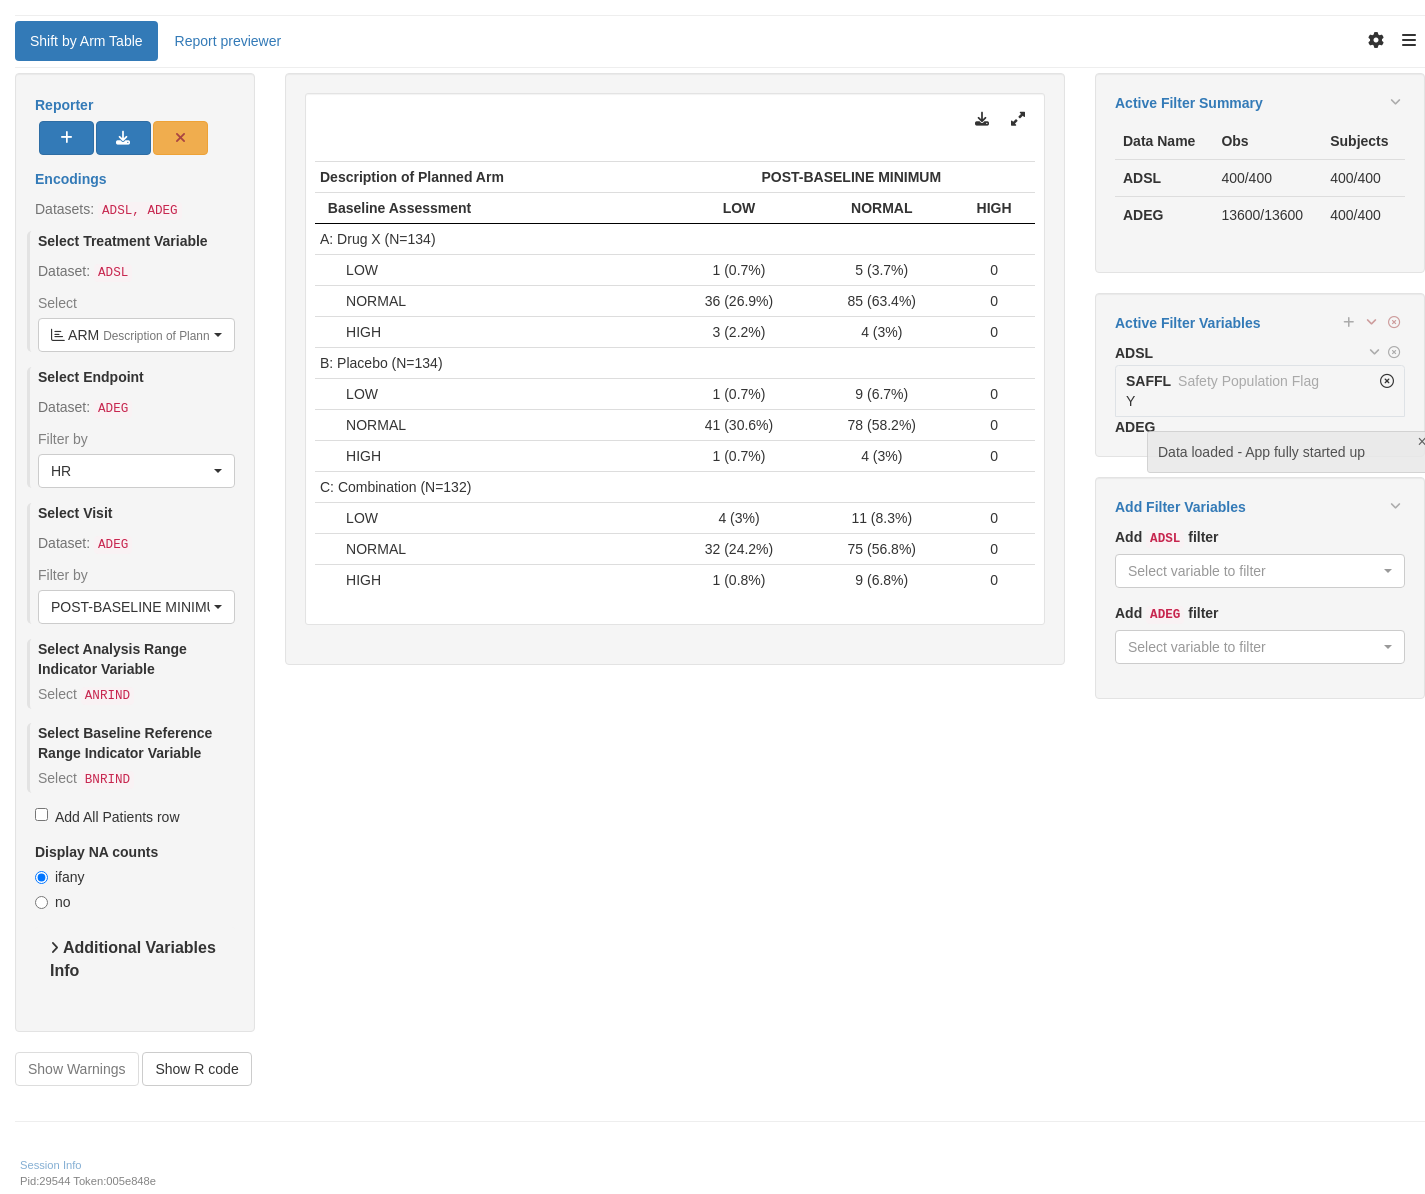
subtitle: Shift Table of ECG Interval Data -- Baseline Versus Minimum/Maximum Post-Baseline
---
------------------------------------------------------------------------
{{< include ../../_utils/envir_hook.qmd >}}
```{r setup, echo = FALSE, warning = FALSE, message = FALSE}
library(tern)
library(dplyr)
adeg <- random.cdisc.data::cadeg
# Ensure character variables are converted to factors and empty strings and NAs are explicit missing levels.
adeg <- df_explicit_na(adeg)
adeg_labels <- var_labels(adeg)
adeg_f_pbmin <- subset(
adeg,
PARAMCD == "HR" & # Heart Rate
SAFFL == "Y" & # "Safety Population Flag"
ONTRTFL == "Y" & # "On Treatment Record Flag"
AVISIT == "POST-BASELINE MINIMUM" # "Analysis Visit"
)
adeg_f_pbmax <- subset(
adeg,
PARAMCD == "HR" & # Heart Rate
SAFFL == "Y" & # "Safety Population Flag"
ONTRTFL == "Y" & # "On Treatment Record Flag"
AVISIT == "POST-BASELINE MAXIMUM" # "Analysis Visit"
)
var_labels(adeg_f_pbmin) <- adeg_labels
var_labels(adeg_f_pbmax) <- adeg_labels
```
```{r include = FALSE}
webr_code_labels <- c("setup")
```
{{< include ../../_utils/webr_no_include.qmd >}}
## Output
::::: panel-tabset
## Table of Baseline Versus <br/> Minimum Post-Baseline
For the EGT03 template, data imputation should be avoided, and missing data explicit and accounted for, so the contingency table sum adds up to the group N. For illustration purposes, missing data are added to the example dataset.
::: {.panel-tabset .nav-justified group="webr"}
## {{< fa regular file-lines sm fw >}} Preview
```{r variant1, test = list(result_v1 = "result")}
set.seed(123, kind = "Mersenne-Twister")

adeg_f_pbmin$BNRIND <- factor(
  adeg_f_pbmin$BNRIND,
  levels = c("LOW", "NORMAL", "HIGH", "Missing"),
  labels = c("LOW", "NORMAL", "HIGH", "Missing")
)
adeg_f_pbmin$ANRIND <- factor(
  adeg_f_pbmin$ANRIND,
  levels = c("LOW", "NORMAL", "HIGH", "Missing"),
  labels = c("LOW", "NORMAL", "HIGH", "Missing")
)

adeg_f_pbmin$BNRIND[sample(seq_len(nrow(adeg_f_pbmin)), size = 5)] <- "Missing"
adeg_f_pbmin$ANRIND[sample(seq_len(nrow(adeg_f_pbmin)), size = 5)] <- "Missing"

attr(adeg_f_pbmin$ANRIND, "label") <- "Analysis Reference Range Indicator"
attr(adeg_f_pbmin$BNRIND, "label") <- "Baseline Reference Range Indicator"

# Temporary solution for overarching column
adeg_f_pbmin <- adeg_f_pbmin %>% mutate(min_label = "Minimum Post-Baseline Assessment")

# Define the split function
split_fun <- drop_split_levels

lyt <- basic_table() %>%
  split_cols_by("min_label") %>%
  split_cols_by("ANRIND") %>%
  split_rows_by("ARMCD", split_fun = split_fun, label_pos = "topleft", split_label = obj_label(adeg_f_pbmin$ARMCD)) %>%
  add_rowcounts() %>%
  analyze_vars("BNRIND", denom = "N_row", .stats = "count_fraction") %>%
  append_varlabels(adeg_f_pbmin, c("BNRIND"), indent = 1L)

result <- build_table(
  lyt = lyt,
  df = adeg_f_pbmin
)

result
```
```{r include = FALSE}
webr_code_labels <- c("variant1")
```
{{< include ../../_utils/webr.qmd >}}
:::
## Table of Baseline Versus <br/> Maximum Post-Baseline
For the EGT03 template, data imputation should be avoided, and missing data explicit and accounted for, so the contingency table sum adds up to the group N. For illustration purpose, missing data are added to the example dataset.
::: {.panel-tabset .nav-justified group="webr"}
## {{< fa regular file-lines sm fw >}} Preview
```{r variant2, test = list(result_v2 = "result")}
set.seed(123, kind = "Mersenne-Twister")

adeg_f_pbmax$BNRIND <- factor(
  adeg_f_pbmax$BNRIND,
  levels = c("LOW", "NORMAL", "HIGH", "Missing"),
  labels = c("LOW", "NORMAL", "HIGH", "Missing")
)
adeg_f_pbmax$ANRIND <- factor(
  adeg_f_pbmax$ANRIND,
  levels = c("LOW", "NORMAL", "HIGH", "Missing"),
  labels = c("LOW", "NORMAL", "HIGH", "Missing")
)

adeg_f_pbmax$BNRIND[sample(seq_len(nrow(adeg_f_pbmax)), size = 5)] <- "Missing"
adeg_f_pbmax$ANRIND[sample(seq_len(nrow(adeg_f_pbmax)), size = 5)] <- "Missing"

attr(adeg_f_pbmax$ANRIND, "label") <- "Analysis Reference Range Indicator"
attr(adeg_f_pbmax$BNRIND, "label") <- "Baseline Reference Range Indicator"

# Temporary solution for overarching column
adeg_f_pbmax <- adeg_f_pbmax %>% mutate(max_label = "Maximum Post-Baseline Assessment")

# Define the split function
split_fun <- drop_split_levels

lyt <- basic_table() %>%
  split_cols_by("max_label") %>%
  split_cols_by("ANRIND") %>%
  split_rows_by("ARMCD", split_fun = split_fun, label_pos = "topleft", split_label = obj_label(adeg_f_pbmax$ARMCD)) %>%
  add_rowcounts() %>%
  analyze_vars("BNRIND", denom = "N_row", .stats = "count_fraction") %>%
  append_varlabels(adeg_f_pbmax, c("BNRIND"), indent = 1L)

result <- build_table(
  lyt = lyt,
  df = adeg_f_pbmax
)

result
```
```{r include = FALSE}
webr_code_labels <- c("variant2")
```
{{< include ../../_utils/webr.qmd >}}
:::
## Data Setup
```{r setup}
#| code-fold: show
```
:::::
{{< include ../../_utils/save_results.qmd >}}
## `teal` App
::: {.panel-tabset .nav-justified}
## {{< fa regular file-lines fa-sm fa-fw >}} Preview
```{r teal, opts.label = c("skip_if_testing", "app")}
library(teal.modules.clinical)

## Data reproducible code
data <- teal_data()
data <- within(data, {
  ADSL <- random.cdisc.data::cadsl
  ADEG <- random.cdisc.data::cadeg
})
join_keys(data) <- default_cdisc_join_keys[c("ADSL", "ADEG")]

## Reusable Configuration For Modules
ADSL <- data[["ADSL"]]
ADEG <- data[["ADEG"]]

## Setup App
app <- init(
  data = data,
  modules = modules(
    tm_t_shift_by_arm(
      label = "Shift by Arm Table",
      dataname = "ADEG",
      arm_var = choices_selected(
        variable_choices(ADSL, subset = c("ARM", "ARMCD")),
        selected = "ARM"
      ),
      paramcd = choices_selected(
        value_choices(ADEG, "PARAMCD"),
        selected = "HR"
      ),
      visit_var = choices_selected(
        value_choices(ADEG, "AVISIT"),
        selected = "POST-BASELINE MINIMUM"
      ),
      aval_var = choices_selected(
        variable_choices(ADEG, subset = "ANRIND"),
        selected = "ANRIND", fixed = TRUE
      ),
      baseline_var = choices_selected(
        variable_choices(ADEG, subset = "BNRIND"),
        selected = "BNRIND", fixed = TRUE
      ),
      treatment_flag_var = choices_selected(
        variable_choices(ADEG, subset = "ONTRTFL"),
        selected = "ONTRTFL", fixed = TRUE
      ),
      treatment_flag = choices_selected(
        value_choices(ADEG, "ONTRTFL"),
        selected = "Y", fixed = TRUE
      )
    )
  ),
  filter = teal_slices(teal_slice("ADSL", "SAFFL", selected = "Y"))
)

shinyApp(app$ui, app$server)
```
{{< include ../../_utils/shinylive.qmd >}}
:::
{{< include ../../repro.qmd >}}