Code
# Define the split function
split_fun <- drop_split_levels
afun <- function(x, .var, .spl_context, ...) {
n_fun <- sum(!is.na(x), na.rm = TRUE)
if (n_fun == 0) {
mean_sd_fun <- c(NA, NA)
median_fun <- NA
min_max_fun <- c(NA, NA)
} else {
mean_sd_fun <- c(mean(x, na.rm = TRUE), sd(x, na.rm = TRUE))
median_fun <- median(x, na.rm = TRUE)
min_max_fun <- c(min(x), max(x))
}
is_chg <- .var == "CHG"
is_baseline <- .spl_context$value[which(.spl_context$split == "AVISIT")] == "BASELINE"
if (is_baseline && is_chg) n_fun <- mean_sd_fun <- median_fun <- min_max_fun <- NULL
in_rows(
"n" = n_fun,
"Mean (SD)" = mean_sd_fun,
"Median" = median_fun,
"Min - Max" = min_max_fun,
.formats = list("n" = "xx", "Mean (SD)" = "xx.xx (xx.xx)", "Median" = "xx.xx", "Min - Max" = "xx.xx - xx.xx"),
.format_na_strs = list("n" = "NE", "Mean (SD)" = "NE (NE)", "Median" = "NE", "Min - Max" = "NE - NE")
)
}
lyt <- basic_table(show_colcounts = TRUE) %>%
split_cols_by("ACTARM") %>%
split_rows_by("PARAM", split_fun = split_fun, label_pos = "topleft", split_label = obj_label(adeg_f$PARAM)) %>%
split_rows_by("AVISIT", split_fun = split_fun, label_pos = "topleft", split_label = obj_label(adeg_f$AVISIT)) %>%
split_cols_by_multivar(
vars = c("AVAL", "CHG"),
varlabels = c("Value at Visit", "Change from\nBaseline")
) %>%
analyze_colvars(afun = afun)
result <- build_table(lyt, adeg_f, alt_counts_df = adsl)
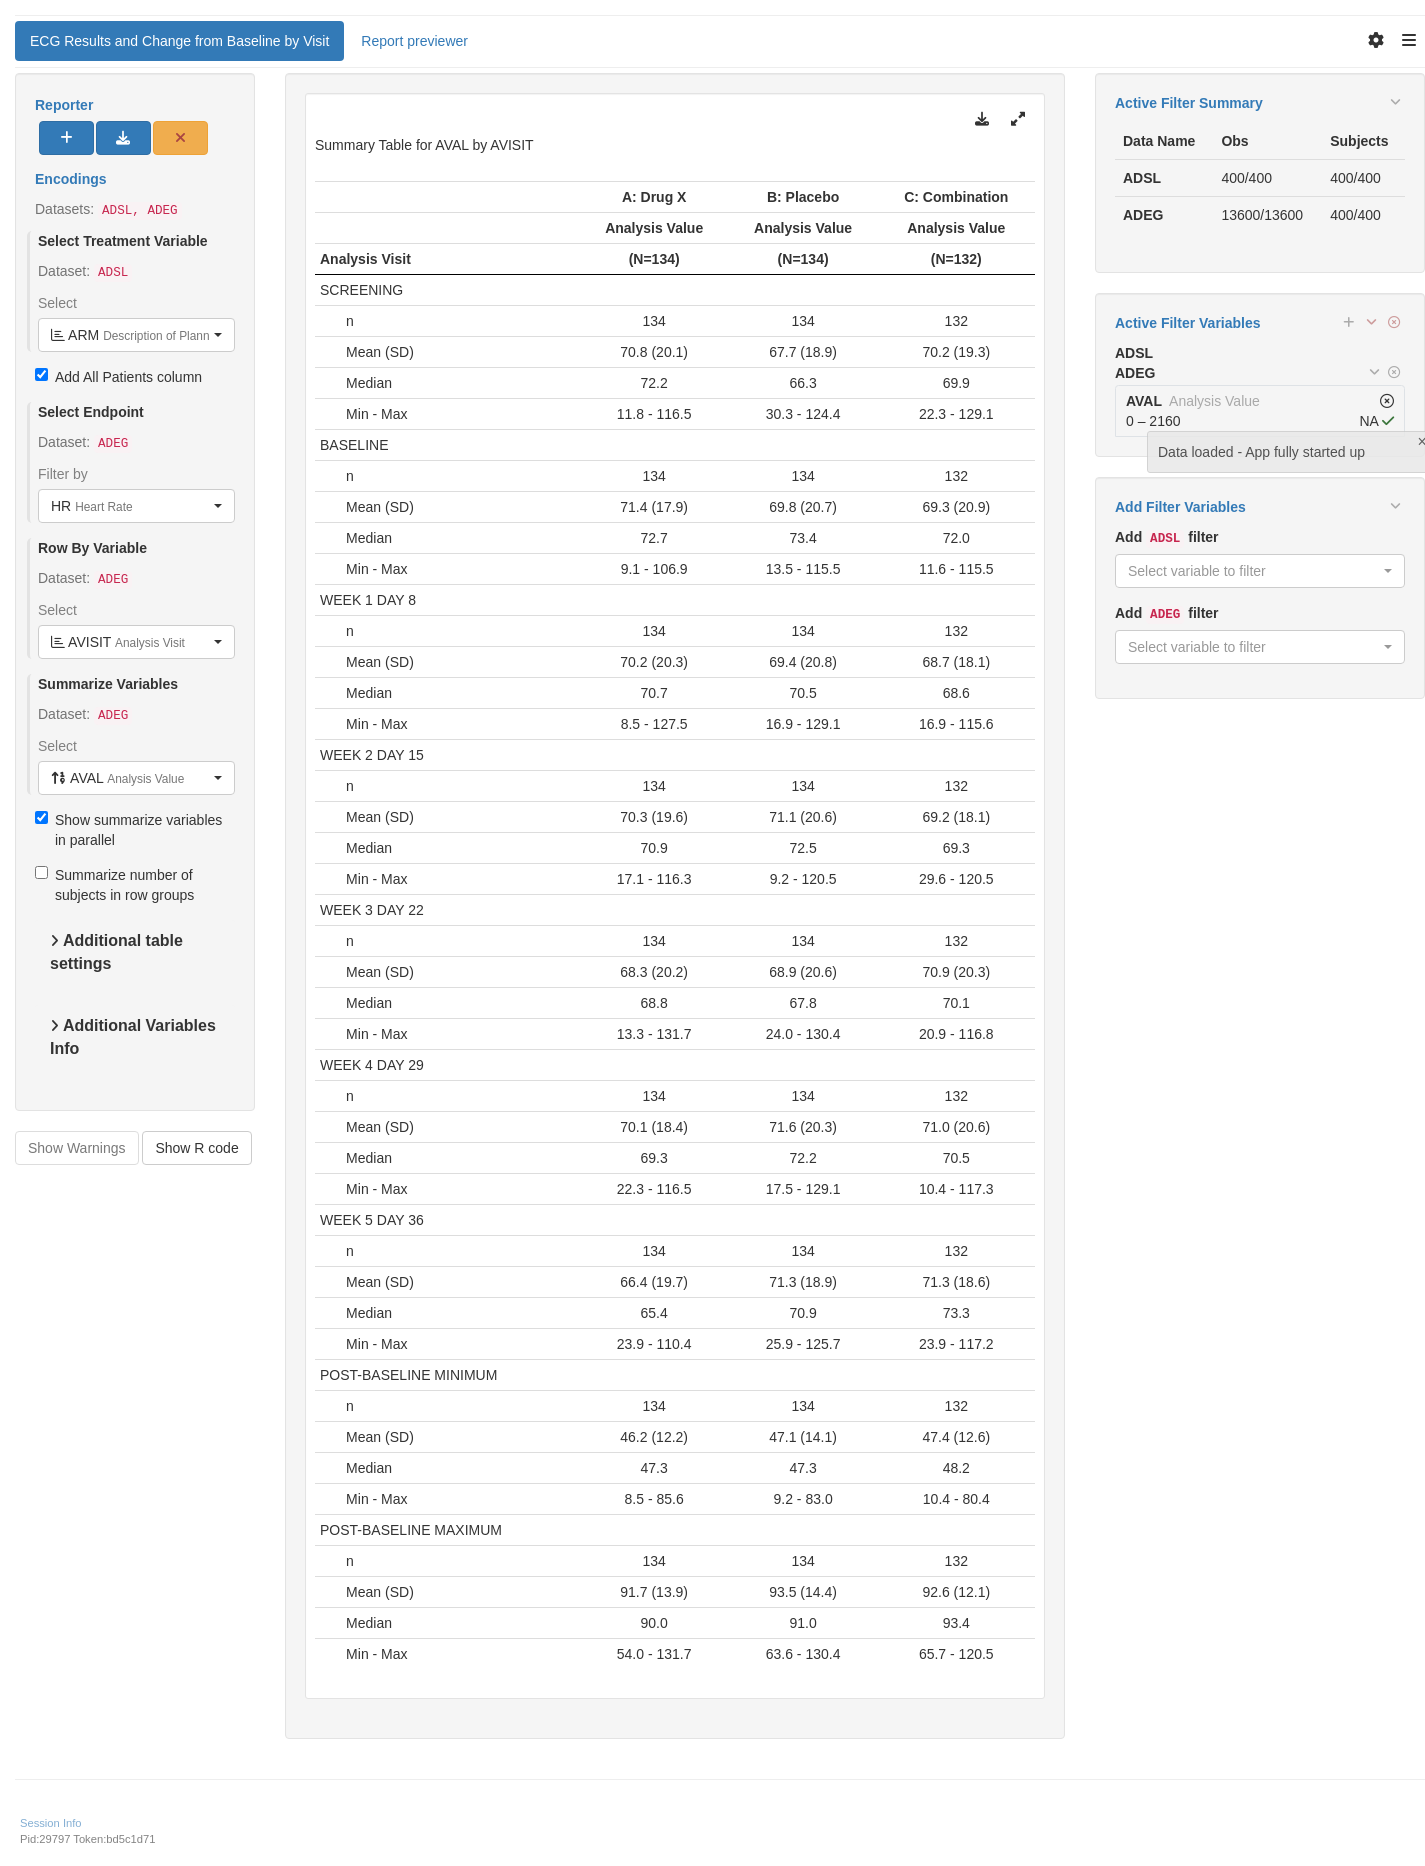
result A: Drug X B: Placebo C: Combination
Change from Change from Change from
Parameter Value at Visit Baseline Value at Visit Baseline Value at Visit Baseline
Analysis Visit (N=134) (N=134) (N=134) (N=134) (N=132) (N=132)
————————————————————————————————————————————————————————————————————————————————————————————————————————————————————————————————————————
Heart Rate
BASELINE
n 134 134 132
Mean (SD) 71.45 (17.93) 69.83 (20.72) 69.34 (20.95)
Median 72.70 73.35 71.96
Min - Max 9.09 - 106.91 13.49 - 115.52 11.63 - 115.49
WEEK 1 DAY 8
n 134 134 134 134 132 132
Mean (SD) 70.19 (20.27) -1.26 (25.97) 69.43 (20.80) -0.40 (29.73) 68.65 (18.06) -0.69 (27.81)
Median 70.70 -2.20 70.46 -0.52 68.57 -0.76
Min - Max 8.53 - 127.50 -50.97 - 89.16 16.85 - 129.14 -68.18 - 88.38 16.87 - 115.60 -68.25 - 67.20
WEEK 2 DAY 15
n 134 134 134 134 132 132
Mean (SD) 70.32 (19.56) -1.13 (26.26) 71.11 (20.56) 1.28 (31.35) 69.19 (18.06) -0.15 (28.61)
Median 70.88 -1.10 72.52 -0.31 69.30 -1.55
Min - Max 17.14 - 116.32 -85.03 - 67.52 9.22 - 120.54 -73.07 - 81.44 29.62 - 120.50 -67.75 - 66.29
WEEK 3 DAY 22
n 134 134 134 134 132 132
Mean (SD) 68.25 (20.17) -3.20 (28.66) 68.95 (20.56) -0.88 (30.14) 70.88 (20.28) 1.54 (27.28)
Median 68.79 -2.17 67.80 1.19 70.12 0.14
Min - Max 13.33 - 131.73 -81.20 - 72.57 23.98 - 130.41 -73.03 - 103.31 20.91 - 116.79 -64.51 - 72.52
WEEK 4 DAY 29
n 134 134 134 134 132 132
Mean (SD) 70.06 (18.41) -1.38 (26.59) 71.60 (20.34) 1.77 (30.26) 71.02 (20.59) 1.68 (29.60)
Median 69.33 -4.54 72.21 -0.88 70.52 3.81
Min - Max 22.30 - 116.51 -58.07 - 77.32 17.53 - 129.06 -64.32 - 85.34 10.35 - 117.30 -65.91 - 105.67
WEEK 5 DAY 36
n 134 134 134 134 132 132
Mean (SD) 66.41 (19.74) -5.04 (27.11) 71.25 (18.92) 1.42 (27.08) 71.26 (18.56) 1.92 (29.59)
Median 65.40 -6.83 70.86 0.64 73.29 1.74
Min - Max 23.89 - 110.38 -73.26 - 57.24 25.86 - 125.73 -71.15 - 67.37 23.89 - 117.19 -58.23 - 68.86
QT Duration
BASELINE
n 134 134 132
Mean (SD) 336.83 (117.96) 351.00 (98.44) 352.60 (105.11)
Median 344.41 351.48 347.96
Min - Max 86.98 - 665.40 98.90 - 641.92 105.68 - 628.14
WEEK 1 DAY 8
n 134 134 134 134 132 132
Mean (SD) 342.57 (101.09) 5.74 (159.94) 363.95 (102.34) 12.94 (140.73) 359.42 (105.16) 6.83 (147.13)
Median 347.26 -1.78 356.54 13.73 363.84 8.69
Min - Max 91.63 - 591.42 -346.44 - 452.75 114.92 - 656.45 -317.53 - 416.35 51.91 - 611.88 -473.19 - 358.00
WEEK 2 DAY 15
n 134 134 134 134 132 132
Mean (SD) 353.24 (93.93) 16.41 (162.10) 345.93 (96.78) -5.08 (152.51) 335.69 (98.61) -16.91 (138.45)
Median 351.10 16.72 346.83 -9.68 320.96 -22.27
Min - Max 138.01 - 587.30 -414.07 - 389.16 146.42 - 556.07 -440.28 - 364.76 104.91 - 562.34 -326.55 - 325.27
WEEK 3 DAY 22
n 134 134 134 134 132 132
Mean (SD) 370.12 (101.57) 33.28 (152.78) 343.41 (102.58) -7.59 (138.80) 346.95 (94.96) -5.65 (144.65)
Median 378.21 39.59 335.12 -15.89 352.15 9.11
Min - Max 118.14 - 615.18 -391.72 - 520.09 63.37 - 566.51 -311.28 - 293.76 126.09 - 580.81 -412.11 - 410.01
WEEK 4 DAY 29
n 134 134 134 134 132 132
Mean (SD) 345.77 (95.97) 8.94 (145.65) 354.38 (108.29) 3.37 (142.39) 341.36 (106.75) -11.24 (145.65)
Median 340.13 5.58 346.70 -17.13 352.30 -11.87
Min - Max 110.12 - 616.58 -393.34 - 456.04 80.82 - 687.69 -439.90 - 364.80 4.95 - 570.61 -480.94 - 330.67
WEEK 5 DAY 36
n 134 134 134 134 132 132
Mean (SD) 358.90 (97.69) 22.07 (155.68) 338.65 (99.26) -12.36 (130.46) 349.30 (95.77) -3.30 (136.00)
Median 351.96 5.89 344.17 0.40 350.32 12.68
Min - Max 88.38 - 661.12 -353.30 - 539.84 31.25 - 563.90 -338.85 - 352.75 119.02 - 581.83 -311.45 - 295.53
RR Duration
BASELINE
n 134 134 132
Mean (SD) 1028.42 (286.38) 1027.48 (324.00) 1074.62 (277.33)
Median 1041.86 1047.27 1080.87
Min - Max 34.33 - 1783.71 5.29 - 1877.19 289.60 - 1617.06
WEEK 1 DAY 8
n 134 134 134 134 132 132
Mean (SD) 990.15 (318.74) -38.26 (446.40) 1061.59 (269.14) 34.10 (401.76) 1039.64 (284.39) -34.98 (406.04)
Median 963.88 -86.50 1061.50 66.91 1014.78 -97.83
Min - Max 110.82 - 2014.56 -1014.82 - 1389.40 276.83 - 1711.99 -942.16 - 993.82 498.21 - 1937.47 -958.61 - 908.90
WEEK 2 DAY 15
n 134 134 134 134 132 132
Mean (SD) 1013.37 (304.13) -15.05 (425.81) 1109.40 (318.23) 81.92 (453.11) 1045.21 (277.51) -29.41 (380.84)
Median 1040.69 40.49 1117.76 69.27 1034.64 -15.33
Min - Max 164.19 - 1677.10 -1216.10 - 1053.15 160.73 - 2048.73 -1127.10 - 1148.61 252.84 - 1722.33 -859.27 - 871.54
WEEK 3 DAY 22
n 134 134 134 134 132 132
Mean (SD) 1013.99 (304.99) -14.43 (406.53) 1118.35 (296.53) 90.86 (409.57) 1036.59 (268.52) -38.03 (421.48)
Median 1027.23 -50.54 1134.60 52.03 1030.72 -60.72
Min - Max 357.04 - 1798.65 -882.94 - 1080.26 97.14 - 1825.43 -887.06 - 1166.15 446.02 - 1713.38 -984.79 - 902.37
WEEK 4 DAY 29
n 134 134 134 134 132 132
Mean (SD) 1033.31 (313.92) 4.89 (483.15) 1079.76 (298.94) 52.28 (429.25) 1027.55 (295.86) -47.07 (378.23)
Median 1050.40 5.60 1051.61 69.55 1023.36 -49.52
Min - Max 54.33 - 1979.43 -1345.93 - 1195.41 347.94 - 1762.04 -826.43 - 1191.83 341.62 - 2144.86 -1002.03 - 1048.66
WEEK 5 DAY 36
n 134 134 134 134 132 132
Mean (SD) 1072.33 (282.90) 43.92 (379.05) 1058.45 (271.01) 30.97 (436.03) 1029.04 (271.21) -45.58 (405.53)
Median 1067.33 55.87 1068.95 33.61 1065.26 -34.40
Min - Max 352.97 - 2000.56 -1028.79 - 1418.57 208.83 - 1794.73 -978.97 - 1365.13 436.28 - 1794.07 -962.18 - 1329.88