RNAG5
RNAseq Differential Gene Expression Analysis
This page can be used as a template of how to use the available hermes functions to take differential gene expression analysis between samples in HermesData, visualize them in a volcano graph, and create an interactive volcano graph using teal.module.hermes.
The function used to calculate differential gene expression uses HermesData as input. See RNAG1 for details. In particular, the differential gene expression analysis does not require to normalize HermesData.
We can calculate a data frame in HermesDataDiffExpr class to include the gene differential expression between groups in HermesData using diff_expression() function. By default, diff_expression() function uses the limma-voom method to calculate the gene differential expression, unless specified otherwise as argument. The group argument is to set the groups for comparison. The group factors should be a 2-level factor in colData(HermesData).
We can also use the DESeq2 Method for gene differential expression.
It is also possible to pass additional arguments to the function behind the methods in the diff_expression(), ex. if we wish to change the type of size factor estimation when using the DESeq2 method. See ?DESeq2::DESeq() or ?limma::eBayes() for details about the additional parameters available.
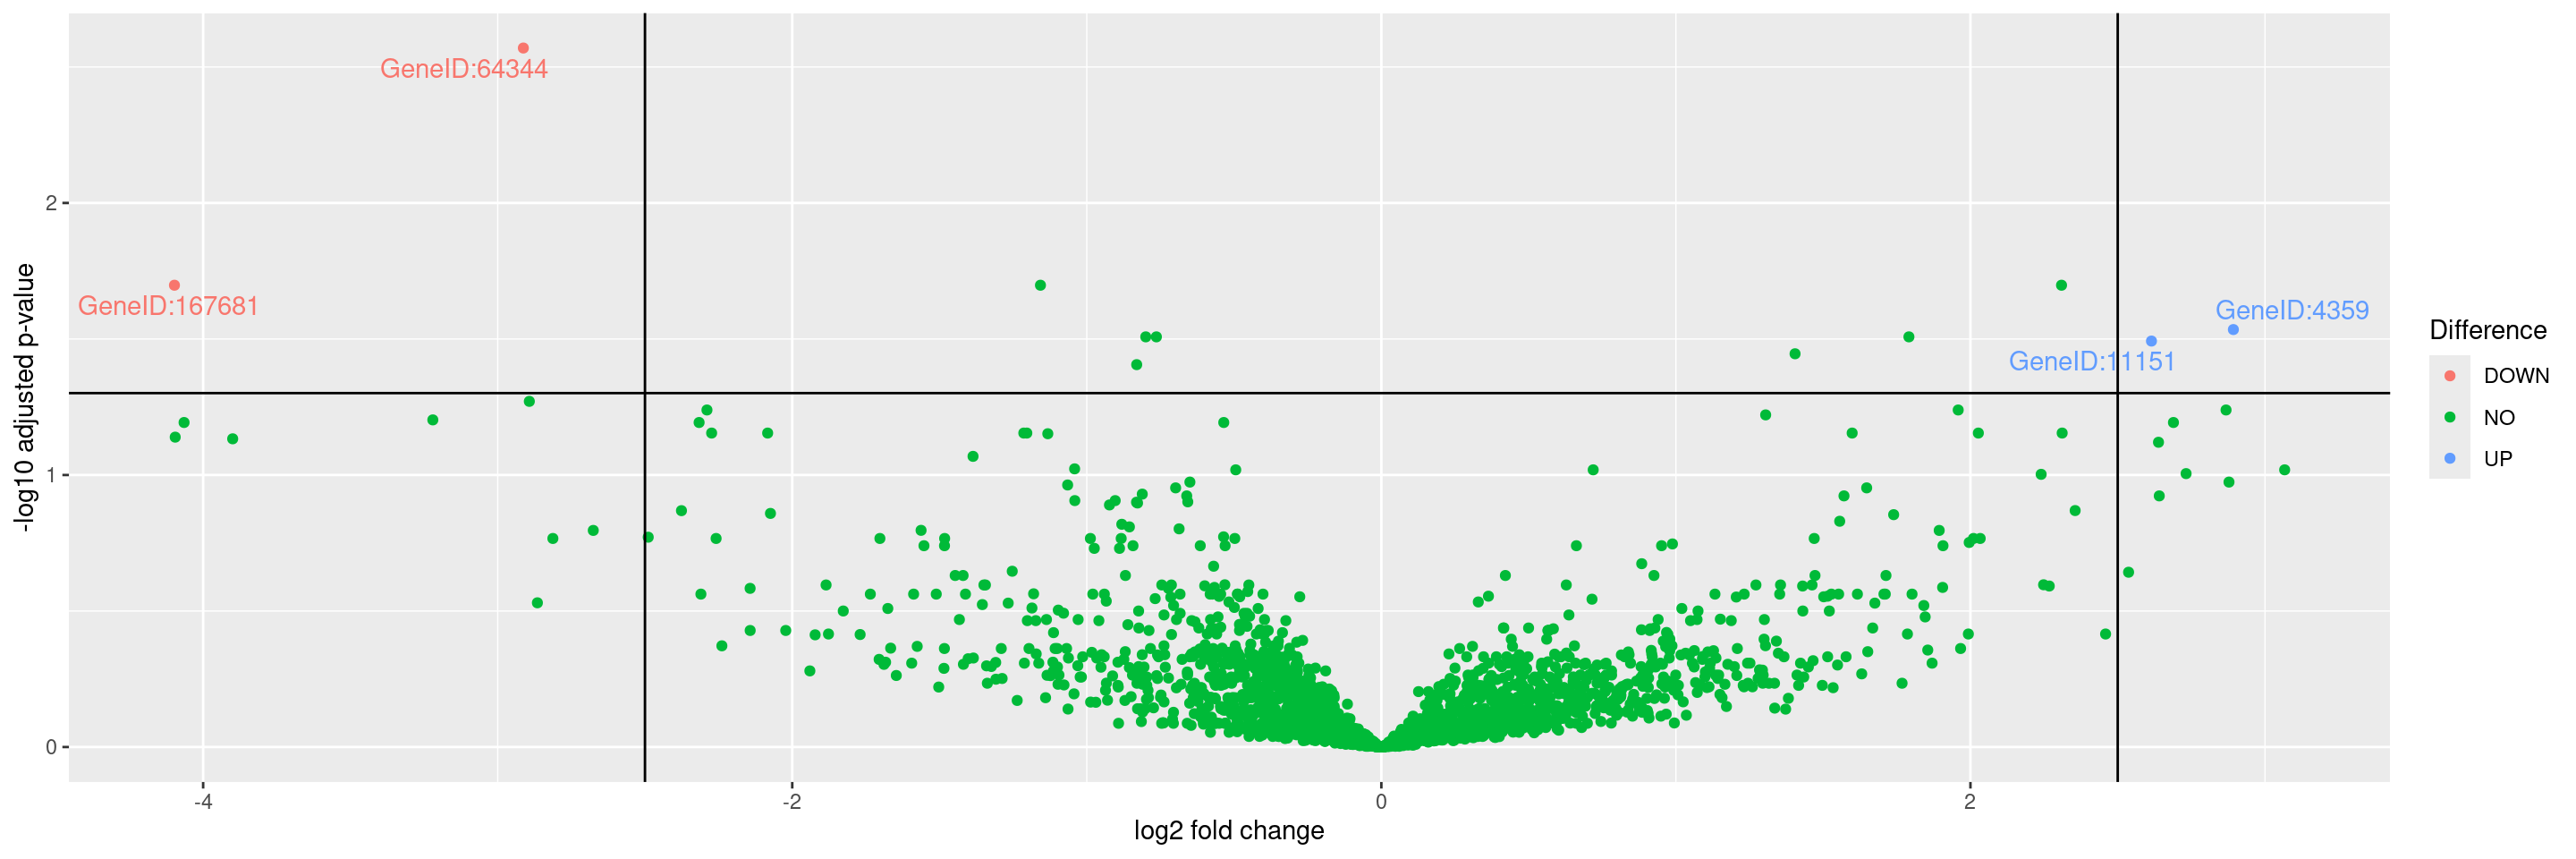
We can then plot a volcano graph for differential gene expression between groups in HermesData using the autoplot() function. The threshold values for adjusted p-values and log2 folder change can be specified.
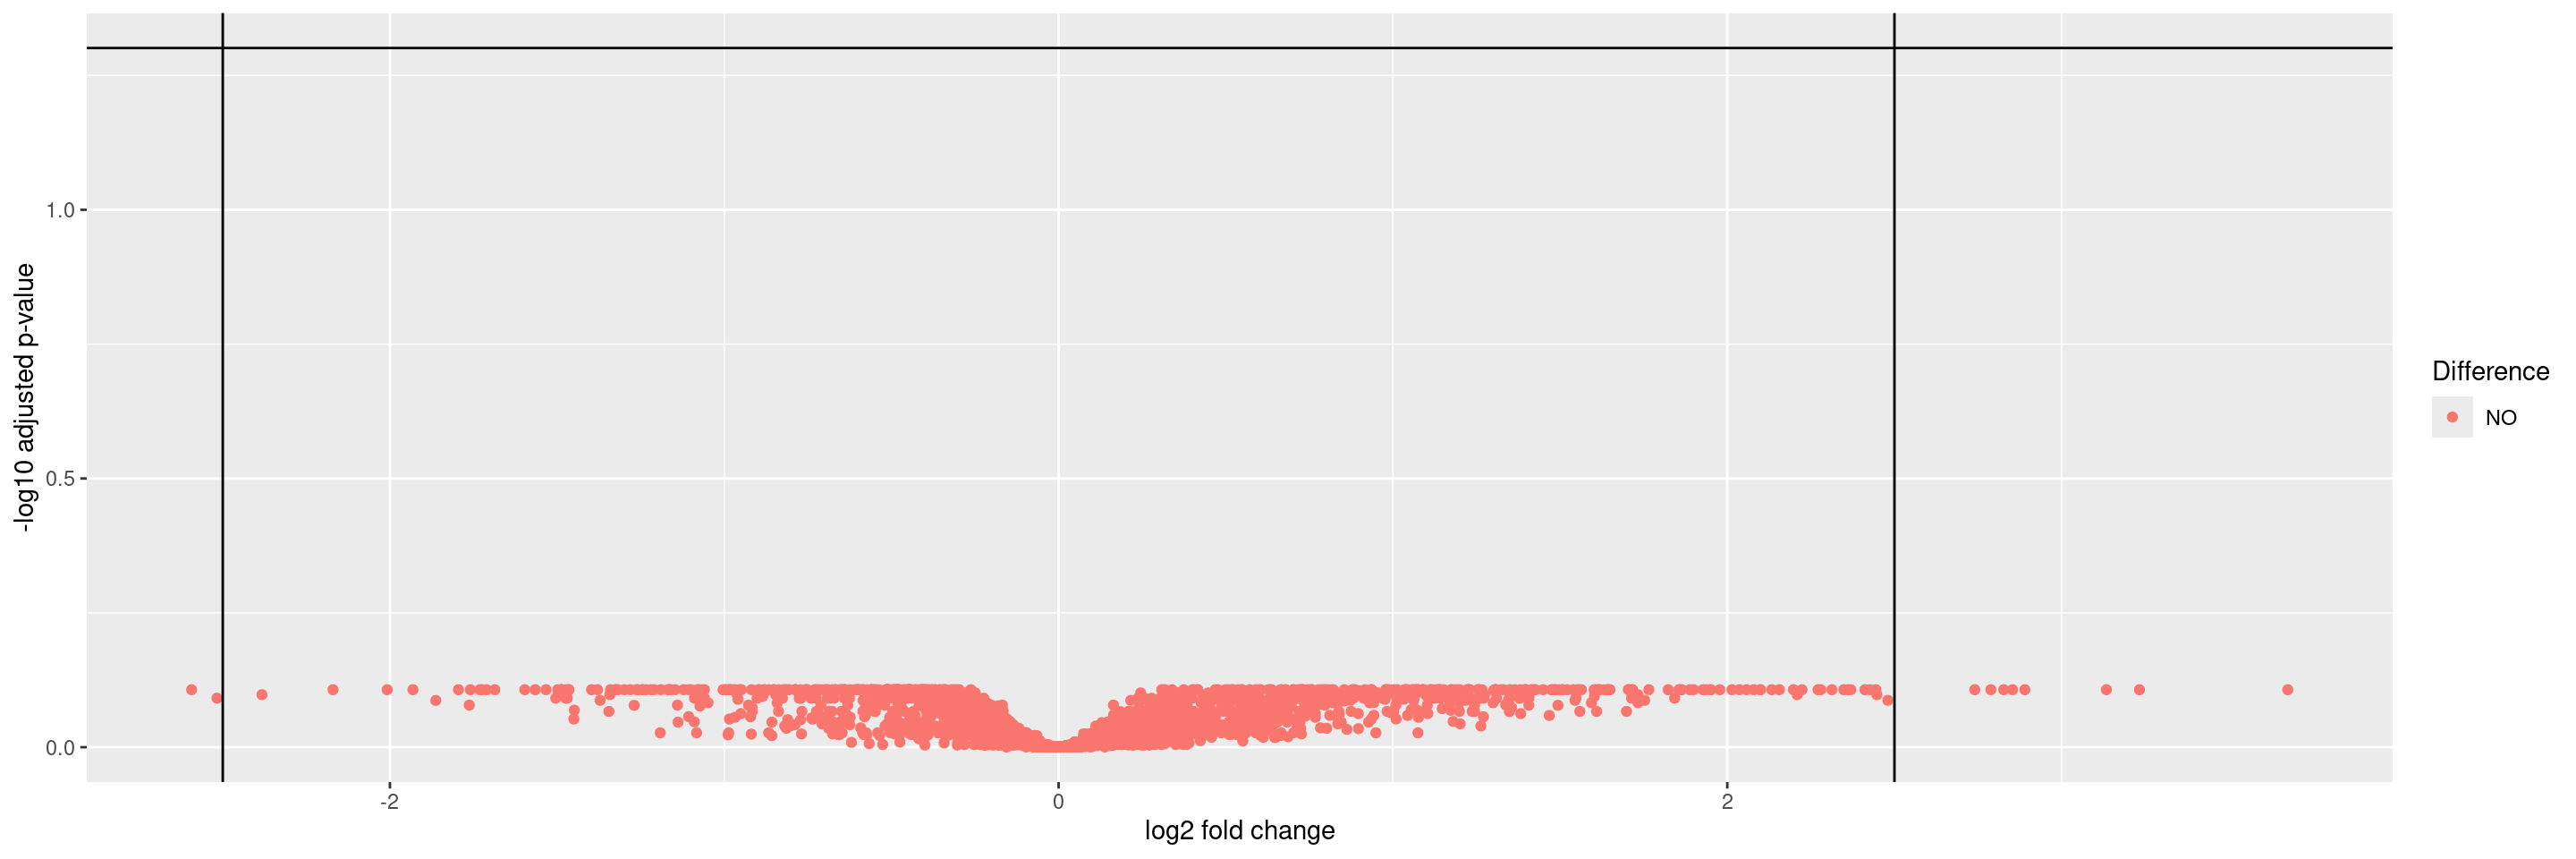
Warning: Removed 47 rows containing missing values or values outside the scale range
(`geom_point()`).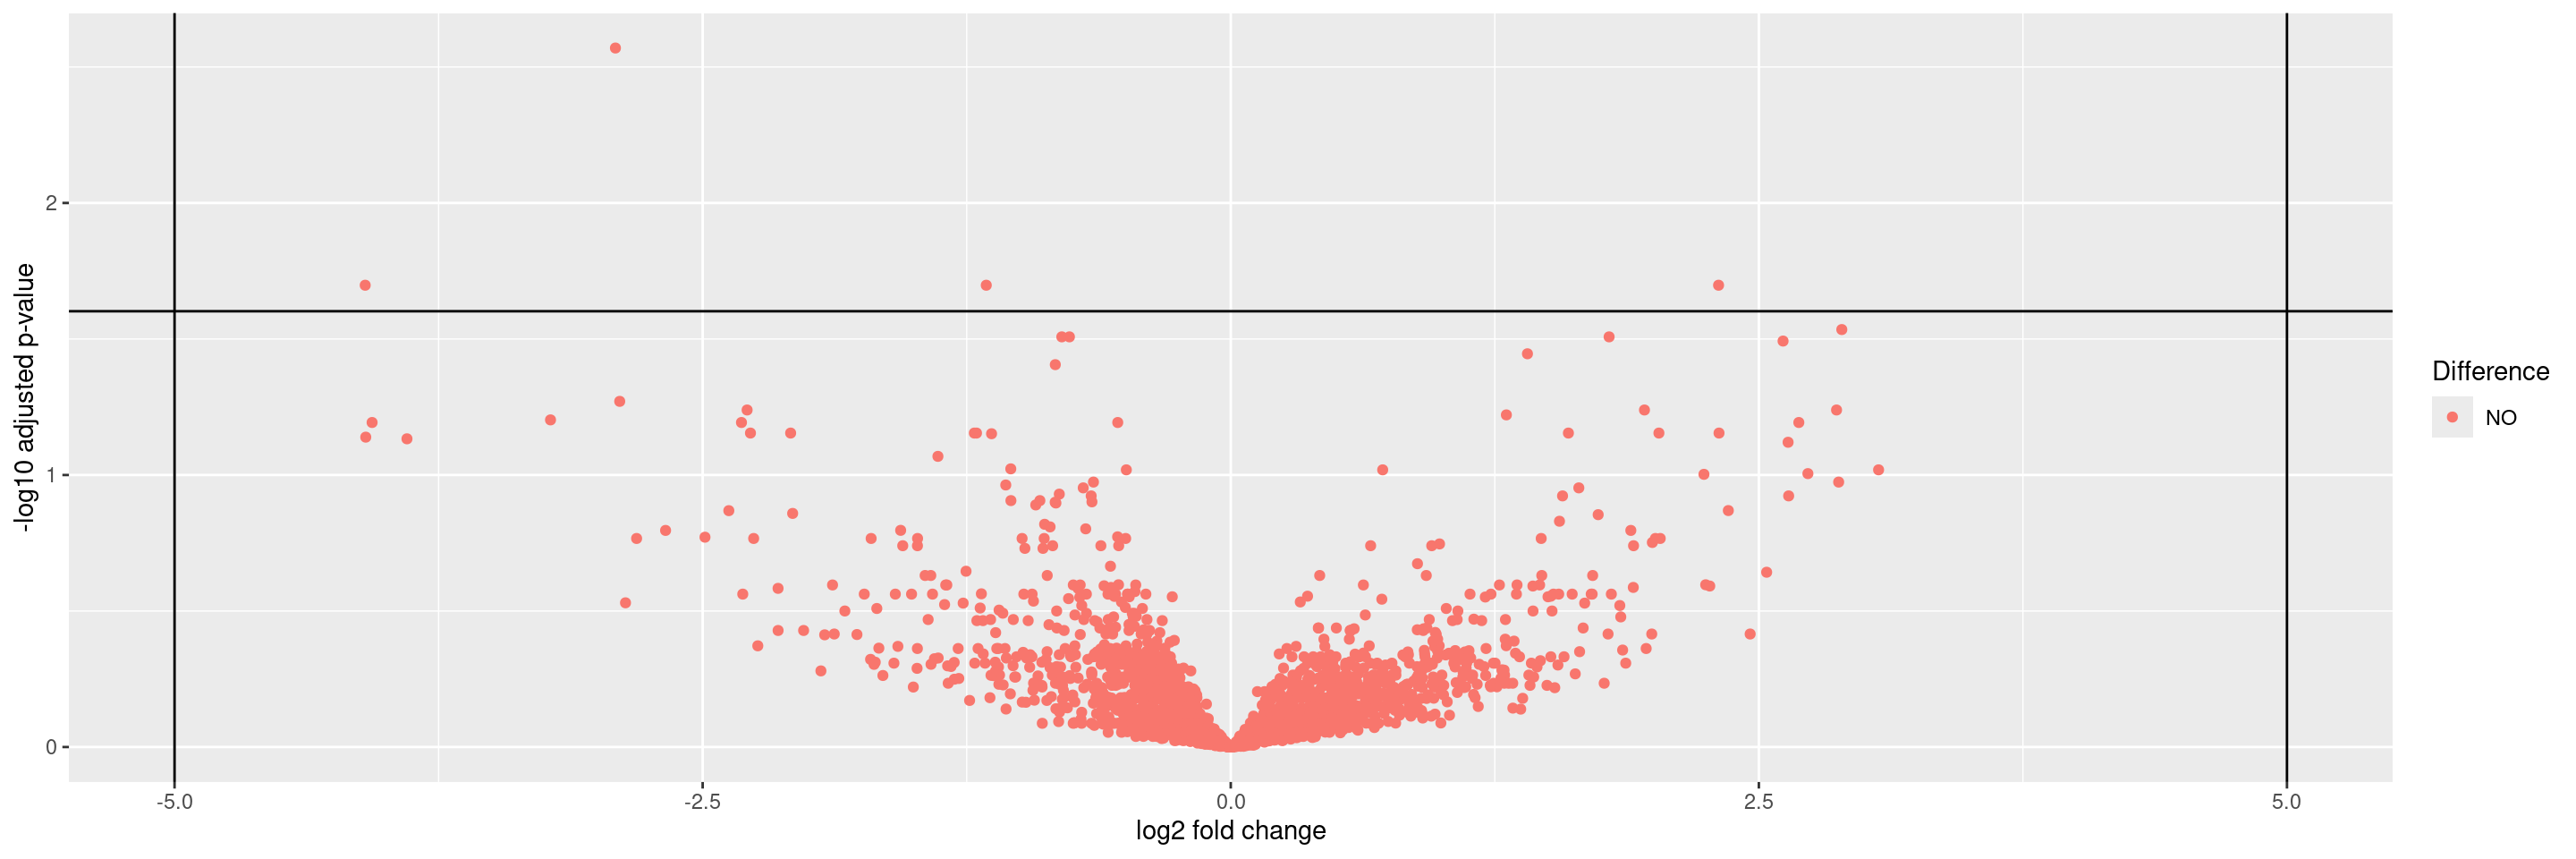
We start by importing a MultiAssayExperiment; here we use the example multi_assay_experiment available in hermes. It is wrapped as a teal::dataset. We can then use the provided teal module tm_g_volcanoplot to include a volcano graph module in our teal app.
Code
Warning: `datanames<-()` was deprecated in teal.data 0.7.0.
ℹ invalid to use `datanames()<-` or `names()<-` on an object of class
  `teal_data`. See ?names.teal_data
Code
Warning: 'experiments' dropped; see 'drops()'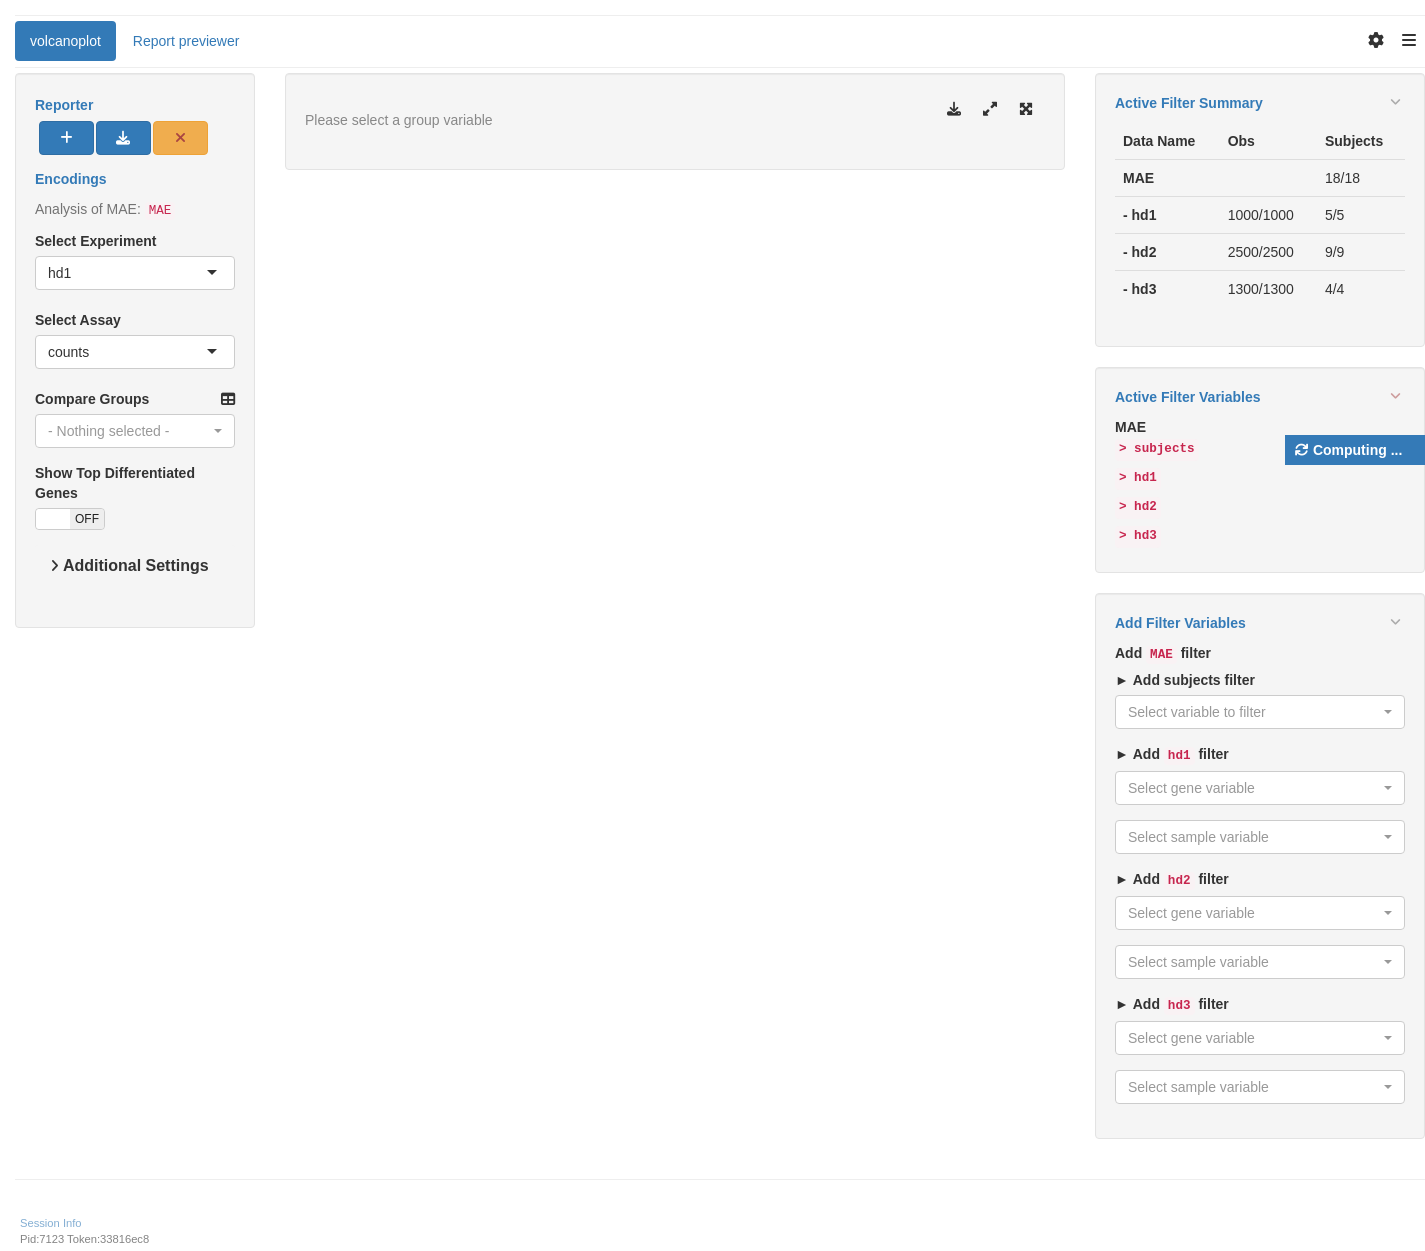
R version 4.5.2 (2025-10-31)
Platform: x86_64-pc-linux-gnu
Running under: Ubuntu 24.04.4 LTS

Matrix products: default
BLAS:   /usr/lib/x86_64-linux-gnu/openblas-pthread/libblas.so.3
LAPACK: /usr/lib/x86_64-linux-gnu/openblas-pthread/libopenblasp-r0.3.26.so;  LAPACK version 3.12.0

locale:
 [1] LC_CTYPE=en_US.UTF-8       LC_NUMERIC=C
 [3] LC_TIME=en_US.UTF-8        LC_COLLATE=en_US.UTF-8
 [5] LC_MONETARY=en_US.UTF-8    LC_MESSAGES=en_US.UTF-8
 [7] LC_PAPER=en_US.UTF-8       LC_NAME=C
 [9] LC_ADDRESS=C               LC_TELEPHONE=C
[11] LC_MEASUREMENT=en_US.UTF-8 LC_IDENTIFICATION=C

time zone: Etc/UTC
tzcode source: system (glibc)

attached base packages:
[1] stats4    stats     graphics  grDevices utils     datasets  methods
[8] base

other attached packages:
 [1] teal.modules.hermes_0.2.0   teal_1.1.0
 [3] teal.slice_0.7.1            teal.data_0.8.0
 [5] teal.code_0.7.1             shiny_1.13.0
 [7] hermes_1.14.0               SummarizedExperiment_1.40.0
 [9] Biobase_2.70.0              GenomicRanges_1.62.1
[11] Seqinfo_1.0.0               IRanges_2.44.0
[13] S4Vectors_0.48.0            BiocGenerics_0.56.0
[15] generics_0.1.4              MatrixGenerics_1.22.0
[17] matrixStats_1.5.0           ggfortify_0.4.19
[19] ggplot2_4.0.2

loaded via a namespace (and not attached):
  [1] RColorBrewer_1.1-3          jsonlite_2.0.0
  [3] shape_1.4.6.1               MultiAssayExperiment_1.36.2
  [5] magrittr_2.0.5              farver_2.1.2
  [7] rmarkdown_2.31              fs_2.0.1
  [9] GlobalOptions_0.1.4         ragg_1.5.2
 [11] vctrs_0.7.2                 memoise_2.0.1
 [13] webshot_0.5.5               htmltools_0.5.9
 [15] S4Arrays_1.10.1             forcats_1.0.1
 [17] BiocBaseUtils_1.13.0        progress_1.2.3
 [19] curl_7.0.0                  SparseArray_1.10.10
 [21] sass_0.4.10                 bslib_0.10.0
 [23] fontawesome_0.5.3           htmlwidgets_1.6.4
 [25] httr2_1.2.2                 cachem_1.1.0
 [27] teal.widgets_0.6.0          mime_0.13
 [29] lifecycle_1.0.5             iterators_1.0.14
 [31] pkgconfig_2.0.3             webshot2_0.1.2
 [33] Matrix_1.7-5                R6_2.6.1
 [35] fastmap_1.2.0               rbibutils_2.4.1
 [37] clue_0.3-68                 digest_0.6.39
 [39] colorspace_2.1-2            shinycssloaders_1.1.0
 [41] ps_1.9.2                    AnnotationDbi_1.72.0
 [43] DESeq2_1.50.2               crosstalk_1.2.2
 [45] textshaping_1.0.5           RSQLite_2.4.6
 [47] filelock_1.0.3              labeling_0.4.3
 [49] httr_1.4.8                  abind_1.4-8
 [51] compiler_4.5.2              bit64_4.6.0-1
 [53] withr_3.0.2                 doParallel_1.0.17
 [55] S7_0.2.1                    backports_1.5.1
 [57] bsicons_0.1.2               BiocParallel_1.44.0
 [59] DBI_1.3.0                   logger_0.4.1
 [61] biomaRt_2.66.2              rappdirs_0.3.4
 [63] DelayedArray_0.36.1         rjson_0.2.23
 [65] chromote_0.5.1              tools_4.5.2
 [67] otel_0.2.0                  httpuv_1.6.17
 [69] glue_1.8.0                  callr_3.7.6
 [71] promises_1.5.0              grid_4.5.2
 [73] checkmate_2.3.4             cluster_2.1.8.2
 [75] gtable_0.3.6                websocket_1.4.4
 [77] tidyr_1.3.2                 hms_1.1.4
 [79] XVector_0.50.0              ggrepel_0.9.8
 [81] foreach_1.5.2               pillar_1.11.1
 [83] stringr_1.6.0               limma_3.66.0
 [85] later_1.4.8                 circlize_0.4.18
 [87] dplyr_1.2.1                 BiocFileCache_3.0.0
 [89] lattice_0.22-9              bit_4.6.0
 [91] tidyselect_1.2.1            ComplexHeatmap_2.26.1
 [93] locfit_1.5-9.12             Biostrings_2.78.0
 [95] knitr_1.51                  gridExtra_2.3
 [97] teal.logger_0.4.1           edgeR_4.8.2
 [99] xfun_0.57                   statmod_1.5.1
[101] DT_0.34.0                   stringi_1.8.7
[103] yaml_2.3.12                 shinyWidgets_0.9.1
[105] evaluate_1.0.5              codetools_0.2-20
[107] tibble_3.3.1                cli_3.6.5
[109] xtable_1.8-8                systemfonts_1.3.2
[111] Rdpack_2.6.6                jquerylib_0.1.4
[113] processx_3.8.7              dichromat_2.0-0.1
[115] Rcpp_1.1.1                  teal.reporter_0.6.1
[117] dbplyr_2.5.2                png_0.1-9
[119] parallel_4.5.2              assertthat_0.2.1
[121] blob_1.3.0                  prettyunits_1.2.0
[123] scales_1.4.0                purrr_1.2.1
[125] crayon_1.5.3                GetoptLong_1.1.0
[127] rlang_1.2.0                 KEGGREST_1.50.0
[129] formatR_1.14                shinyjs_2.1.1