---
title: SFG5
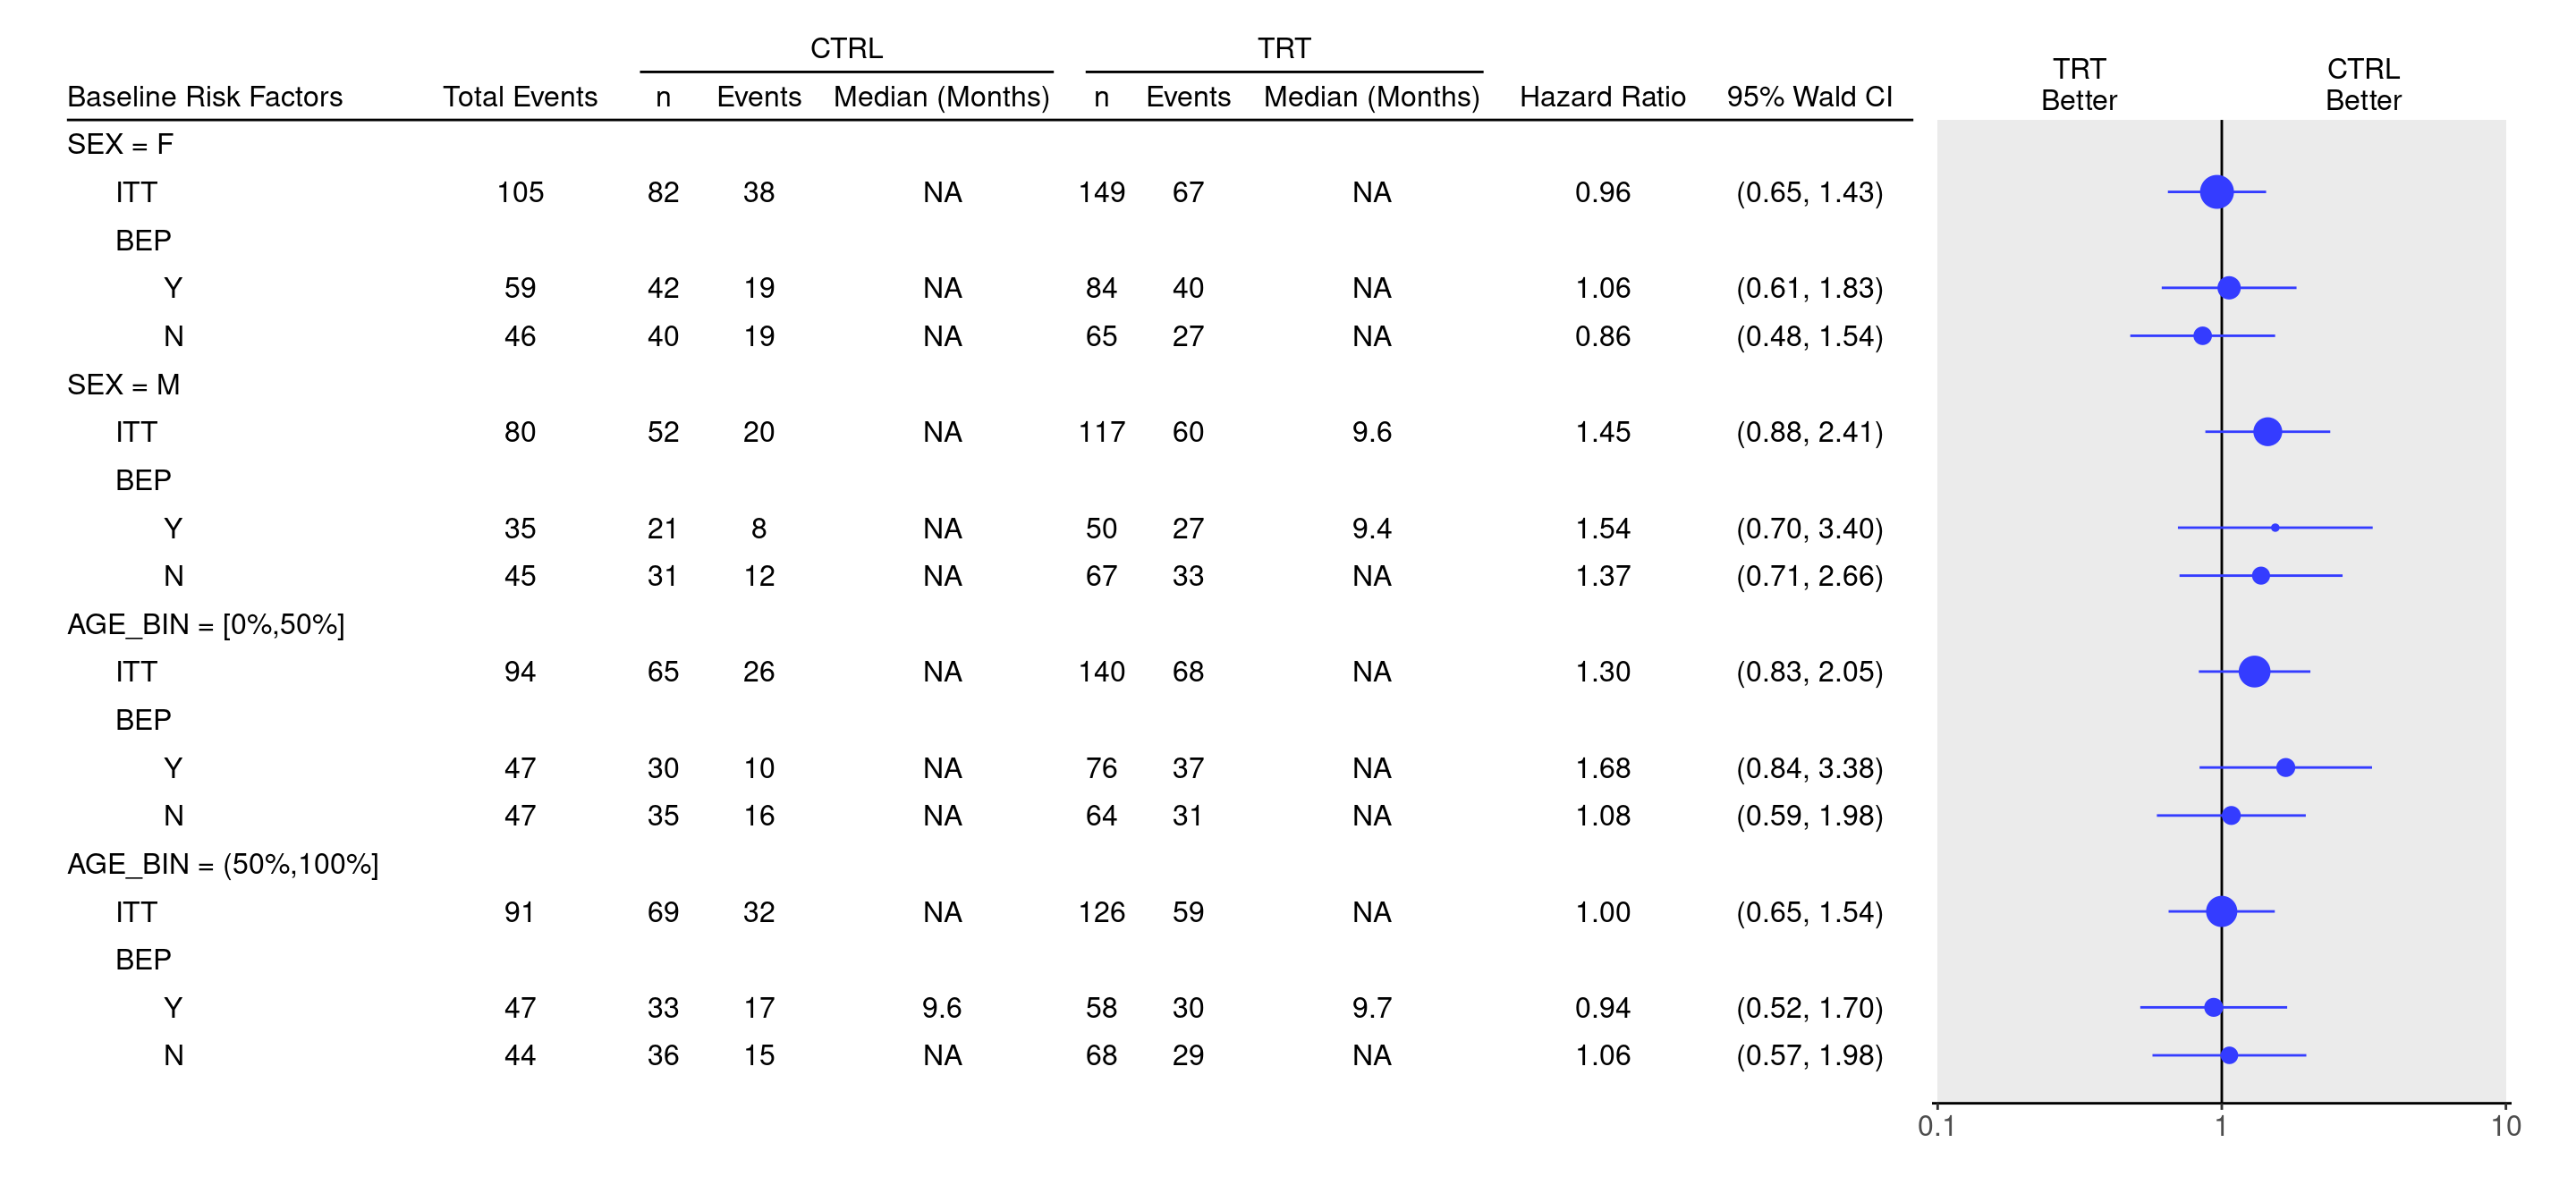
subtitle: Survival Forest Graphs Comparing on Subgroups
categories: [SFG]
---
------------------------------------------------------------------------
::: panel-tabset
{{< include setup.qmd >}}
## Plot
We create a `tables_all()` helper function first which creates a subtable with resulting statistics as e.g. in [SFG1](../../graphs/SFG1/sfg01.qmd) for each subgroup of interest.
```{r}
tables_all <- function(filter_var, filter_condition, sub_var) {
  dataset <- adtte %>%
    filter(!!as.name(filter_var) == filter_condition)
  if (nrow(dataset) == 0) {
    stop(paste("Subset", filter_var, "==", filter_condition, "is empty"))
  }
  tbl <- extract_survival_subgroups(
    variables = list(
      tte = "AVAL",
      is_event = "is_event",
      arm = "ARM_BIN",
      subgroups = sub_var
    ),
    label_all = "ITT",
    data = dataset
  )
  basic_table() %>%
    tabulate_survival_subgroups(
      df = tbl,
      vars = c("n_tot_events", "n", "n_events", "median", "hr", "ci"),
      time_unit = dataset$AVALU[1]
    )
}
```
Then we can call this helper function on the subsets we are interested in and have prepared in the above data setup chunk.
Note that e.g. the levels for `AGE_BIN` mentioned in the `filter_condition` argument need to be aligned with the `AGE_probs` cutoff(s) specified above.
Otherwise the subset might be empty and an according error message is shown.
```{r}
tables_list <- list(
  tables_all(filter_var = "SEX", filter_condition = "F", sub_var = "BEP01FL"),
  tables_all(filter_var = "SEX", filter_condition = "M", sub_var = "BEP01FL"),
  tables_all(filter_var = "AGE_BIN", filter_condition = "[0%,50%]", sub_var = "BEP01FL"),
  tables_all(filter_var = "AGE_BIN", filter_condition = "(50%,100%]", sub_var = "BEP01FL")
)
```
We can then add subtitles for each subtable, `rbind()` them together and produce the forest plot using the `g_forest()` function.
Similarly as in [SFG3](../../graphs/SFG3/sfg03.qmd) we need to specify the `col_x`, `col_y` and `forest_header` arguments for `g_forest()` by recovering them from one of the original tables.
For adding subtitles we use a small helper function:
```{r}
add_subtitle <- function(sub_tab, sub_title) {
  label_at_path(sub_tab, path = row_paths(sub_tab)[[1]][1]) <- sub_title
  sub_tab
}
```
So we can use this now:
```{r, fig.width = 15, fig.height = 7}
one_table <- tables_list[[1]]
result <- rbind(
  add_subtitle(tables_list[[1]], "SEX = F"),
  add_subtitle(tables_list[[2]], "SEX = M"),
  add_subtitle(tables_list[[3]], "AGE_BIN = [0%,50%]"),
  add_subtitle(tables_list[[4]], "AGE_BIN = (50%,100%]")
)
g_forest(
  result,
  col_x = attr(one_table, "col_x"),
  col_ci = attr(one_table, "col_ci"),
  forest_header = attr(one_table, "forest_header"),
  col_symbol_size = attr(one_table, "col_symbol_size")
)
```
{{< include ../../misc/session_info.qmd >}}
:::