---
title: SFG2D
subtitle: Survival Forest Graph for Overall Population and by Intervals of Continuous Biomarker with "Greater Than a Numerical Cutoff"
categories: [SFG]
---
------------------------------------------------------------------------
::: panel-tabset
{{< include setup.qmd >}}
## Plot
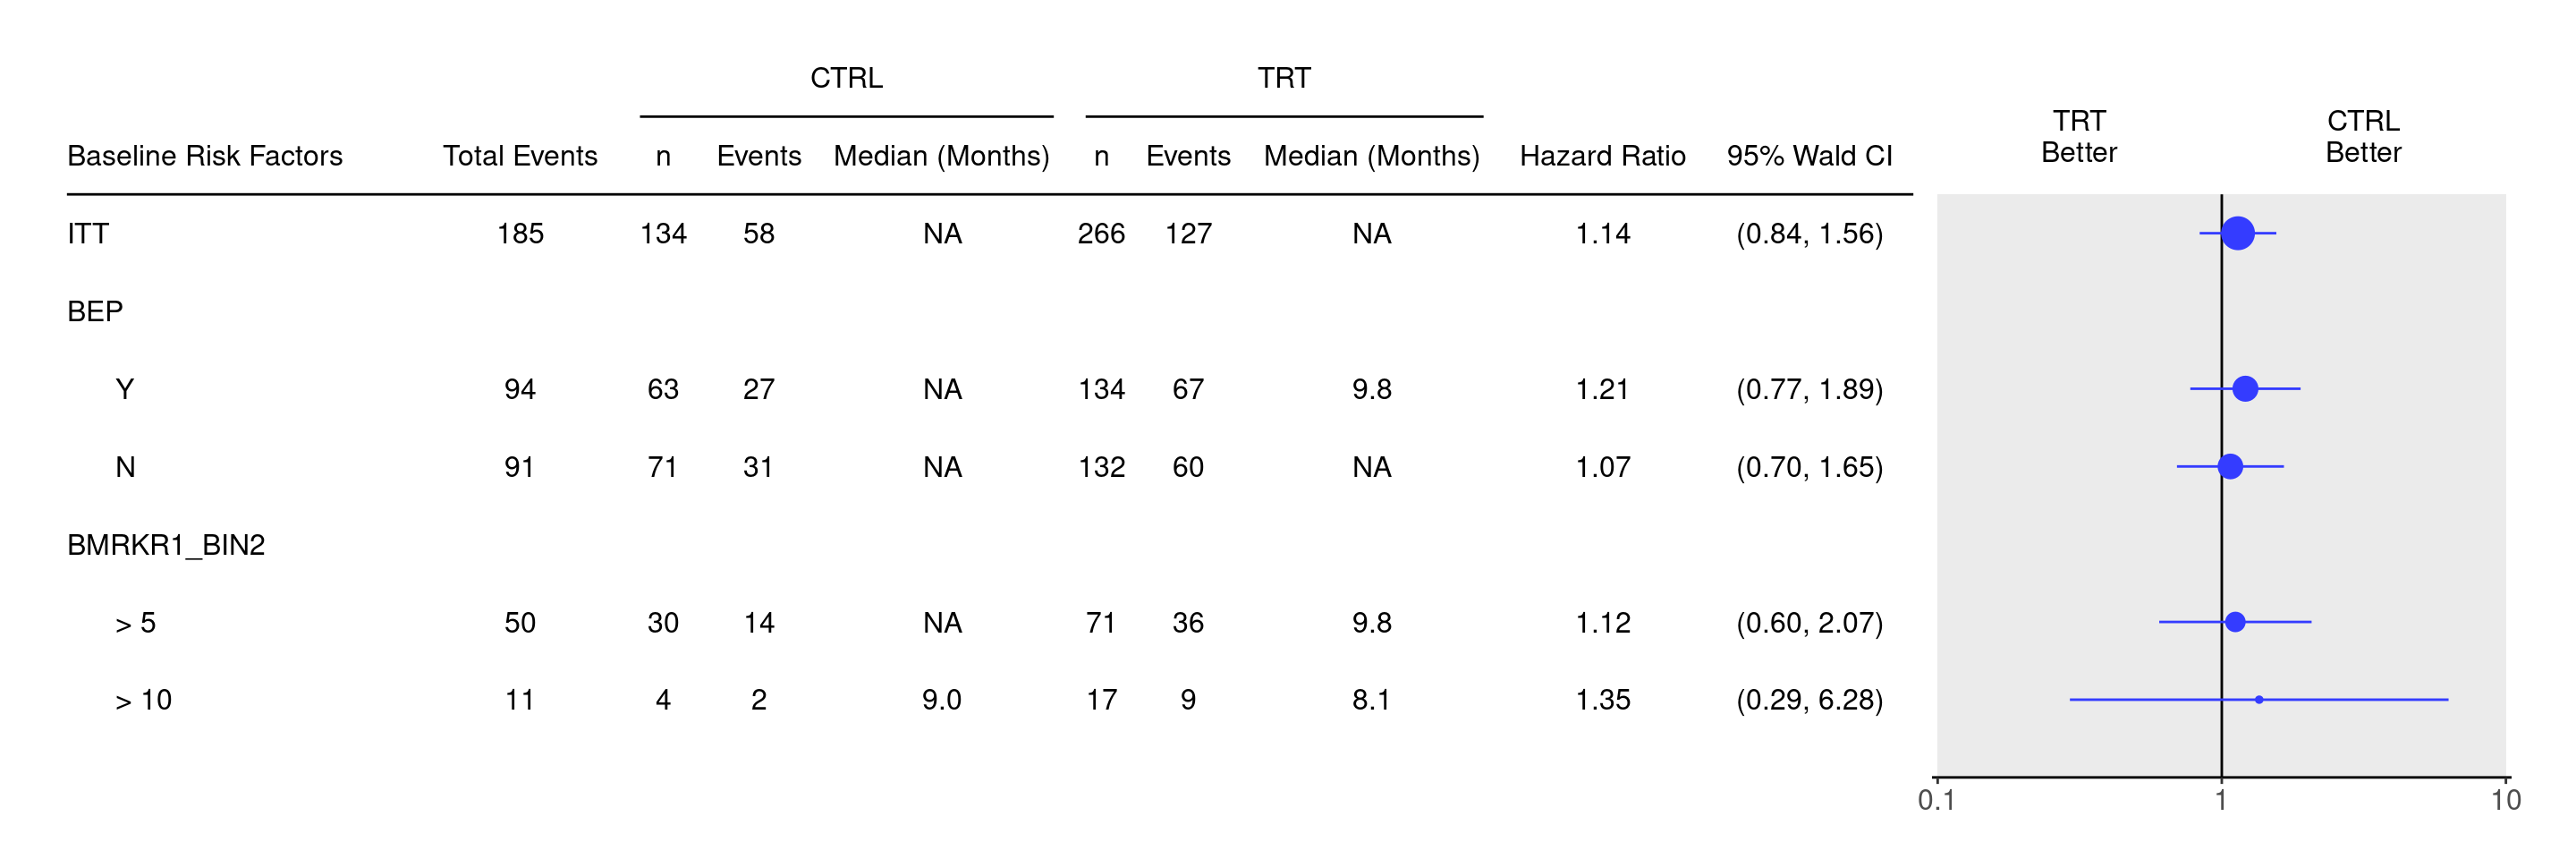
We start by deriving a new biomarker variable `BMRKR1_BIN2` with greater than numerical cutoffs for `BMRKR1` using the `cut()` funciton, and then tabulate the statistics as above to be able to use them as an input for the forest plot.
```{r}
BMRKR1_cuts <- c(0, 5, 10, Inf)

adtte <- adtte %>%
  mutate(
    BMRKR1_BIN2 = explicit_na(cut(
      BMRKR1,
      BMRKR1_cuts,
      include.lowest = FALSE,
      right = FALSE
    ))
  )

tbl <- extract_survival_subgroups(
  variables = list(
    tte = "AVAL",
    is_event = "is_event",
    arm = "ARM_BIN",
    subgroups = c("BEP01FL", "BMRKR1_BIN2")
  ),
  label_all = "ITT",
  groups_lists = list(
    BMRKR1_BIN2 = list(
      "> 5" = c("[5,10)", "[10,Inf)"),
      "> 10" = "[10,Inf)"
    )
  ),
  data = adtte
)

result <- basic_table() %>%
  tabulate_survival_subgroups(
    df = tbl,
    vars = c("n_tot_events", "n", "n_events", "median", "hr", "ci"),
    time_unit = adtte$AVALU[1]
  )
```
We can now produce forest plot using `g_forest()` function from `tern` based on this `result` table.
```{r, fig.width = 15}
g_forest(result)
```
{{< include ../../misc/session_info.qmd >}}
:::