---
title: RMPT01
subtitle: Duration of Exposure for Risk Management Plan
---
------------------------------------------------------------------------
{{< include ../../_utils/envir_hook.qmd >}}
```{r setup, echo = FALSE, warning = FALSE, message = FALSE}
library(tern)
library(dplyr)
adsl <- random.cdisc.data::cadsl
adex <- random.cdisc.data::cadex
# Ensure character variables are converted to factors and empty strings and NAs are explicit missing levels.
adsl <- df_explicit_na(adsl)
adex <- df_explicit_na(adex)
# Simulate ADEX records with PARAMCD == "TDURD" as they are not in sample random.cdisc.data dataset.
set.seed(1, kind = "Mersenne-Twister")
adex2 <- adex %>%
distinct(USUBJID, .keep_all = TRUE) %>%
mutate(
PARAMCD = "TDURD",
PARAM = "Overall duration (days)",
AVAL = sample(x = seq(1, 200), size = n(), replace = TRUE)
) %>%
bind_rows(adex)
# Now pre-processing steps are carried out.
anl <- adex2 %>%
filter(
PARAMCD == "TDURD",
PARCAT2 == "Drug A",
SAFFL == "Y"
) %>%
mutate(
aval_months = day2month(AVAL),
aval_months_cat = factor(case_when(
aval_months < 1 ~ "< 1 month",
aval_months >= 1 & aval_months < 3 ~ "1 to <3 months",
aval_months >= 3 & aval_months < 6 ~ "3 to <6 months",
TRUE ~ ">=6 months"
), levels = c("< 1 month", "1 to <3 months", "3 to <6 months", ">=6 months"))
)
adsl_f <- adsl %>% filter(adsl$SAFFL == "Y")
```
```{r include = FALSE}
webr_code_labels <- c("setup")
```
{{< include ../../_utils/webr_no_include.qmd >}}
## Output
:::: panel-tabset
## Standard Table
::: {.panel-tabset .nav-justified group="webr"}
## {{< fa regular file-lines sm fw >}} Preview
```{r variant1, test = list(result_v1 = "result")}
lyt <- basic_table(
  title = "Duration of Exposure: Safety-Evaluable Patients",
  main_footer = "* Patient Time is the sum of exposure across all patients in days.",
  show_colcounts = TRUE
) %>%
  summarize_patients_exposure_in_cols(
    var = "AVAL", col_split = TRUE,
    .labels = c(n_patients = "Number of Patients", sum_exposure = "Patient Time*"),
    custom_label = "Total Number of Patients and Patient Time"
  ) %>%
  analyze_patients_exposure_in_cols(
    var = "aval_months_cat",
    col_split = FALSE
  ) %>%
  append_topleft(c("", "Duration of exposure"))

result <- build_table(lyt, df = anl, alt_counts_df = adsl_f)
result
```
```{r include = FALSE}
webr_code_labels <- c("variant1")
```
{{< include ../../_utils/webr.qmd >}}
:::
## Data Setup
```{r setup}
#| code-fold: show
```
::::
{{< include ../../_utils/save_results.qmd >}}
## `teal` App
::: {.panel-tabset .nav-justified}
## {{< fa regular file-lines fa-sm fa-fw >}} Preview
```{r teal, opts.label = c("skip_if_testing", "app")}
library(teal.modules.clinical)
## Data reproducible code
data <- teal_data()
data <- within(data, {
library(dplyr)
ADSL <- random.cdisc.data::cadsl
ADEX <- random.cdisc.data::cadex
labels <- col_labels(ADEX)
set.seed(1, kind = "Mersenne-Twister")
ADEX <- ADEX %>%
distinct(USUBJID, .keep_all = TRUE) %>%
mutate(
PARAMCD = "TDURD",
PARAM = "Overall duration (days)",
AVAL = sample(x = seq(1, 200), size = n(), replace = TRUE),
AVALU = "Days"
) %>%
bind_rows(ADEX)
ADEX <- ADEX %>%
mutate(
aval_months = day2month(AVAL),
aval_months_cat = factor(case_when(
aval_months < 1 ~ "< 1 month",
aval_months >= 1 & aval_months < 3 ~ "1 to <3 months",
aval_months >= 3 & aval_months < 6 ~ "3 to <6 months",
TRUE ~ ">=6 months"
), levels = c("< 1 month", "1 to <3 months", "3 to <6 months", ">=6 months")) %>% with_label("Overall duration")
) %>%
select(-aval_months)
})
join_keys(data) <- default_cdisc_join_keys[c("ADSL", "ADEX")]
## Reusable Configuration For Modules
ADEX <- data[["ADEX"]]
## Setup App
app <- init(
data = data,
modules = modules(
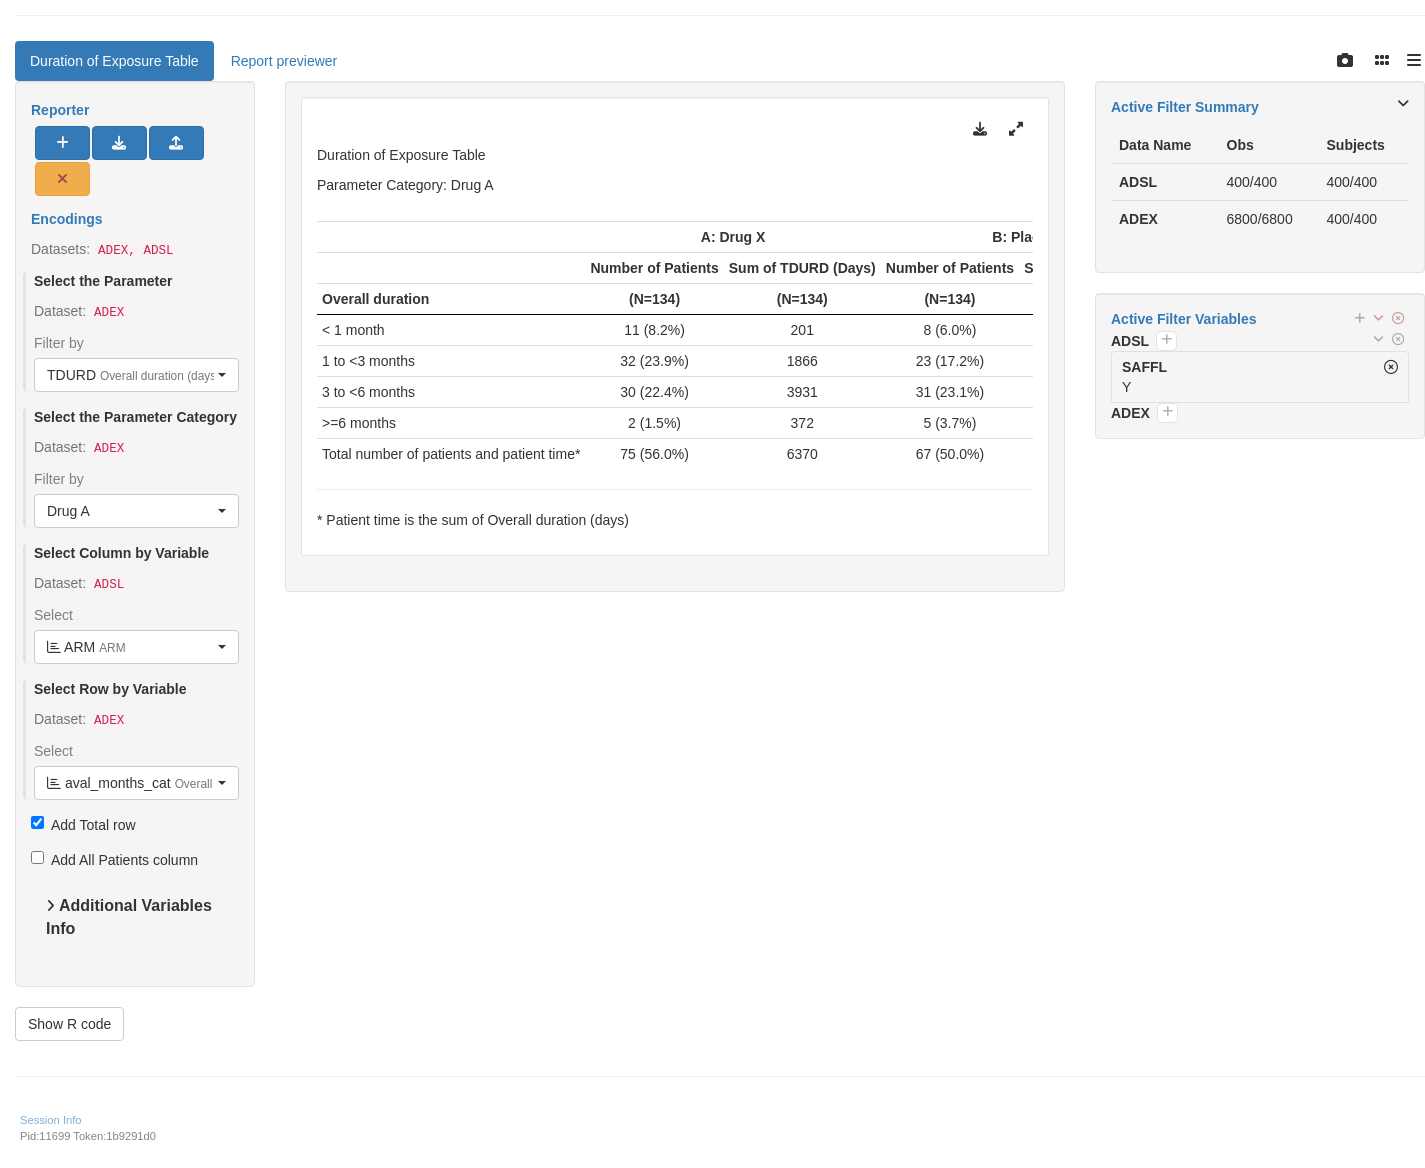
tm_t_exposure(
label = "Duration of Exposure Table",
dataname = "ADEX",
paramcd = choices_selected(
choices = value_choices(ADEX, "PARAMCD", "PARAM"),
selected = "TDURD"
),
col_by_var = choices_selected(
choices = variable_choices(ADEX, subset = c("ARM")),
selected = "ARM"
),
row_by_var = choices_selected(
choices = variable_choices(ADEX, subset = c("aval_months_cat", "RACE", "STRATA1", "SEX")),
selected = "aval_months_cat"
),
parcat = choices_selected(
choices = value_choices(ADEX, "PARCAT2"),
selected = "Drug A"
),
add_total = FALSE
)
),
filter = teal_slices(teal_slice("ADSL", "SAFFL", selected = "Y"))
)
shinyApp(app$ui, app$server)
```
{{< include ../../_utils/shinylive.qmd >}}
:::
{{< include ../../repro.qmd >}}