---
title: FSTG02
subtitle: Subgroup Analysis of Survival Duration
---
------------------------------------------------------------------------
{{< include ../../_utils/envir_hook.qmd >}}
```{r setup, echo = FALSE, warning = FALSE, message = FALSE}
library(tern)
library(dplyr)
library(forcats)
library(nestcolor)
preprocess_adtte <- function(adtte) {
# Save variable labels before data processing steps.
adtte_labels <- var_labels(adtte)
adtte <- adtte %>%
df_explicit_na() %>%
dplyr::filter(
PARAMCD == "OS",
ARM %in% c("B: Placebo", "A: Drug X"),
SEX %in% c("M", "F")
) %>%
dplyr::mutate(
# Reorder levels of ARM to display reference arm before treatment arm.
ARM = droplevels(forcats::fct_relevel(ARM, "B: Placebo")),
SEX = droplevels(SEX),
is_event = CNSR == 0,
# Convert time to MONTH
AVAL = day2month(AVAL),
AVALU = "Months"
) %>%
var_relabel(
ARM = adtte_labels["ARM"],
SEX = adtte_labels["SEX"],
is_event = "Event Flag",
AVAL = adtte_labels["AVAL"],
AVALU = adtte_labels["AVALU"]
)
adtte
}
anl <- random.cdisc.data::cadtte %>%
preprocess_adtte()
```
```{r include = FALSE}
webr_code_labels <- c("setup")
```
{{< include ../../_utils/webr_no_include.qmd >}}
## Output
::::::: panel-tabset
## Standard Plot
::: {.panel-tabset .nav-justified group="webr"}
## {{< fa regular file-lines sm fw >}} Preview
```{r plot1, test = list(plot_v1 = "plot"), fig.width = 15, fig.height = 4}
anl1 <- anl

df <- extract_survival_subgroups(
  variables = list(tte = "AVAL", is_event = "is_event", arm = "ARM", subgroups = c("SEX", "BMRKR2")),
  data = anl1
)

result <- basic_table() %>%
  tabulate_survival_subgroups(
    df = df,
    vars = c("n_tot", "n", "median", "hr", "ci"),
    time_unit = anl1$AVALU[1]
  )
result
# Add plot.
plot <- g_forest(tbl = result)
plot
```
```{r include = FALSE}
webr_code_labels <- c("plot1")
```
{{< include ../../_utils/webr.qmd >}}
:::
## Plot Specifying Class Variables and <br/> Options for the Treatment Variable
::: {.panel-tabset .nav-justified group="webr"}
## {{< fa regular file-lines sm fw >}} Preview
```{r plot2, test = list(plot_v2 = "plot"), fig.width = 15, fig.height = 4}
anl2 <- anl %>%
  mutate(
    # Recode levels of arm.
    ARM = forcats::fct_recode(
      ARM,
      "Placebo" = "B: Placebo",
      "Drug X" = "A: Drug X"
    ),
    # Reorder levels of `SEX`.
    SEX = forcats::fct_relevel(SEX, "M", "F"),
    # Reorder levels of `STRATA1`` by frequency.
    STRATA1 = forcats::fct_infreq(STRATA1)
  )

df <- extract_survival_subgroups(
  variables = list(tte = "AVAL", is_event = "is_event", arm = "ARM", subgroups = c("SEX", "STRATA1")),
  data = anl2
)

result <- basic_table() %>%
  tabulate_survival_subgroups(
    df = df,
    vars = c("n_tot", "n", "median", "hr", "ci"),
    time_unit = anl2$AVALU[1]
  )
result
plot <- g_forest(tbl = result)
plot
```
```{r include = FALSE}
webr_code_labels <- c("plot2")
```
{{< include ../../_utils/webr.qmd >}}
:::
## Plot Selecting Columns and <br/> Changing the Alpha Level
::: {.panel-tabset .nav-justified group="webr"}
## {{< fa regular file-lines sm fw >}} Preview
```{r plot3, test = list(plot_v3 = "plot"), fig.width = 8, fig.height = 4}
anl3 <- anl

df <- extract_survival_subgroups(
  variables = list(tte = "AVAL", is_event = "is_event", arm = "ARM", subgroups = c("SEX", "BMRKR2")),
  control = control_coxph(conf_level = 0.9),
  data = anl3
)

result <- basic_table() %>%
  tabulate_survival_subgroups(
    df = df,
    vars = c("n_tot", "hr", "ci")
  )
result
# Add plot.
plot <- g_forest(tbl = result)
plot
```
```{r include = FALSE}
webr_code_labels <- c("plot3")
```
{{< include ../../_utils/webr.qmd >}}
:::
## Plot with Fixed <br/> Symbol Size
::: {.panel-tabset .nav-justified group="webr"}
## {{< fa regular file-lines sm fw >}} Preview
```{r plot4, test = list(plot_v4 = "plot"), fig.width = 15, fig.height = 4}
anl4 <- anl

df <- extract_survival_subgroups(
  variables = list(tte = "AVAL", is_event = "is_event", arm = "ARM", subgroups = c("SEX", "BMRKR2")),
  data = anl4
)

result <- basic_table() %>%
  tabulate_survival_subgroups(
    df = df,
    vars = c("n_tot", "n", "median", "hr", "ci"),
    time_unit = anl4$AVALU[1]
  )
result
# Add plot.
plot <- g_forest(
  tbl = result,
  col_symbol_size = NULL
)
plot
```
```{r test parameters, test = list(width = "width", height = "height", plot_v3.width = "plot_v3.width"), echo = FALSE}
width <- 15
height <- 4
plot_v3.width <- 8 # nolint: object_name.
```
```{r include = FALSE}
webr_code_labels <- c("plot4")
```
{{< include ../../_utils/webr.qmd >}}
:::
## Data Setup
```{r setup}
#| code-fold: show
```
:::::::
{{< include ../../_utils/save_results.qmd >}}
## `teal` App
::: {.panel-tabset .nav-justified}
## {{< fa regular file-lines fa-sm fa-fw >}} Preview
```{r teal, opts.label = c("skip_if_testing", "app")}
library(teal.modules.clinical)

## Data reproducible code
data <- teal_data()
data <- within(data, {
  library(dplyr)
  library(forcats)

  ADSL <- random.cdisc.data::cadsl
  ADSL <- ADSL %>%
    filter(ARM %in% c("B: Placebo", "A: Drug X")) %>%
    mutate(ARM = droplevels(fct_relevel(ARM, "B: Placebo"))) %>%
    mutate(ARMCD = droplevels(fct_relevel(ARMCD, "ARM B")))
  ADSL$RACE <- droplevels(ADSL$RACE)

  ADTTE <- random.cdisc.data::cadtte
  adtte_labels <- col_labels(ADTTE)

  ADTTE <- ADTTE %>%
    filter(
      PARAMCD == "OS",
      ARM %in% c("B: Placebo", "A: Drug X"),
      SEX %in% c("M", "F")
    ) %>%
    mutate(
      # Reorder levels of ARM to display reference arm before treatment arm.
      ARM = droplevels(fct_relevel(ARM, "B: Placebo")),
      SEX = droplevels(SEX),
      is_event = CNSR == 0,
      # Convert time to MONTH
      AVAL = day2month(AVAL),
      AVALU = "Months"
    ) %>%
    col_relabel(
      ARM = adtte_labels["ARM"],
      SEX = adtte_labels["SEX"],
      is_event = "Event Flag",
      AVAL = adtte_labels["AVAL"],
      AVALU = adtte_labels["AVALU"]
    )
})
join_keys(data) <- default_cdisc_join_keys[c("ADSL", "ADTTE")]

## Reusable Configuration For Modules
ADSL <- data[["ADSL"]]
ADTTE <- data[["ADTTE"]]

## Setup App
app <- init(
  data = data,
  modules = modules(
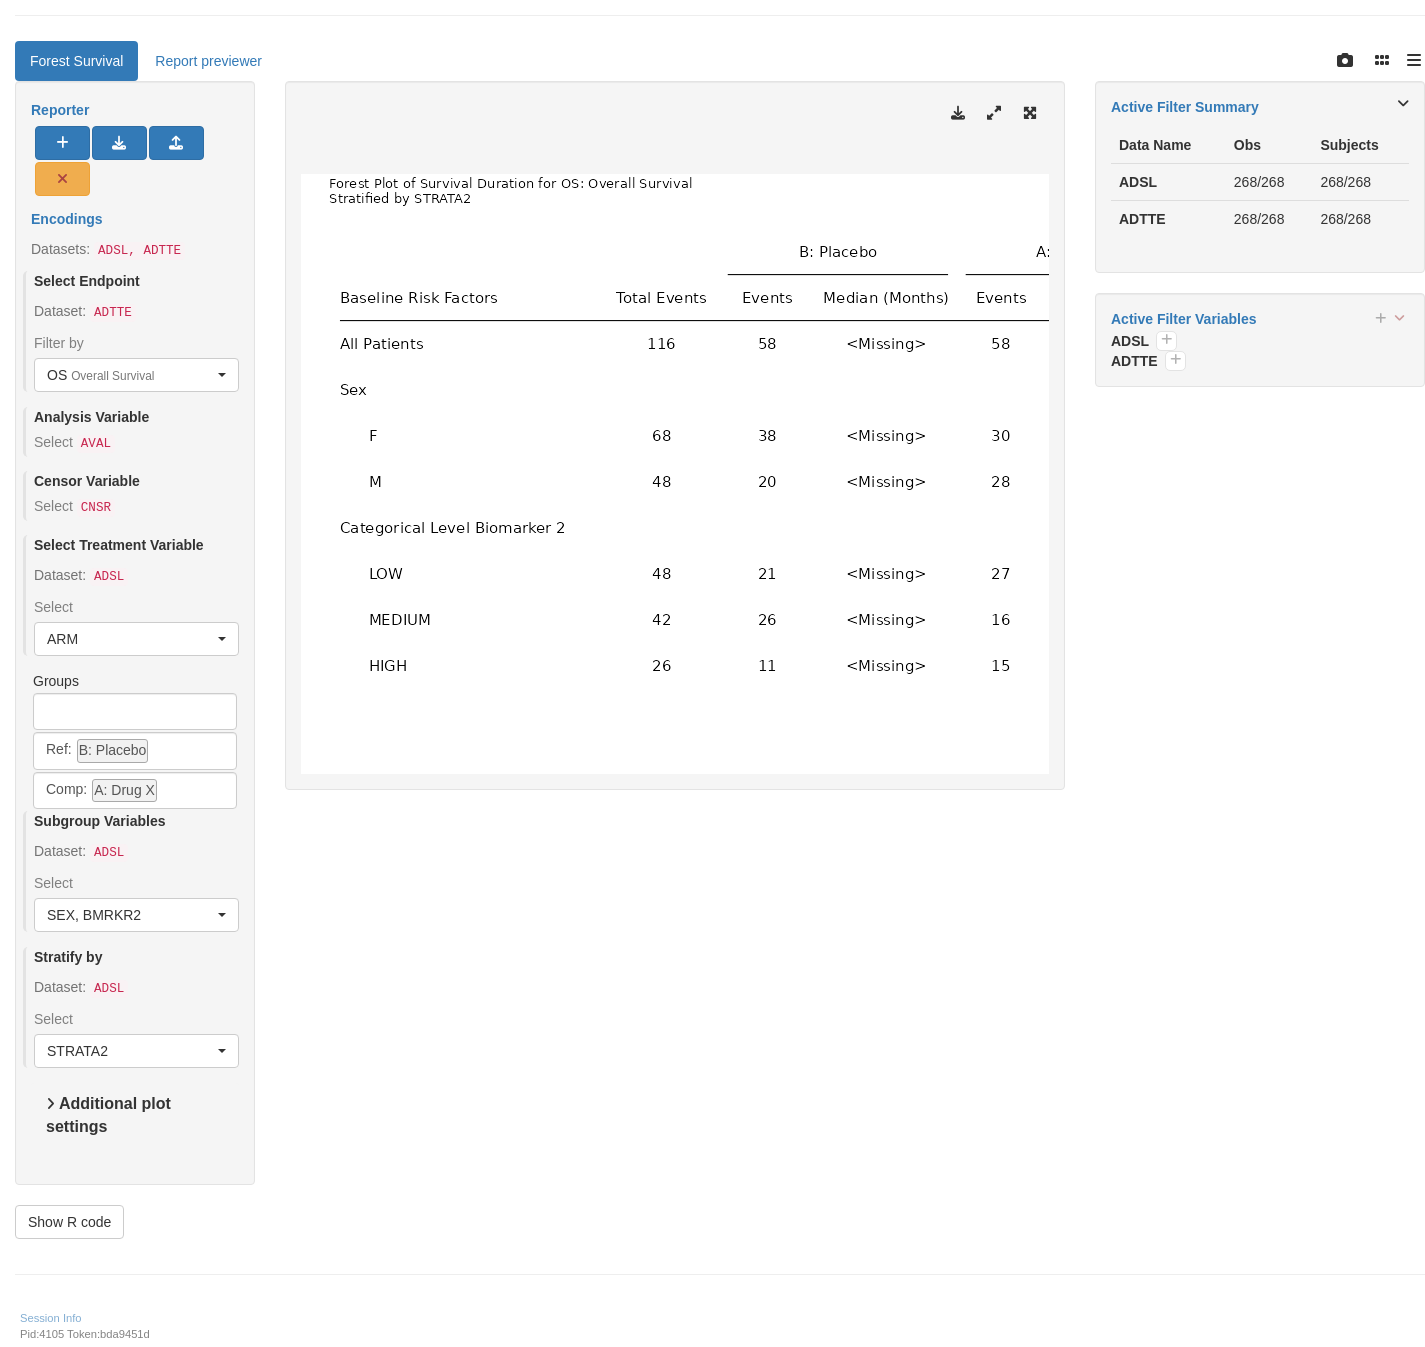
    tm_g_forest_tte(
      label = "Forest Survival",
      dataname = "ADTTE",
      arm_var = choices_selected(c("ARM", "ARMCD"), "ARM"),
      subgroup_var = choices_selected(names(ADSL), c("SEX", "BMRKR2")),
      paramcd = choices_selected(value_choices(ADTTE, "PARAMCD", "PARAM"), "OS"),
      strata_var = choices_selected(c("STRATA1", "STRATA2"), "STRATA2"),
      plot_height = c(600, 200, 2000),
      plot_width = c(1500, 200, 5000)
    )
  )
)

shinyApp(app$ui, app$server)
```
{{< include ../../_utils/shinylive.qmd >}}
:::
{{< include ../../repro.qmd >}}

