---
title: ONCT05
subtitle: Objective Response Rate by Subgroup
---
------------------------------------------------------------------------
{{< include ../../_utils/envir_hook.qmd >}}
```{r setup, echo = FALSE, warning = FALSE, message = FALSE}
library(tern)
library(dplyr)
adsl <- random.cdisc.data::cadsl
adrs <- random.cdisc.data::cadrs
# Ensure character variables are converted to factors and empty strings and NAs are explicit missing levels.
adsl <- df_explicit_na(adsl)
adrs <- df_explicit_na(adrs)
adsl <- adsl %>%
select(STUDYID, USUBJID, ARM, SEX, RACE, STRATA1, STRATA2)
adrs <- adrs %>%
filter(PARAMCD == "INVET") %>%
select(STUDYID, USUBJID, PARAMCD, AVALC)
anl <- inner_join(adsl, adrs, by = c("STUDYID", "USUBJID"))
anl_labels <- var_labels(anl)
anl <- anl %>%
filter(ARM %in% c("A: Drug X", "B: Placebo")) %>%
mutate(
# Reorder levels of factor to make the placebo group the reference arm.
ARM = relevel(ARM, ref = "B: Placebo") %>%
droplevels()
) %>%
droplevels() %>%
mutate(rsp = AVALC %in% c("CR", "PR"))
var_labels(anl) <- c(anl_labels, rsp = "Is Response")
```
```{r include = FALSE}
webr_code_labels <- c("setup")
```
{{< include ../../_utils/webr_no_include.qmd >}}
## Output
::::::: panel-tabset
## Standard Table
::: {.panel-tabset .nav-justified group="webr"}
## {{< fa regular file-lines sm fw >}} Preview
```{r variant1, test = list(result_v1 = "result")}
df <- extract_rsp_subgroups(
  variables = list(
    rsp = "rsp",
    arm = "ARM",
    subgroups = c("SEX", "STRATA2")
  ),
  data = anl
)

result <- basic_table() %>%
  tabulate_rsp_subgroups(df, vars = c("n_tot", "n", "n_rsp", "prop", "or", "ci"))

result
```
```{r include = FALSE}
webr_code_labels <- c("variant1")
```
{{< include ../../_utils/webr.qmd >}}
:::
## Table Specifying <br/> Class Variables
::: {.panel-tabset .nav-justified group="webr"}
## {{< fa regular file-lines sm fw >}} Preview
Here, the levels of subgroup variables `SEX` and `STRATA1` are reordered. `STRATA1` is reordered by frequency.
```{r variant2, test = list(result_v2 = "result")}
anl_reorder <- anl %>%
  mutate(
    SEX = forcats::fct_relevel(SEX, "M", "F"),
    STRATA1 = forcats::fct_infreq(STRATA1)
  )

df <- extract_rsp_subgroups(
  variables = list(rsp = "rsp", arm = "ARM", subgroups = c("SEX", "STRATA1")),
  data = anl_reorder
)

result <- basic_table() %>%
  tabulate_rsp_subgroups(df, vars = c("n_tot", "n", "n_rsp", "prop", "or", "ci"))

result
```
```{r include = FALSE}
webr_code_labels <- c("variant2")
```
{{< include ../../_utils/webr.qmd >}}
:::
## Table Selecting Columns <br/> and Changing the Alpha Level
::: {.panel-tabset .nav-justified group="webr"}
## {{< fa regular file-lines sm fw >}} Preview
```{r variant3, test = list(result_v3 = "result")}
df <- extract_rsp_subgroups(
  variables = list(
    rsp = "rsp",
    arm = "ARM",
    subgroups = c("SEX", "STRATA2")
  ),
  data = anl,
  conf_level = 0.9,
  method = "chisq"
)

result <- basic_table() %>%
  tabulate_rsp_subgroups(df, vars = c("n_tot", "n", "n_rsp", "prop", "or", "ci", "pval"))

result
```
```{r include = FALSE}
webr_code_labels <- c("variant3")
```
{{< include ../../_utils/webr.qmd >}}
:::
## Table Setting Values <br/> Indicating Response
::: {.panel-tabset .nav-justified group="webr"}
## {{< fa regular file-lines sm fw >}} Preview
Create a new variable `new_rsp` in `anl` data that uses new criteria for responder.
```{r variant4, test = list(result_v4 = "result")}
anl_new <- anl %>%
  mutate(new_rsp = AVALC == "CR")

df <- extract_rsp_subgroups(
  variables = list(
    rsp = "new_rsp",
    arm = "ARM",
    subgroups = c("SEX", "STRATA2")
  ),
  data = anl_new
)

result <- basic_table() %>%
  tabulate_rsp_subgroups(df, vars = c("n_tot", "n", "n_rsp", "prop", "or", "ci"))

result
```
```{r include = FALSE}
webr_code_labels <- c("variant4")
```
{{< include ../../_utils/webr.qmd >}}
:::
## Data Setup
```{r setup}
#| code-fold: show
```
:::::::
{{< include ../../_utils/save_results.qmd >}}
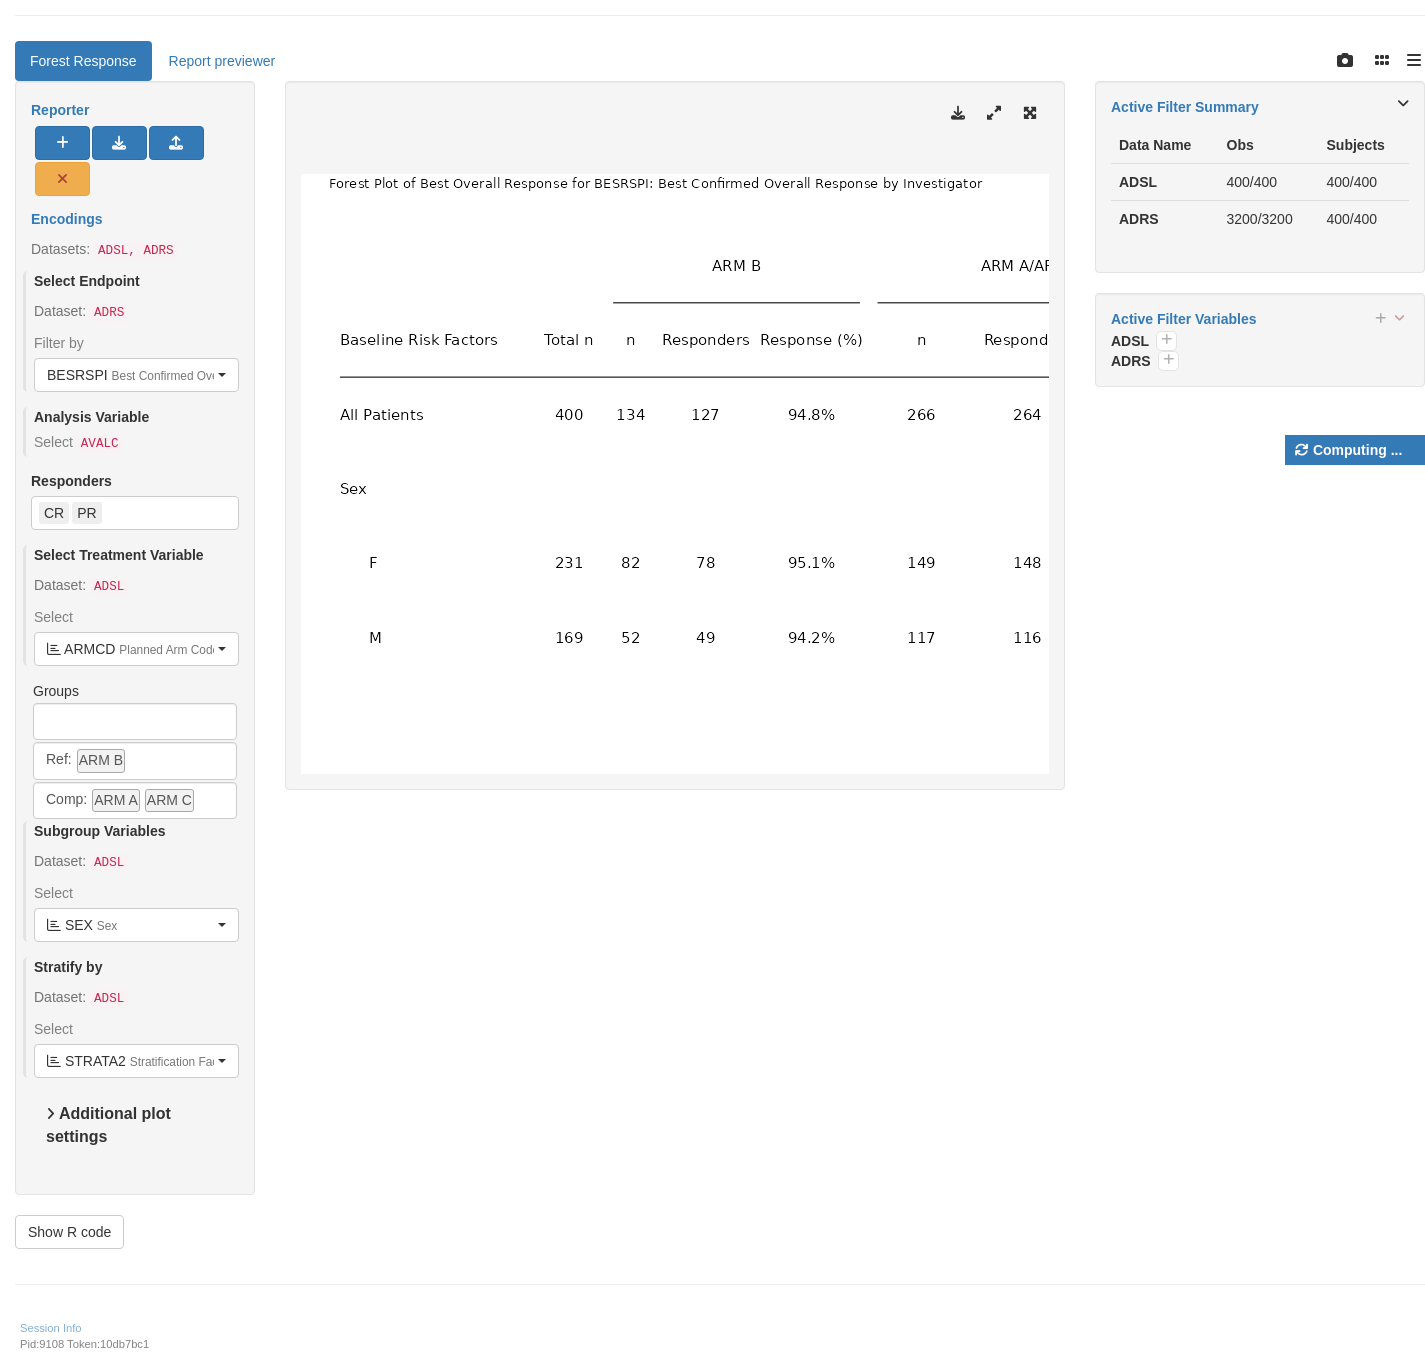
## `teal` App
::: {.panel-tabset .nav-justified}
## {{< fa regular file-lines fa-sm fa-fw >}} Preview
```{r teal, opts.label = c("skip_if_testing", "app")}
# Use table, embedded in response forest plot module.
library(teal.modules.clinical)

## Data reproducible code
data <- teal_data()
data <- within(data, {
  ADSL <- random.cdisc.data::cadsl
  ADRS <- random.cdisc.data::cadrs

  # Ensure character variables are converted to factors and empty strings and NAs are explicit missing levels.
  ADSL <- df_explicit_na(ADSL)
  ADRS <- df_explicit_na(ADRS)
})
join_keys(data) <- default_cdisc_join_keys[c("ADSL", "ADRS")]

## Reusable Configuration For Modules
ADSL <- data[["ADSL"]]
ADRS <- data[["ADRS"]]
arm_ref_comp <- list(
  ARM = list(
    ref = "B: Placebo",
    comp = c("A: Drug X", "C: Combination")
  ),
  ARMCD = list(
    ref = "ARM B",
    comp = c("ARM A", "ARM C")
  )
)

## Setup App
app <- init(
  data = data,
  modules = modules(
    tm_g_forest_rsp(
      label = "Forest Response",
      dataname = "ADRS",
      arm_var = choices_selected(
        variable_choices(ADSL, c("ARM", "ARMCD")),
        "ARMCD"
      ),
      arm_ref_comp = arm_ref_comp,
      paramcd = choices_selected(
        value_choices(ADRS, "PARAMCD", "PARAM"),
        "BESRSPI"
      ),
      subgroup_var = choices_selected(
        variable_choices(ADSL, names(ADSL)),
        c("SEX")
      ),
      strata_var = choices_selected(
        variable_choices(ADSL, c("STRATA1", "STRATA2")),
        "STRATA2"
      ),
      plot_height = c(600L, 200L, 2000L)
    )
  )
)

shinyApp(app$ui, app$server)
```
{{< include ../../_utils/shinylive.qmd >}}
:::
{{< include ../../repro.qmd >}}

