---
title: LBT03
subtitle: Laboratory Test Results Change from Baseline by Visit
---
------------------------------------------------------------------------
{{< include ../../_utils/envir_hook.qmd >}}
```{r setup, echo = FALSE, warning = FALSE, message = FALSE}
library(dplyr)
library(tern)
adsl <- random.cdisc.data::cadsl
adlb <- random.cdisc.data::cadlb
# Ensure character variables are converted to factors and empty strings and NAs are explicit missing levels.
adsl <- df_explicit_na(adsl)
adlb <- df_explicit_na(adlb)
saved_labels <- var_labels(adlb)
adlb_f <- adlb %>%
filter(
PARAM == "C-Reactive Protein Measurement",
!(ARM == "B: Placebo" & AVISIT == "WEEK 1 DAY 8"),
AVISIT != "SCREENING"
) %>%
dplyr::mutate(
AVISIT = droplevels(AVISIT),
ABLFLL = ABLFL == "Y"
)
var_labels(adlb_f) <- c(saved_labels, "")
```
```{r include = FALSE}
webr_code_labels <- c("setup")
```
{{< include ../../_utils/webr_no_include.qmd >}}
## Output
::::: panel-tabset
## Standard Table
The `LBT03` template is the result of a junction between the analysis of `AVAL` at baseline and `CHG` at visit time. `AVAL` is summarized for baseline visits and and `CHG` is summarized for post-baseline visits.
::: {.panel-tabset .nav-justified group="webr"}
## {{< fa regular file-lines sm fw >}} Preview
```{r variant1, test = list(result_v1 = "result")}
# Define the split function
split_fun <- drop_split_levels

lyt <- basic_table(show_colcounts = TRUE) %>%
  split_cols_by("ARM") %>%
  split_rows_by("AVISIT", split_fun = split_fun, label_pos = "topleft", split_label = obj_label(adlb_f$AVISIT)) %>%
  summarize_change(
    "CHG",
    variables = list(value = "AVAL", baseline_flag = "ABLFLL"),
    na.rm = TRUE
  )

result <- build_table(
  lyt = lyt,
  df = adlb_f,
  alt_counts_df = adsl
)

result
```
```{r include = FALSE}
webr_code_labels <- c("variant1")
```
{{< include ../../_utils/webr.qmd >}}
:::
In the final step, a new variable is derived from `AVISIT` that can specify the method of estimation of the evaluated change.
::: {.panel-tabset .nav-justified group="webr"}
## {{< fa regular file-lines sm fw >}} Preview
```{r variant2, test = list(result_v2 = "result")}
adlb_f <- adlb_f %>% mutate(AVISIT_header = recode(AVISIT,
  "BASELINE" = "BASELINE",
  "WEEK 1 DAY 8" = "WEEK 1 DAY 8 value minus baseline",
  "WEEK 2 DAY 15" = "WEEK 2 DAY 15 value minus baseline",
  "WEEK 3 DAY 22" = "WEEK 3 DAY 22 value minus baseline",
  "WEEK 4 DAY 29" = "WEEK 4 DAY 29 value minus baseline",
  "WEEK 5 DAY 36" = "WEEK 5 DAY 36 value minus baseline"
))

# Define the split function
split_fun <- drop_split_levels

lyt <- basic_table(show_colcounts = TRUE) %>%
  split_cols_by("ARM") %>%
  split_rows_by("AVISIT_header",
    split_fun = split_fun,
    label_pos = "topleft",
    split_label = obj_label(adlb_f$AVISIT)
  ) %>%
  summarize_change(
    "CHG",
    variables = list(value = "AVAL", baseline_flag = "ABLFLL"),
    na.rm = TRUE
  )

result <- build_table(
  lyt = lyt,
  df = adlb_f,
  alt_counts_df = adsl
)

result
```
```{r include = FALSE}
webr_code_labels <- c("variant2")
```
{{< include ../../_utils/webr.qmd >}}
:::
## Data Setup
For illustration purposes, this example focuses on "C-Reactive Protein Measurement" starting from baseline, while excluding visit at week 1 for subjects who were randomized to the placebo group.
```{r setup}
#| code-fold: show
```
:::::
{{< include ../../_utils/save_results.qmd >}}
## `teal` App
::: {.panel-tabset .nav-justified}
## {{< fa regular file-lines fa-sm fa-fw >}} Preview
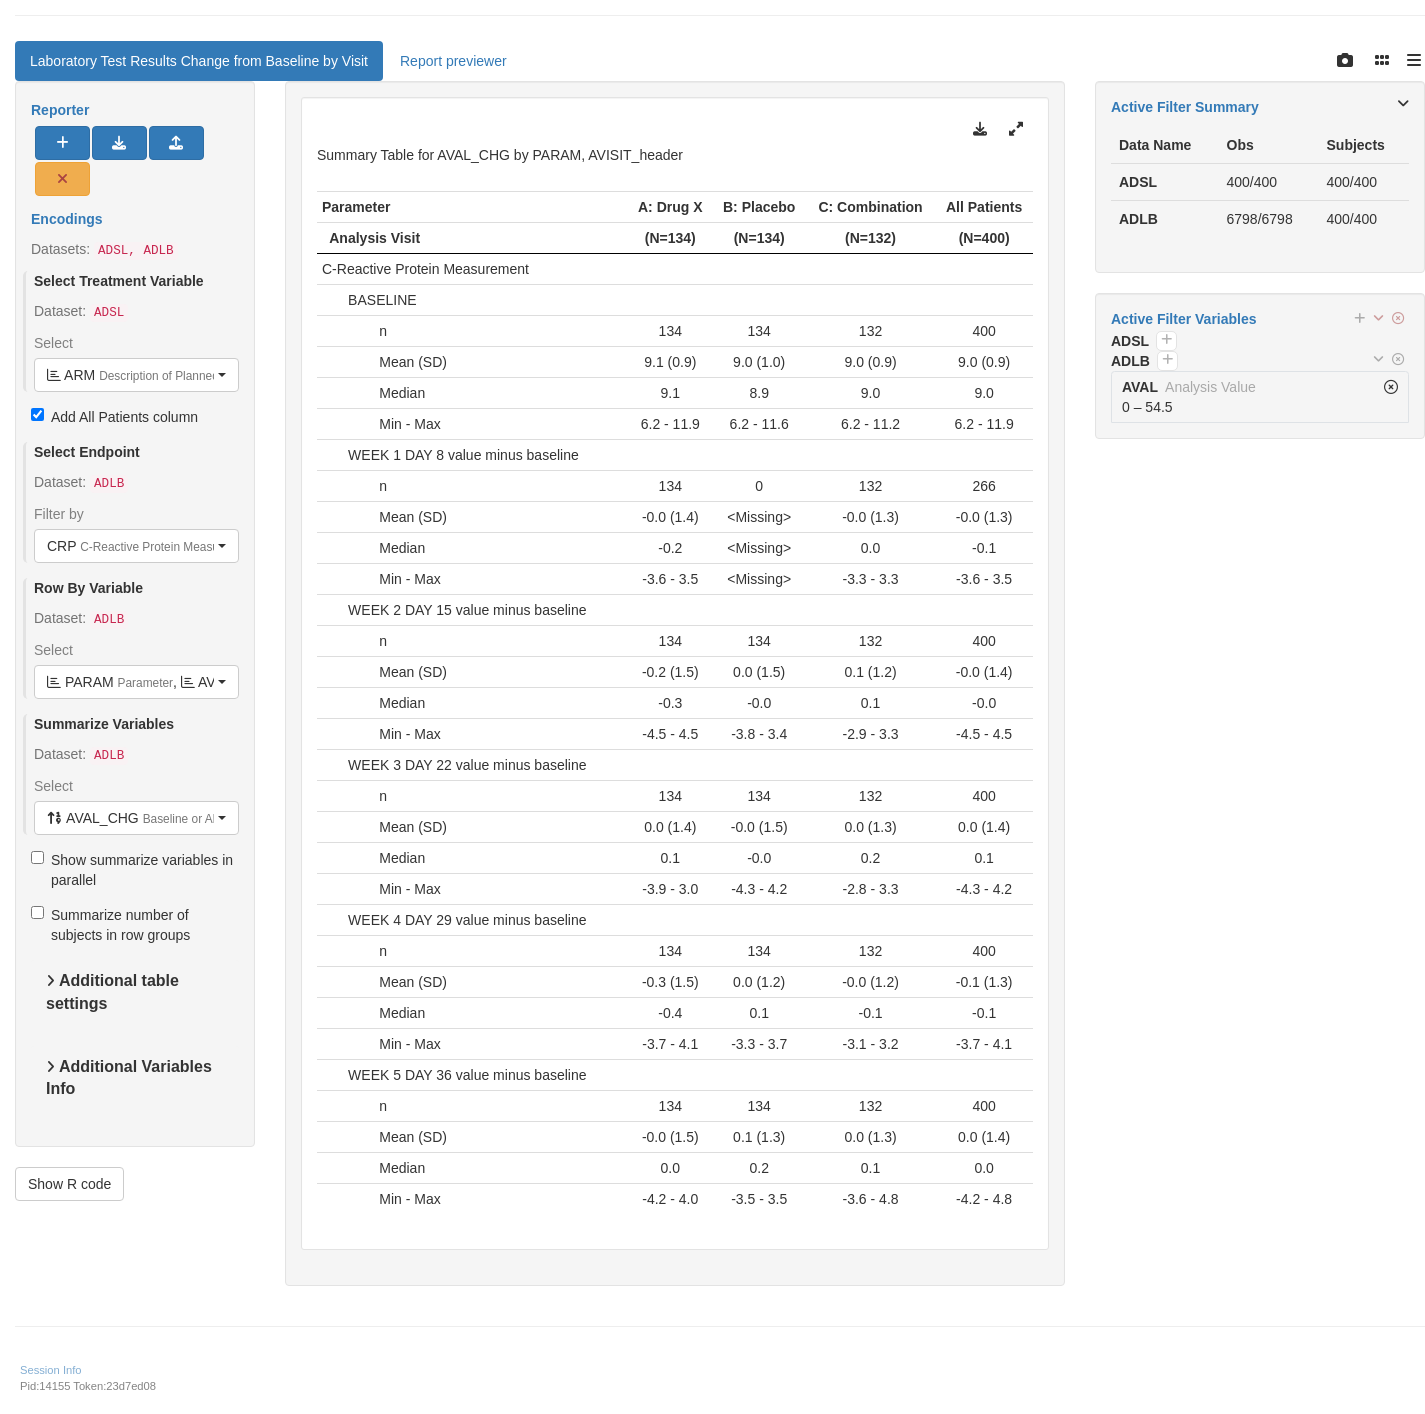
Here, we pre-process and manually define the variable "Baseline or Absolute Change from Baseline".
```{r teal, opts.label = c("skip_if_testing", "app")}
library(teal.modules.clinical)

## Data reproducible code
data <- teal_data()
data <- within(data, {
  ADSL <- df_explicit_na(random.cdisc.data::cadsl)
  ADLB <- df_explicit_na(random.cdisc.data::cadlb) %>%
    filter(
      !(ARM == "B: Placebo" & AVISIT == "WEEK 1 DAY 8"),
      AVISIT != "SCREENING"
    ) %>%
    mutate(
      AVISIT = droplevels(AVISIT),
      ABLFLL = ABLFL == "Y",
      AVISIT_header = recode(AVISIT,
        "BASELINE" = "BASELINE",
        "WEEK 1 DAY 8" = "WEEK 1 DAY 8 value minus baseline",
        "WEEK 2 DAY 15" = "WEEK 2 DAY 15 value minus baseline",
        "WEEK 3 DAY 22" = "WEEK 3 DAY 22 value minus baseline",
        "WEEK 4 DAY 29" = "WEEK 4 DAY 29 value minus baseline",
        "WEEK 5 DAY 36" = "WEEK 5 DAY 36 value minus baseline"
      )
    ) %>%
    group_by(USUBJID, PARAM) %>%
    mutate(
      AVAL_CHG = AVAL - (!ABLFLL) * sum(AVAL * ABLFLL)
    ) %>%
    ungroup() %>%
    col_relabel(
      AVAL_CHG = "Baseline or Absolute Change from Baseline",
      ABLFLL = "Baseline Flag (TRUE/FALSE)",
      AVISIT_header = "Analysis Visit"
    )
})
join_keys(data) <- default_cdisc_join_keys[c("ADSL", "ADLB")]

## Reusable Configuration For Modules
ADSL <- data[["ADSL"]]
ADLB <- data[["ADLB"]]

## Setup App
app <- init(
  data = data,
  modules = modules(
    tm_t_summary_by(
      label = "Laboratory Test Results Change from Baseline by Visit",
      dataname = "ADLB",
      arm_var = choices_selected(
        choices = variable_choices(ADSL, c("ARM", "ARMCD")),
        selected = "ARM"
      ),
      by_vars = choices_selected(
        # note: order matters here. If `PARAM` is first, the split will be first by `PARAM`and then by `AVISIT`
        choices = variable_choices(ADLB, c("PARAM", "AVISIT_header")),
        selected = c("PARAM", "AVISIT_header")
      ),
      summarize_vars = choices_selected(
        choices = variable_choices(ADLB, c("AVAL", "CHG", "AVAL_CHG")),
        selected = c("AVAL_CHG")
      ),
      useNA = "ifany",
      paramcd = choices_selected(
        choices = value_choices(ADLB, "PARAMCD", "PARAM"),
        selected = "CRP"
      )
    )
  ),
  filter = teal_slices(teal_slice("ADLB", "AVAL", selected = NULL))
)
shinyApp(app$ui, app$server)
```
{{< include ../../_utils/shinylive.qmd >}}
:::
{{< include ../../repro.qmd >}}

