RNAG8
RNAseq Scatterplot
This page can be used as a template of how to use the available hermes functions to produce a scatterplot of two genes or gene signatures and to create an interactive scatterplot for RNA-seq gene expression analysis using teal.modules.hermes.
The draw_scatterplot() function used below needs HermesData as input. See RNAG1 for details on how to import, filter and normalize HermesData.
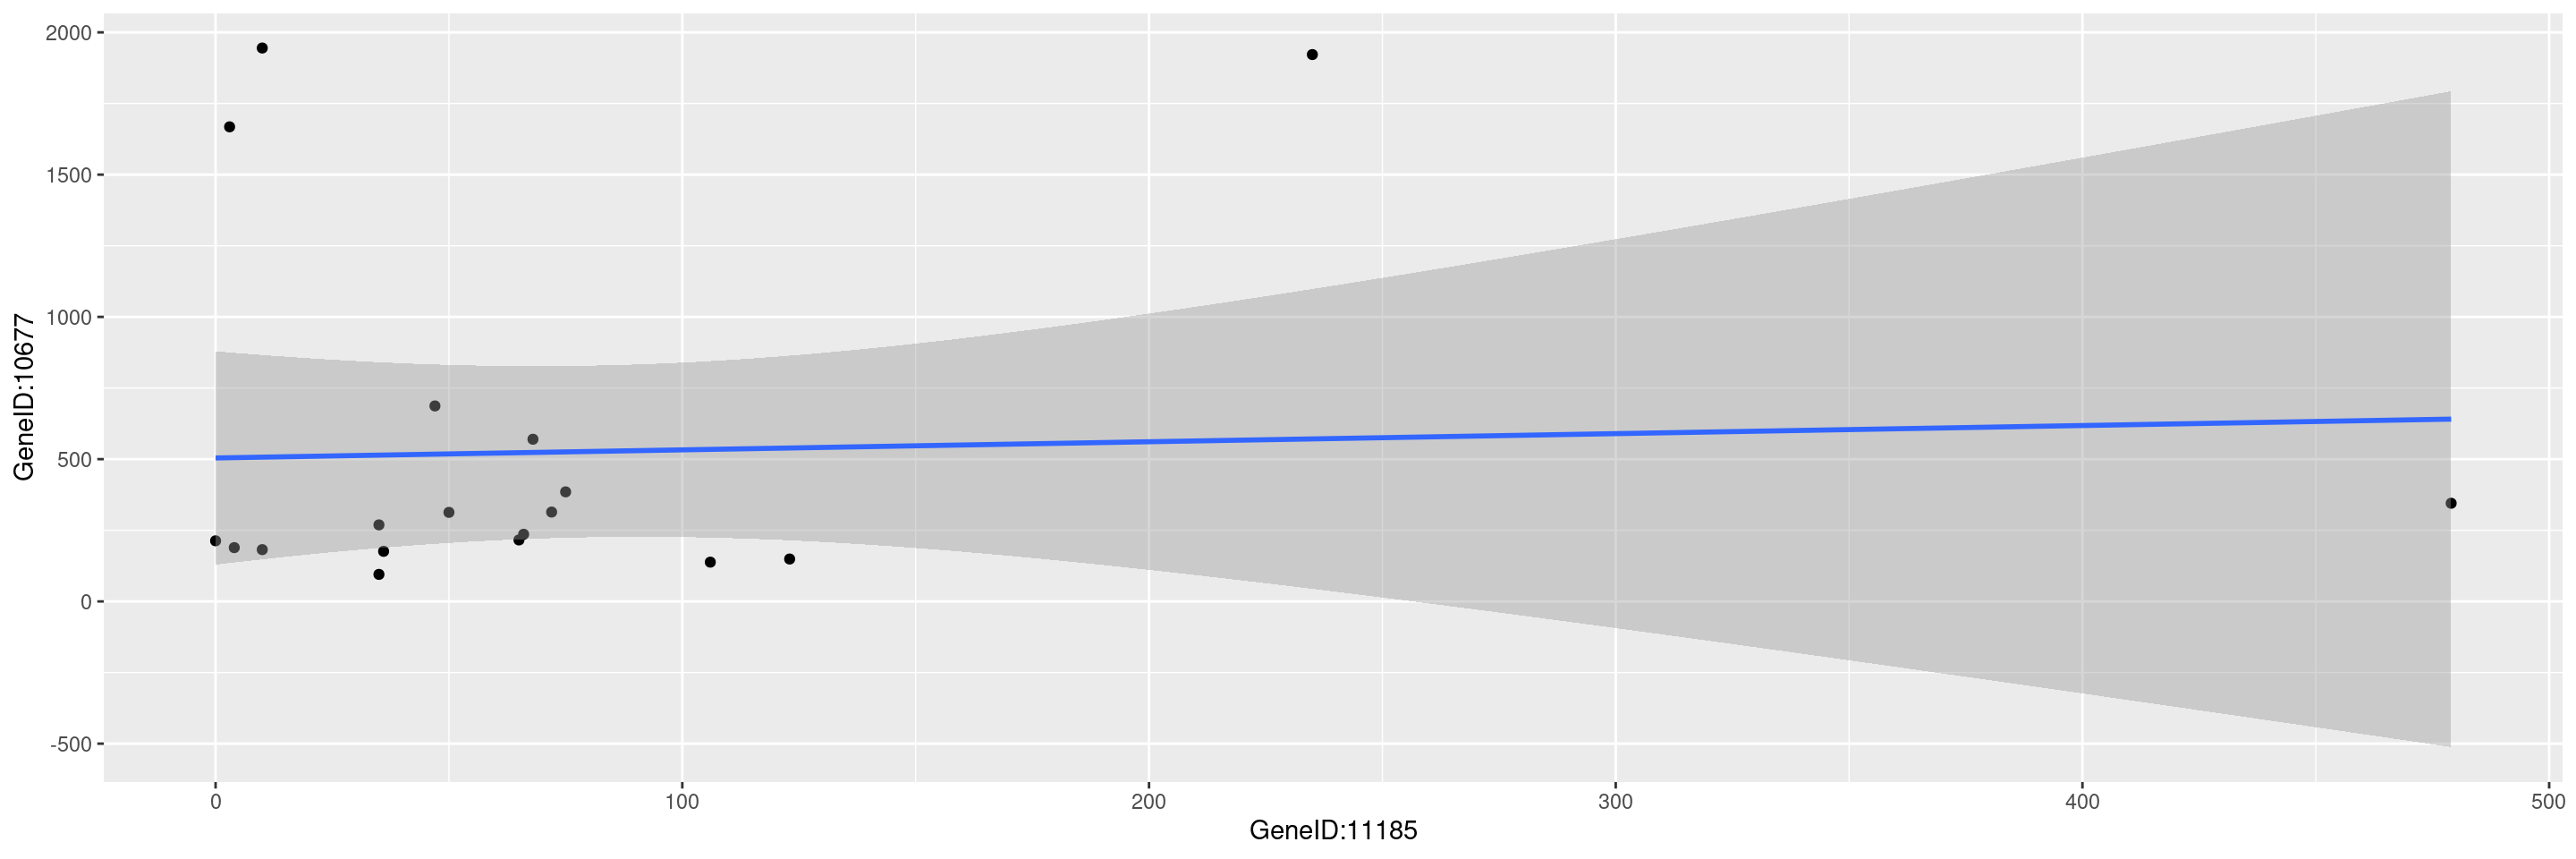
We can create scatterplots for gene expression values by providing a gene in the gene_spec (gene specification) as follows.
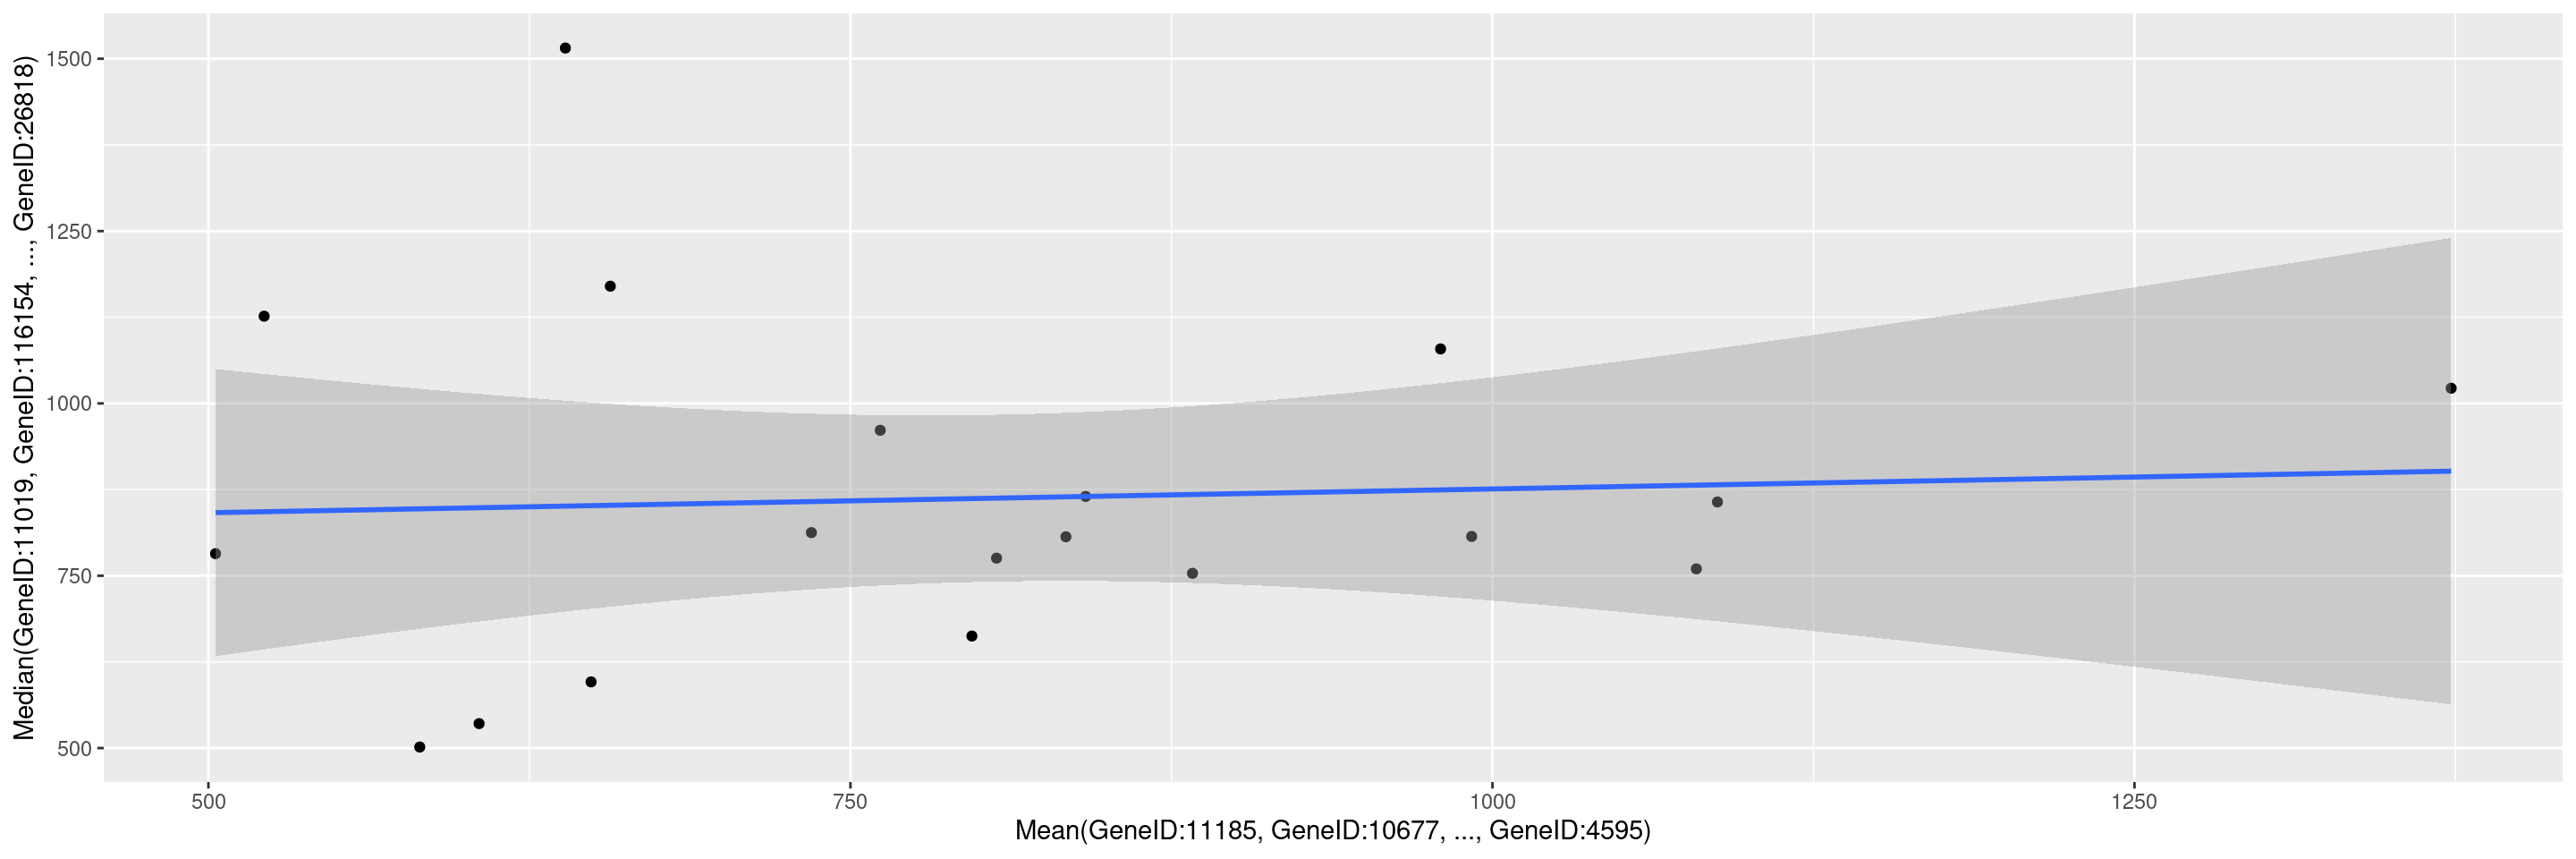
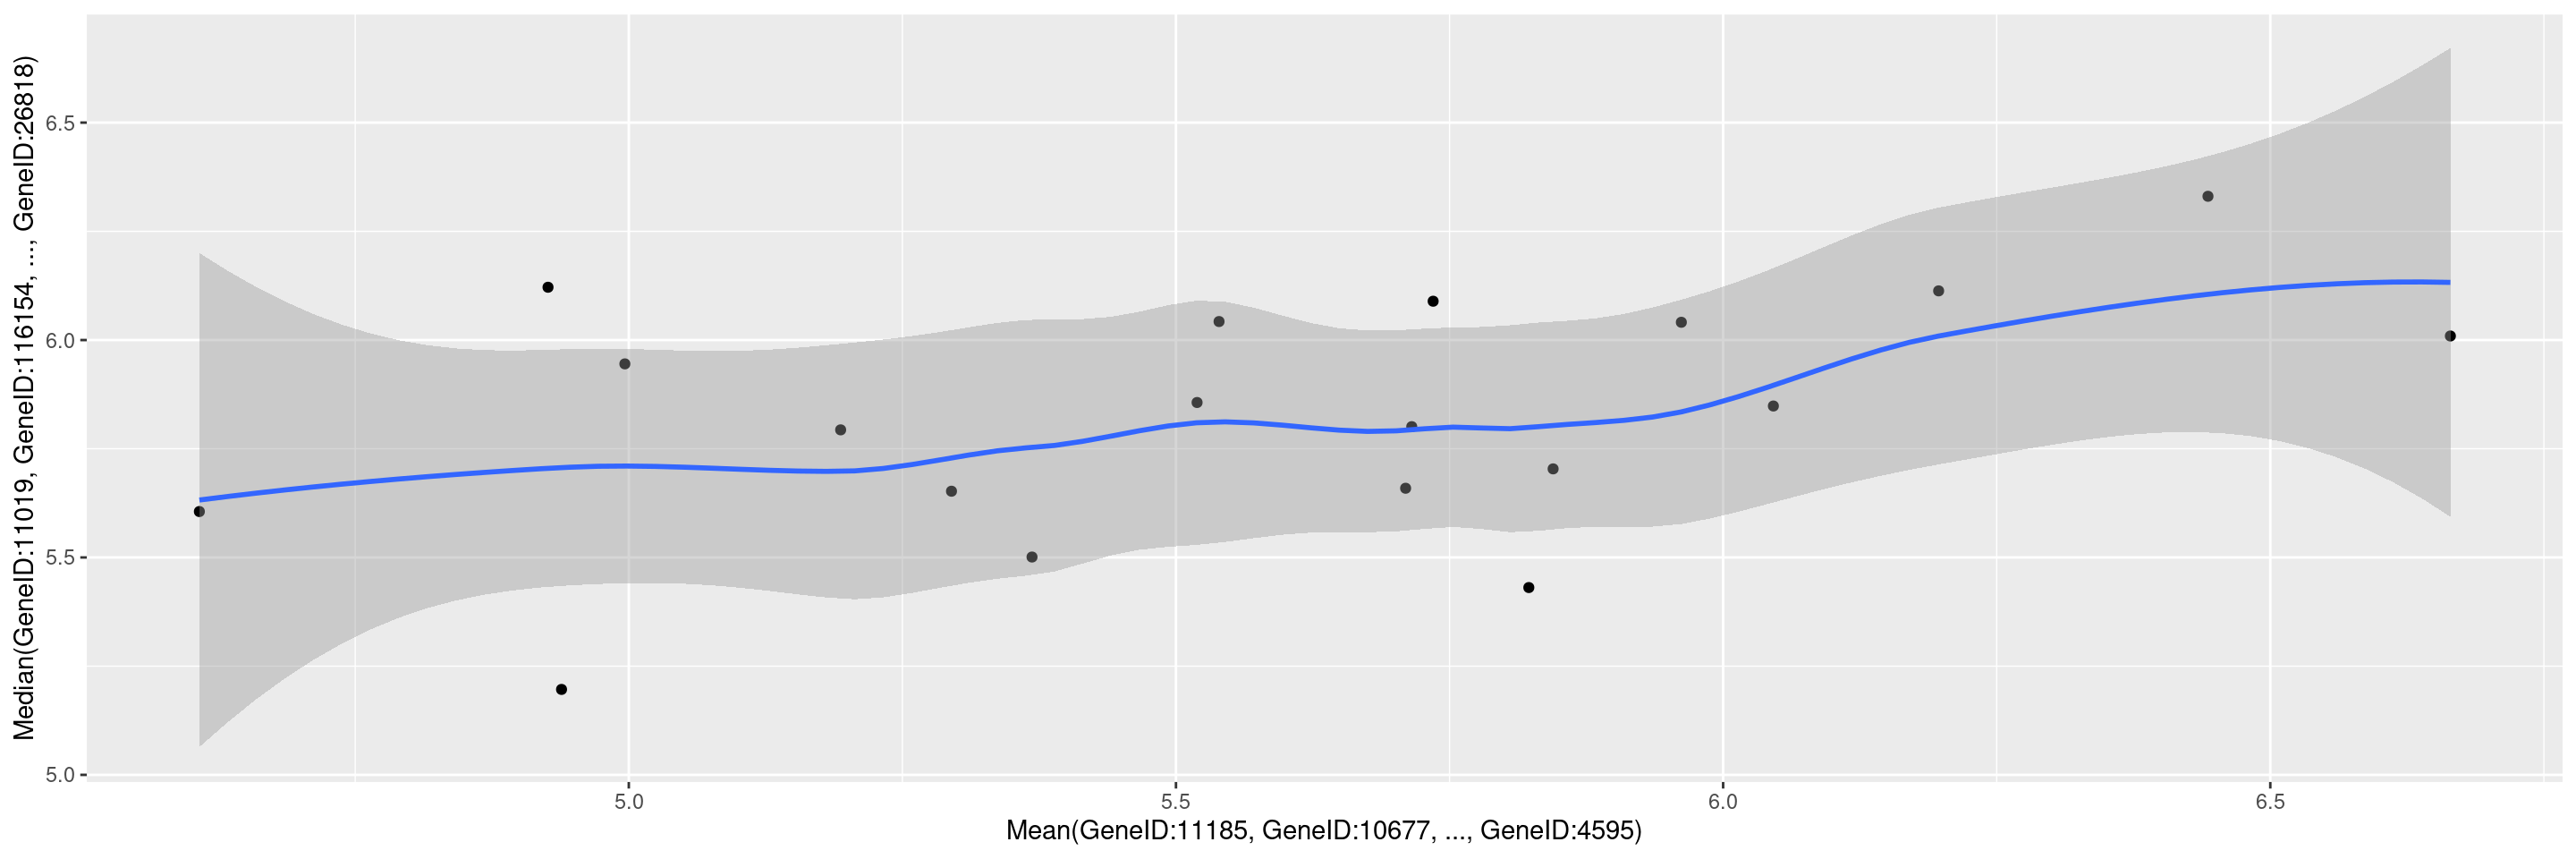
We can also specify a gene summary function for multiple genes, thereby using the corresponding gene signature. Note that we use the first 10 genes and the next 10 genes from the object without explicitly specifying the gene IDs, and this can be done through the genes() function in hermes.
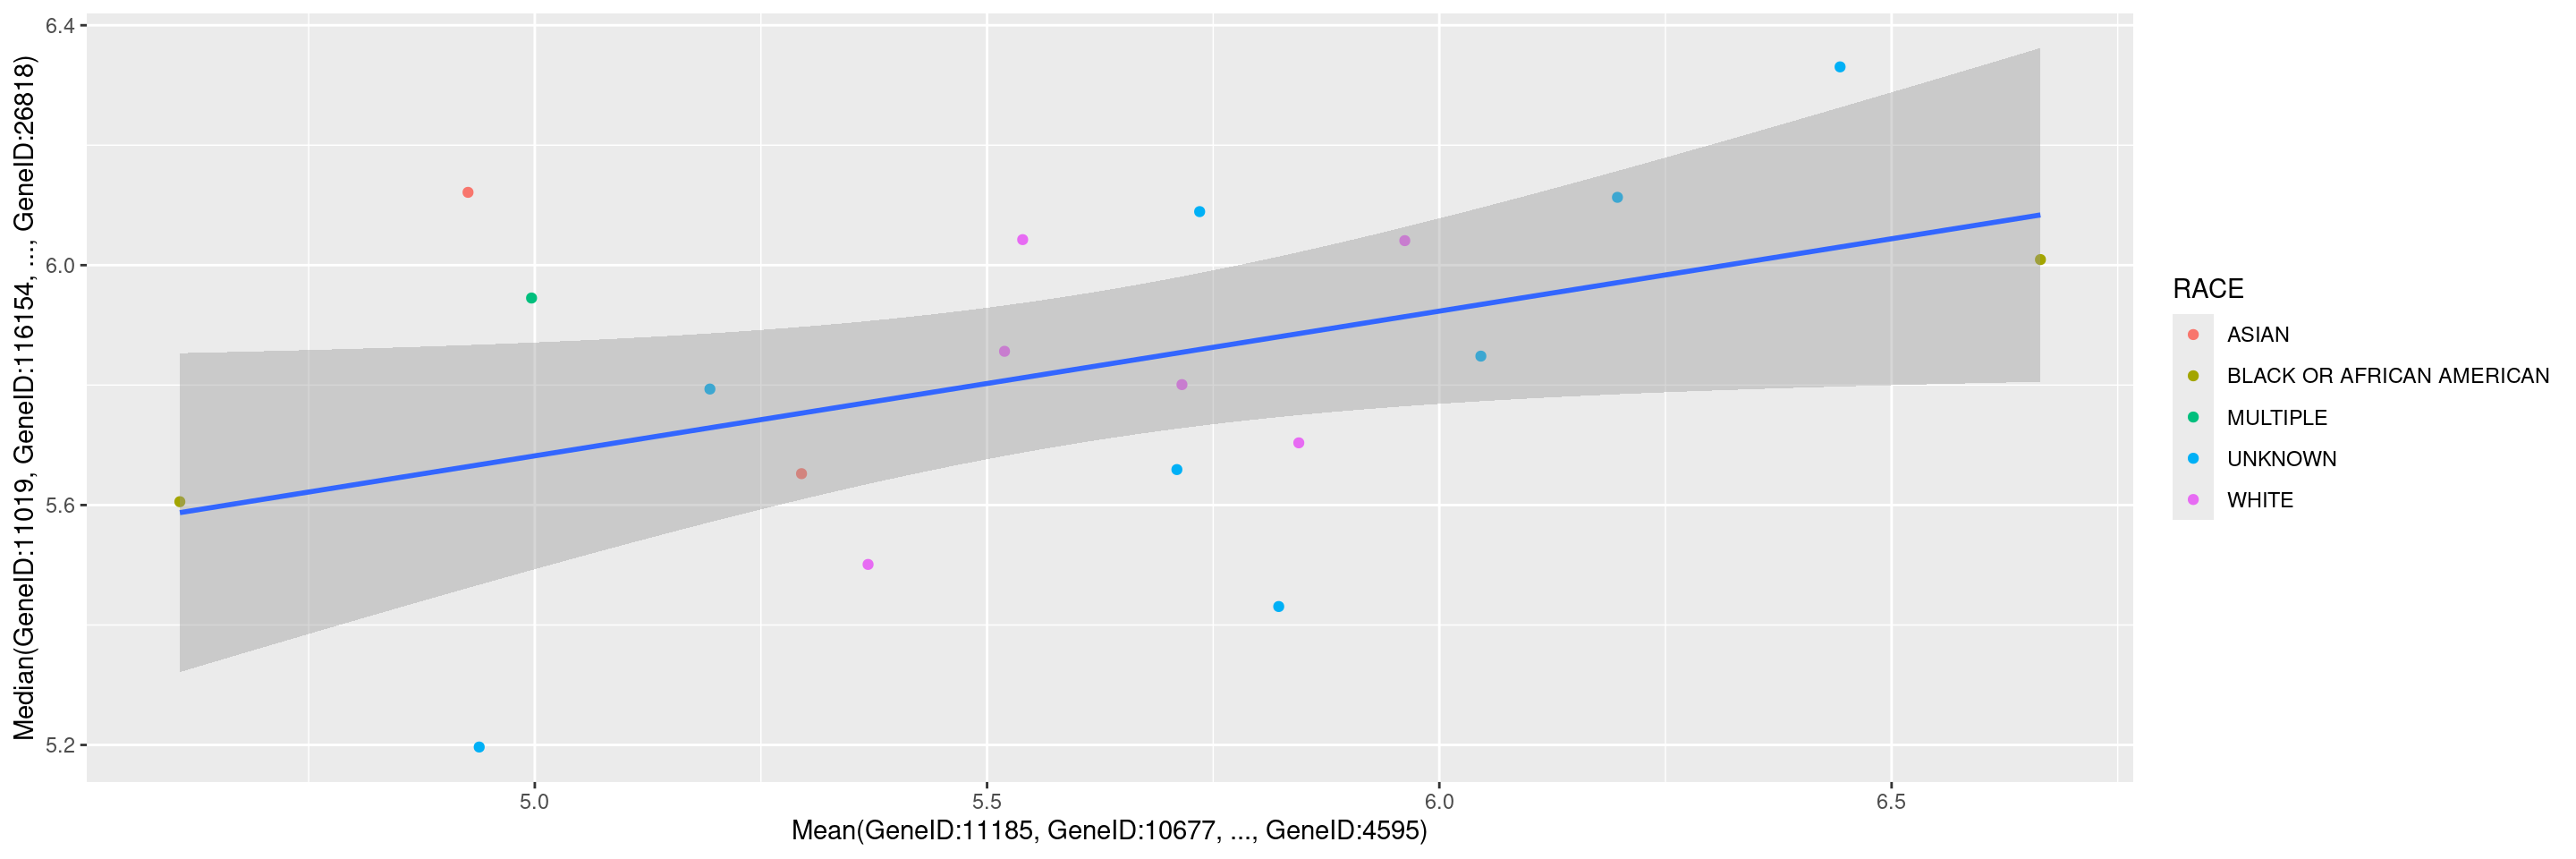
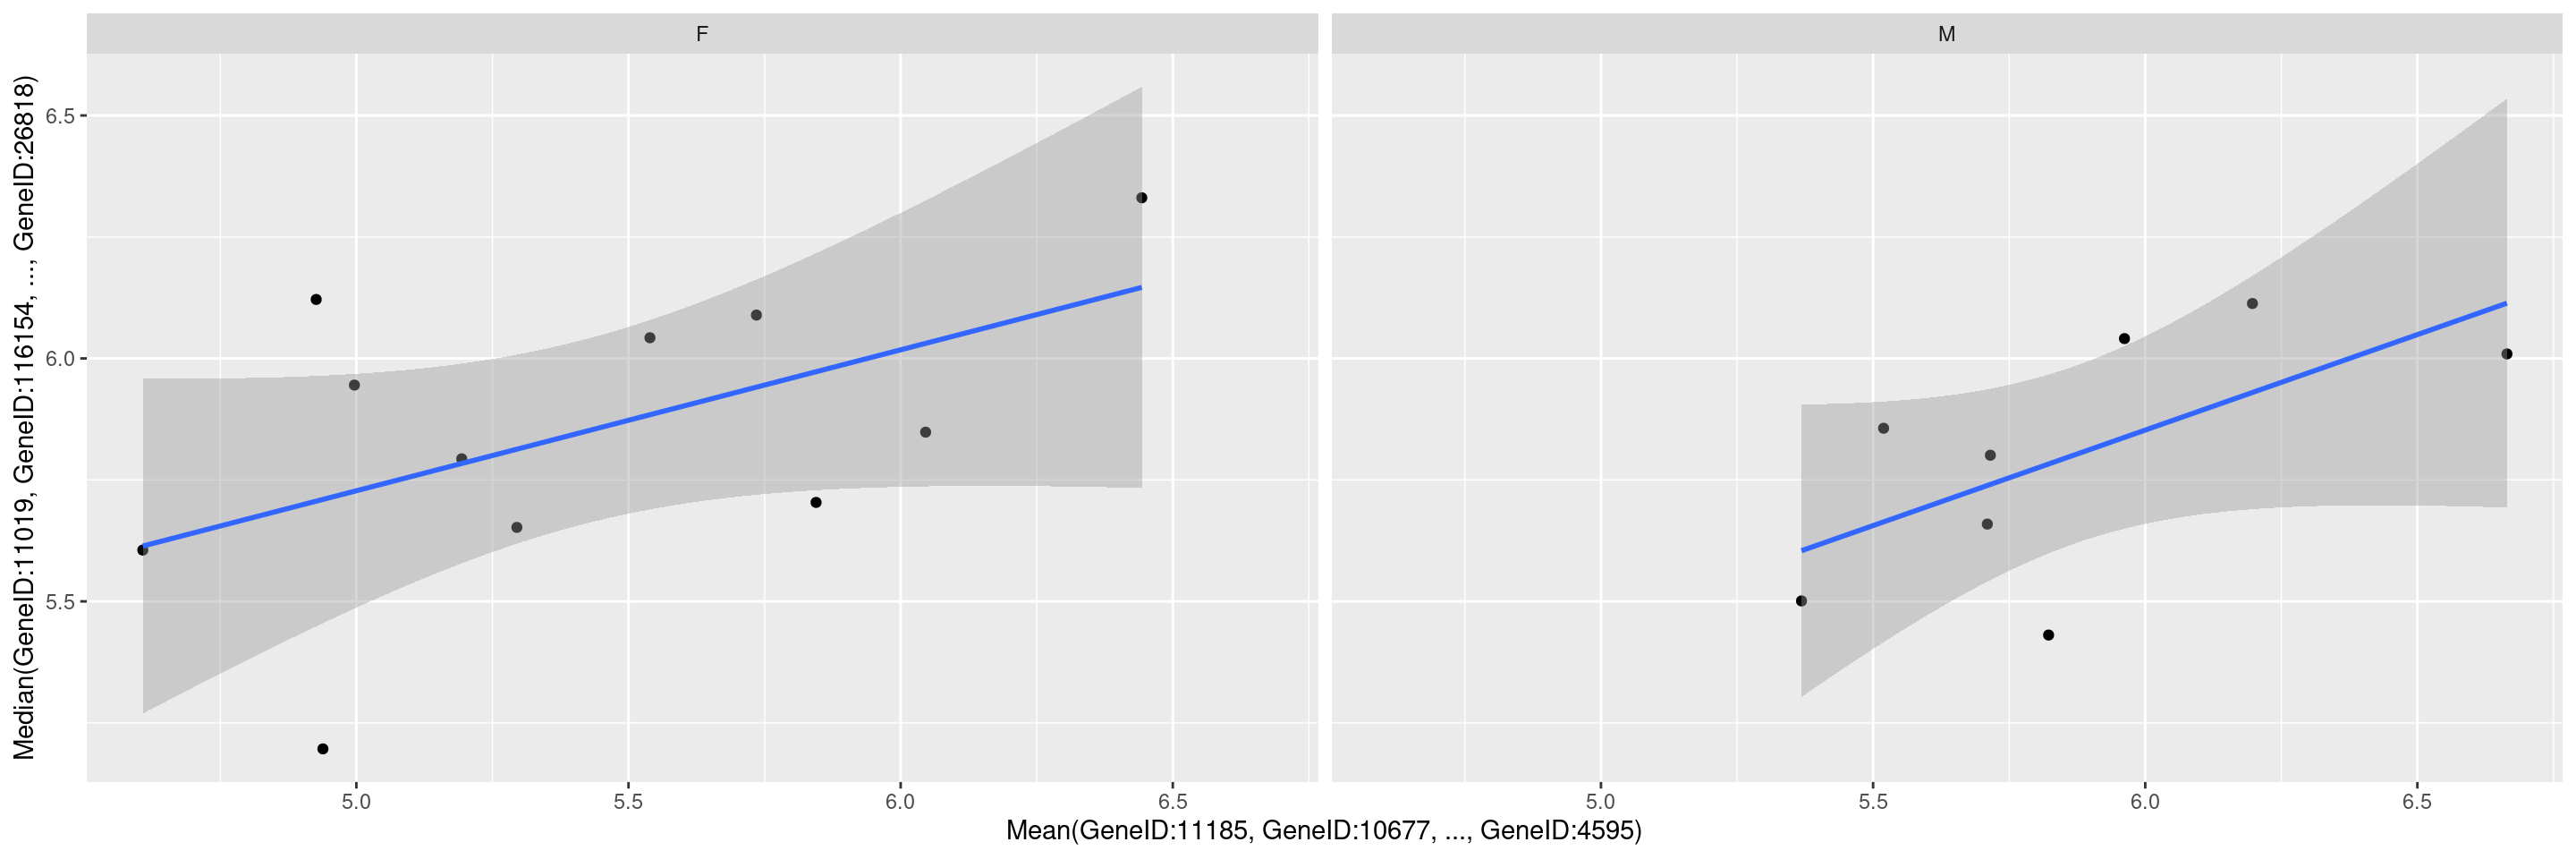
It is also possible to pass additional arguments to the function draw_scatterplot(), e.g. if we wish to specify an optional faceting variable, optional color variable or specific smoothing method. See ?hermes::draw_scatterplot() for details about the additional parameters available.
Code
Code
We start by importing a MultiAssayExperiment; here we use the example multi_assay_experiment available in hermes. It is wrapped as a teal::dataset. We can then use the provided teal module tm_g_scatterplot to have add a scatterplot module in our teal app.
Code
Warning: 'experiments' dropped; see 'drops()'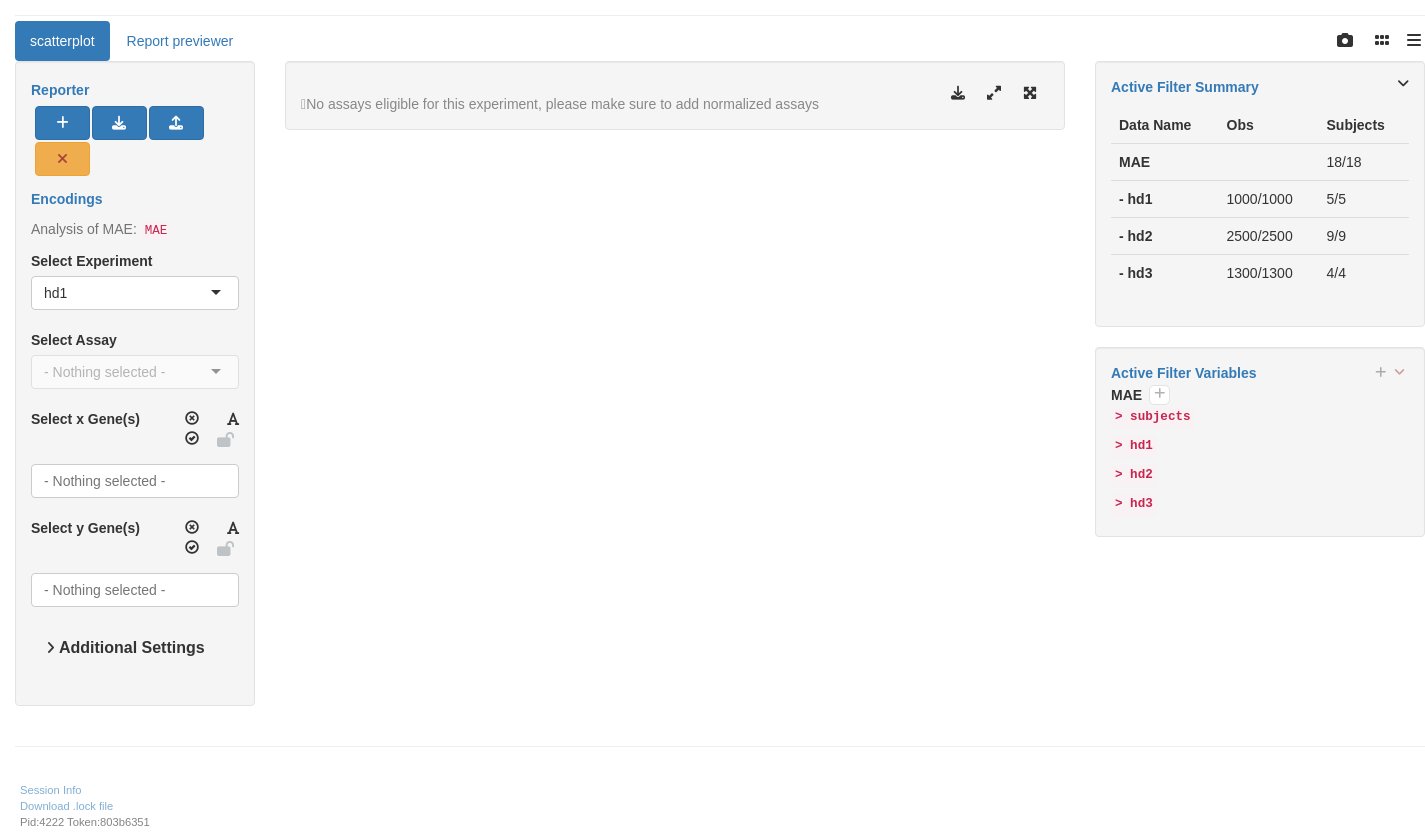
R version 4.4.1 (2024-06-14)
Platform: x86_64-pc-linux-gnu
Running under: Ubuntu 22.04.4 LTS

Matrix products: default
BLAS:   /usr/lib/x86_64-linux-gnu/openblas-pthread/libblas.so.3
LAPACK: /usr/lib/x86_64-linux-gnu/openblas-pthread/libopenblasp-r0.3.20.so;  LAPACK version 3.10.0

locale:
 [1] LC_CTYPE=en_US.UTF-8       LC_NUMERIC=C
 [3] LC_TIME=en_US.UTF-8        LC_COLLATE=en_US.UTF-8
 [5] LC_MONETARY=en_US.UTF-8    LC_MESSAGES=en_US.UTF-8
 [7] LC_PAPER=en_US.UTF-8       LC_NAME=C
 [9] LC_ADDRESS=C               LC_TELEPHONE=C
[11] LC_MEASUREMENT=en_US.UTF-8 LC_IDENTIFICATION=C

time zone: Etc/UTC
tzcode source: system (glibc)

attached base packages:
[1] stats4    stats     graphics  grDevices utils     datasets  methods
[8] base

other attached packages:
 [1] teal.modules.hermes_0.1.6.9020 teal_0.15.2.9061
 [3] teal.slice_0.5.1.9011          teal.data_0.6.0.9010
 [5] teal.code_0.5.0.9009           shiny_1.9.1
 [7] hermes_1.7.2.9002              SummarizedExperiment_1.34.0
 [9] Biobase_2.64.0                 GenomicRanges_1.56.1
[11] GenomeInfoDb_1.40.1            IRanges_2.38.1
[13] S4Vectors_0.42.1               BiocGenerics_0.50.0
[15] MatrixGenerics_1.16.0          matrixStats_1.4.1
[17] ggfortify_0.4.17               ggplot2_3.5.1

loaded via a namespace (and not attached):
  [1] RColorBrewer_1.1-3          jsonlite_1.8.8
  [3] shape_1.4.6.1               MultiAssayExperiment_1.30.3
  [5] magrittr_2.0.3              farver_2.1.2
  [7] rmarkdown_2.28              GlobalOptions_0.1.2
  [9] zlibbioc_1.50.0             vctrs_0.6.5
 [11] memoise_2.0.1               webshot_0.5.5
 [13] BiocBaseUtils_1.7.3         htmltools_0.5.8.1
 [15] S4Arrays_1.4.1              forcats_1.0.0
 [17] progress_1.2.3              curl_5.2.2
 [19] SparseArray_1.4.8           sass_0.4.9
 [21] parallelly_1.38.0           bslib_0.8.0
 [23] fontawesome_0.5.2           htmlwidgets_1.6.4
 [25] testthat_3.2.1.1            httr2_1.0.3
 [27] cachem_1.1.0                teal.widgets_0.4.2.9020
 [29] mime_0.12                   lifecycle_1.0.4
 [31] iterators_1.0.14            pkgconfig_2.0.3
 [33] webshot2_0.1.1              Matrix_1.7-0
 [35] R6_2.5.1                    fastmap_1.2.0
 [37] future_1.34.0               GenomeInfoDbData_1.2.12
 [39] rbibutils_2.2.16            clue_0.3-65
 [41] digest_0.6.37               colorspace_2.1-1
 [43] shinycssloaders_1.1.0       ps_1.8.0
 [45] AnnotationDbi_1.66.0        DESeq2_1.44.0
 [47] RSQLite_2.3.7               filelock_1.0.3
 [49] labeling_0.4.3              fansi_1.0.6
 [51] httr_1.4.7                  abind_1.4-8
 [53] mgcv_1.9-1                  compiler_4.4.1
 [55] bit64_4.0.5                 withr_3.0.1
 [57] doParallel_1.0.17           backports_1.5.0
 [59] BiocParallel_1.38.0         DBI_1.2.3
 [61] logger_0.3.0                biomaRt_2.60.1
 [63] rappdirs_0.3.3              DelayedArray_0.30.1
 [65] rjson_0.2.22                chromote_0.3.1
 [67] tools_4.4.1                 httpuv_1.6.15
 [69] glue_1.7.0                  callr_3.7.6
 [71] nlme_3.1-166                promises_1.3.0
 [73] grid_4.4.1                  checkmate_2.3.2
 [75] cluster_2.1.6               generics_0.1.3
 [77] gtable_0.3.5                websocket_1.4.2
 [79] tidyr_1.3.1                 hms_1.1.3
 [81] xml2_1.3.6                  utf8_1.2.4
 [83] XVector_0.44.0              ggrepel_0.9.6
 [85] foreach_1.5.2               pillar_1.9.0
 [87] stringr_1.5.1               limma_3.60.4
 [89] later_1.3.2                 circlize_0.4.16
 [91] splines_4.4.1               dplyr_1.1.4
 [93] BiocFileCache_2.12.0        lattice_0.22-6
 [95] bit_4.0.5                   tidyselect_1.2.1
 [97] ComplexHeatmap_2.20.0       locfit_1.5-9.10
 [99] Biostrings_2.72.1           knitr_1.48
[101] gridExtra_2.3               teal.logger_0.2.0.9009
[103] edgeR_4.2.1                 xfun_0.47
[105] statmod_1.5.0               brio_1.1.5
[107] stringi_1.8.4               UCSC.utils_1.0.0
[109] yaml_2.3.10                 shinyWidgets_0.8.6
[111] evaluate_0.24.0             codetools_0.2-20
[113] tibble_3.2.1                cli_3.6.3
[115] xtable_1.8-4                Rdpack_2.6.1
[117] jquerylib_0.1.4             processx_3.8.4
[119] munsell_0.5.1               teal.reporter_0.3.1.9015
[121] Rcpp_1.0.13                 globals_0.16.3
[123] dbplyr_2.5.0                png_0.1-8
[125] parallel_4.4.1              assertthat_0.2.1
[127] blob_1.2.4                  prettyunits_1.2.0
[129] listenv_0.9.1               scales_1.3.0
[131] purrr_1.0.2                 crayon_1.5.3
[133] GetoptLong_1.0.5            rlang_1.1.4
[135] formatR_1.14                KEGGREST_1.44.1
[137] shinyjs_2.1.0