RNAG2
RNAseq Top Genes Plot
This page can be used as a template of how to use the available hermes functions to derive and plot top genes for RNA-seq RNA-seq gene expression data and to create an interactive top genes plot using teal.modules.hermes.
Derivation of top genes uses HermesData as input. See RNAG1 for details on how to import, filter and normalize HermesData.
We can derive top most expressed genes in HermesData using the top_genes() function. By default, this function uses the counts assay and summary statistic function rowMeans() with no minimum threshold to derive the 10 most expressed genes. You can change this number, or instead work with a minimum threshold on the derived statistic.
If we want to derive only the 5 most expressed genes, we can specify this via n_top.
Alternatively, we can also set a minimum threshold of average counts (across samples).
If we want to derive top genes for a specific assay, we can also specify this via assay_name. By default, top_genes() function uses the counts assay. It is important to ensure that the same normalization method is applied on the HermesData object prior to deriving top genes, otherwise the assay would not be available here.
You can also change which summary statistic function is used. Most important here is that this function needs to work on the matrix (genes in rows, samples in columns) and return back a value for each gene, thus summarizing the values from all samples for this gene. Thus all row-wise statistic functions (like rowMeans() from package stats, rowMaxs(), rowSds(), … from package matrixStats) are well suited.
Here, the statistic chosen is the maximum count across samples:
We can then create a simple bar plot for these top genes using autoplot() function.
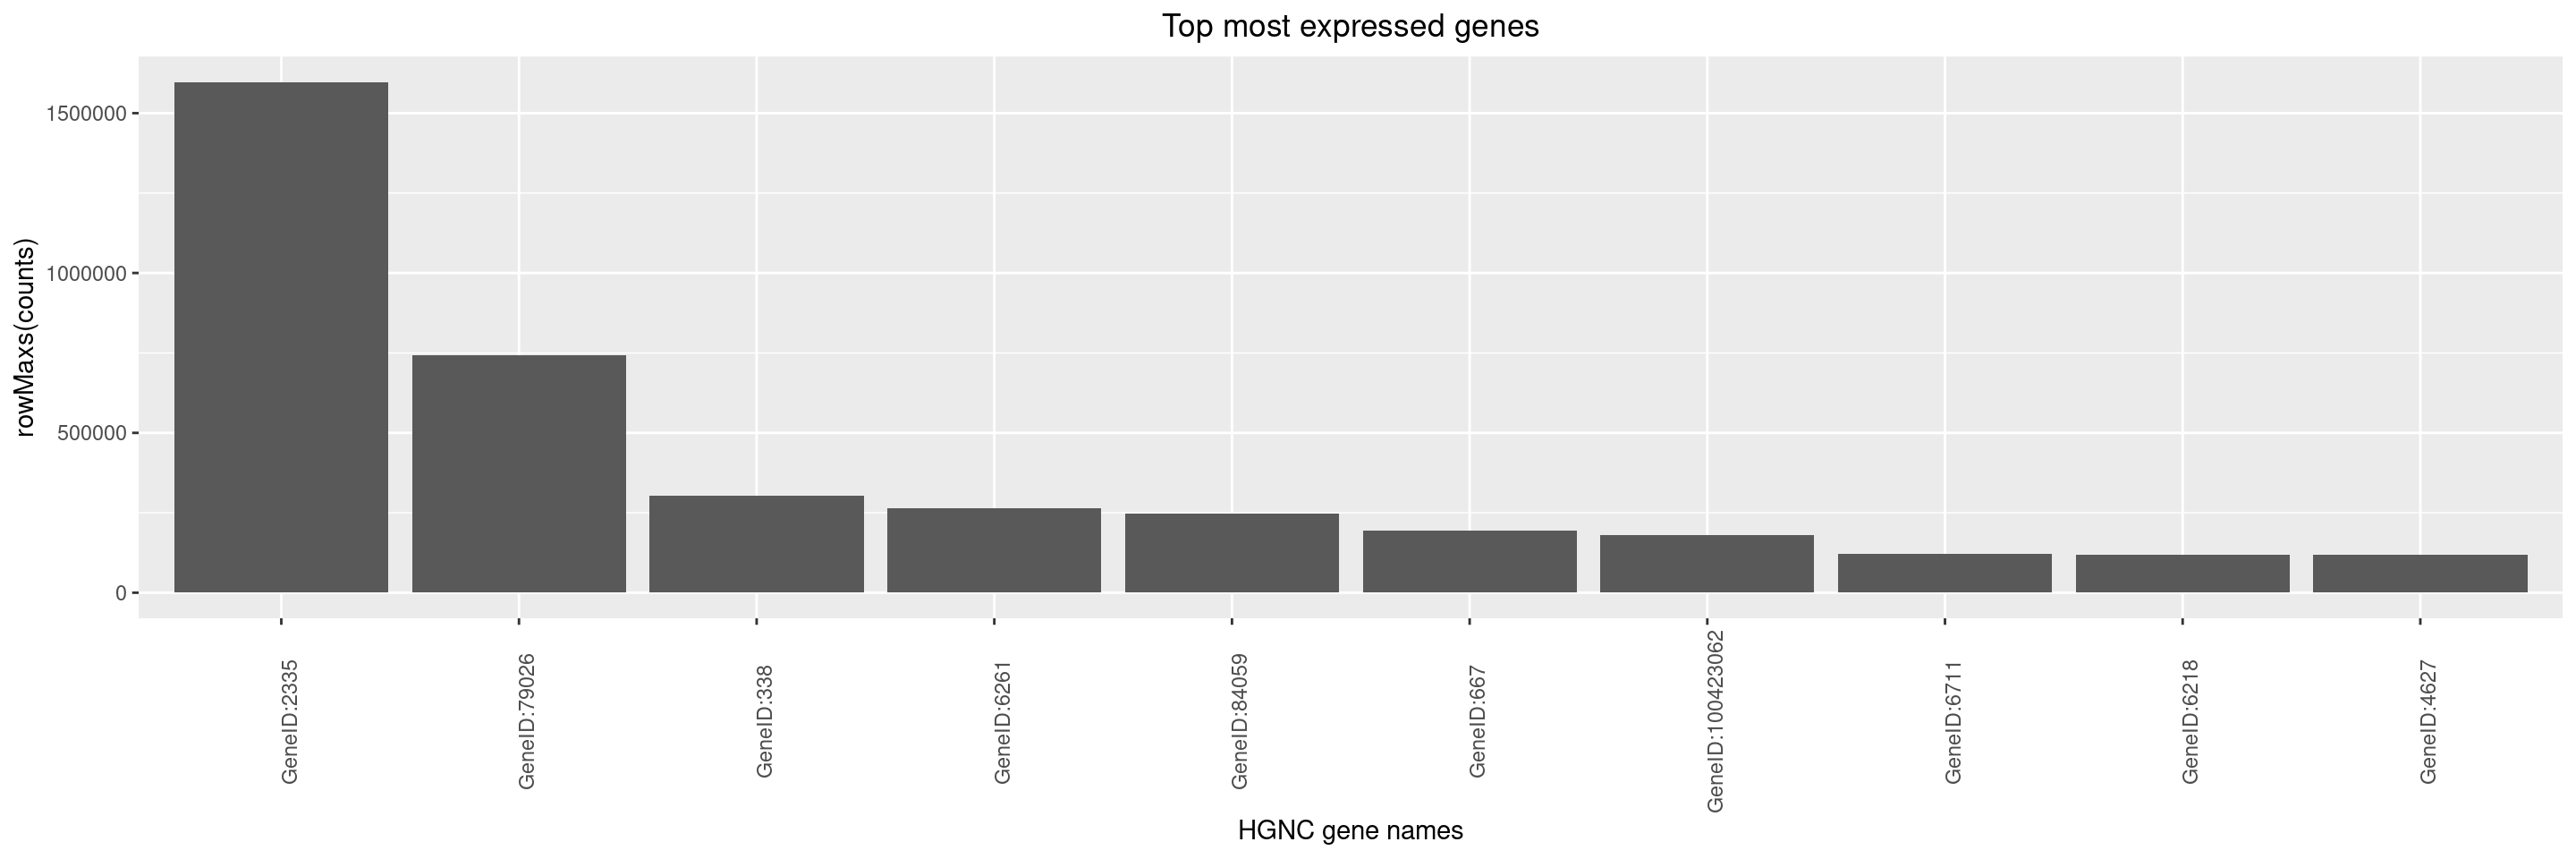
By default, y-axis label is set to summary function name and assay name used to generate the object with top genes using top_genes() function. It is up to the user to optionally adjust the y-axis label via the y_lab argument, and also the x-axis label and title can be adjusted.

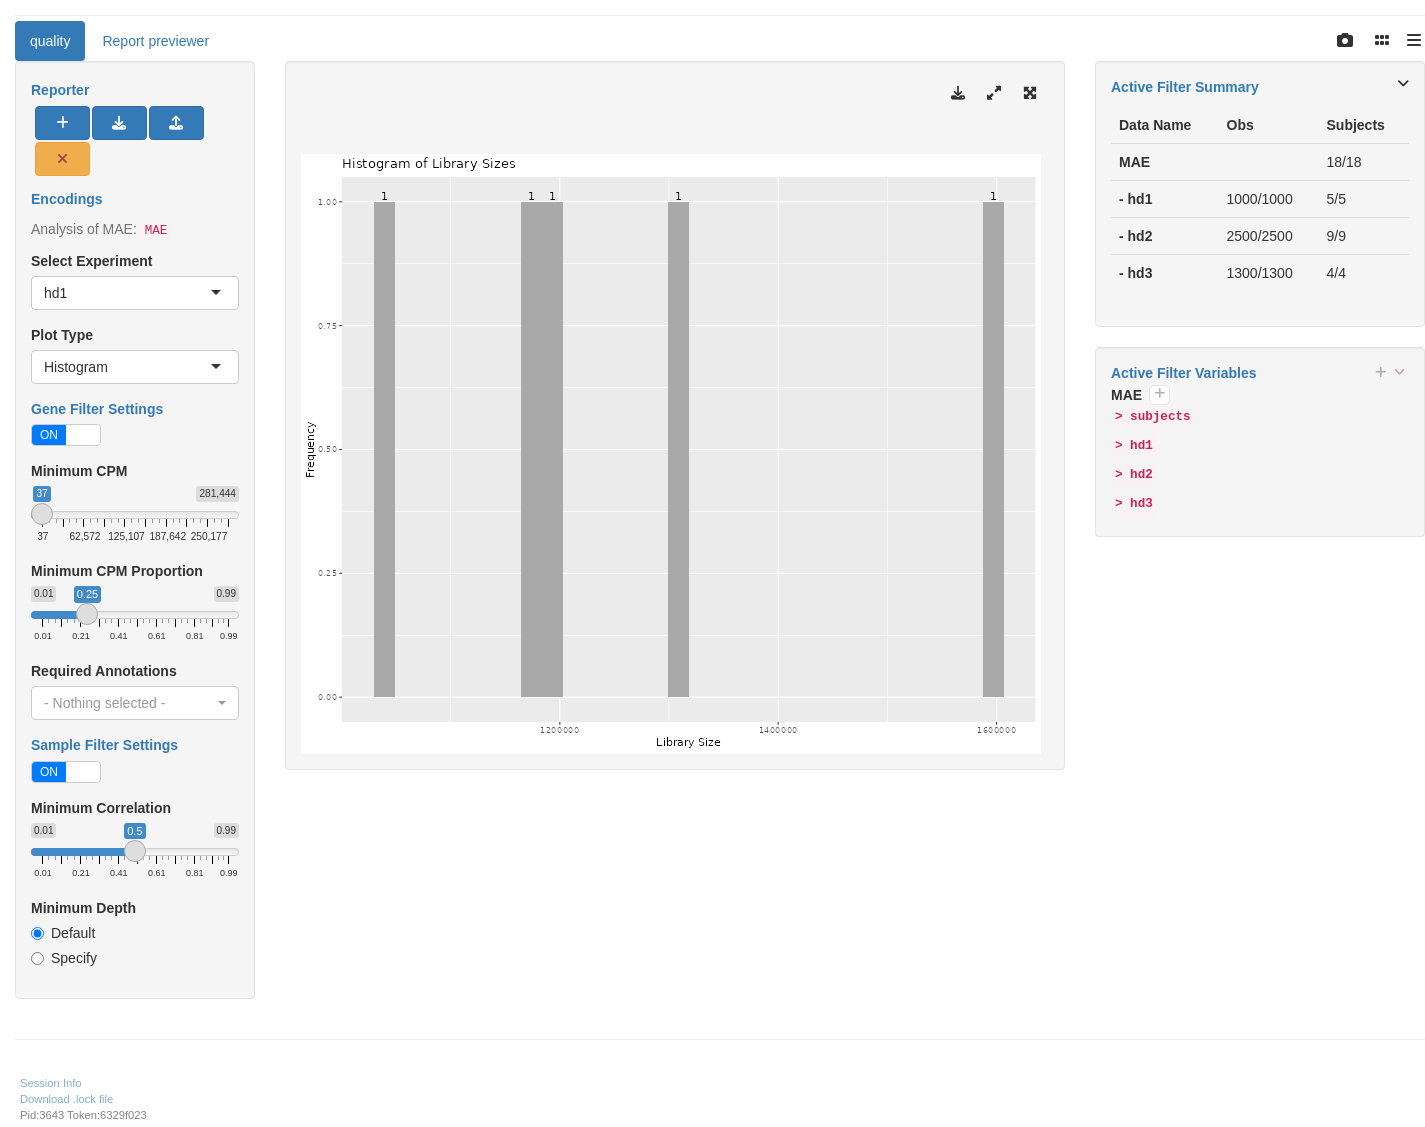
We start by importing a MultiAssayExperiment; here we use the example multi_assay_experiment available in hermes. It is wrapped as a teal::dataset. We can select the top genes plot under the plot type menu. We can then use the provided teal module tm_g_quality to include a QC module in our teal app.
Code
Warning: 'experiments' dropped; see 'drops()'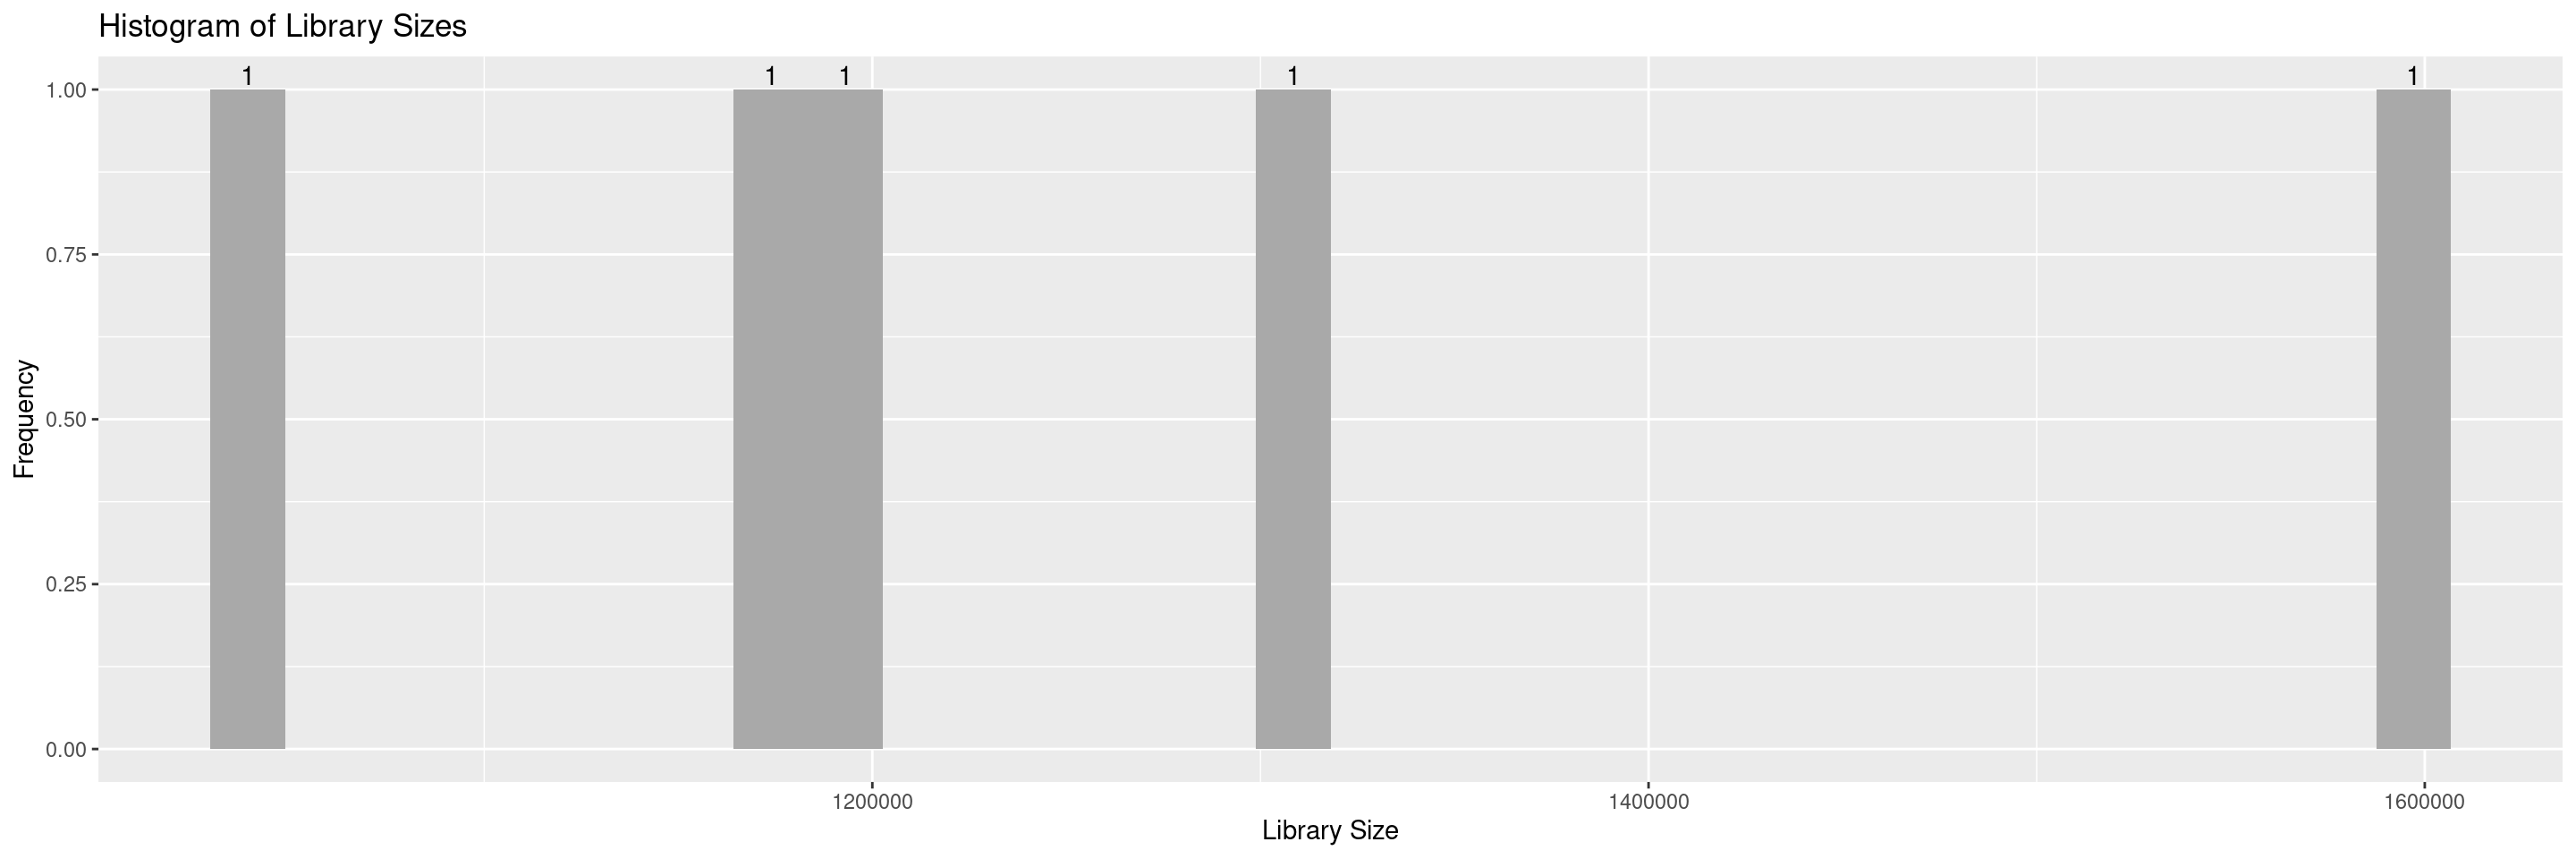
R version 4.4.1 (2024-06-14)
Platform: x86_64-pc-linux-gnu
Running under: Ubuntu 22.04.4 LTS

Matrix products: default
BLAS:   /usr/lib/x86_64-linux-gnu/openblas-pthread/libblas.so.3
LAPACK: /usr/lib/x86_64-linux-gnu/openblas-pthread/libopenblasp-r0.3.20.so;  LAPACK version 3.10.0

locale:
 [1] LC_CTYPE=en_US.UTF-8       LC_NUMERIC=C
 [3] LC_TIME=en_US.UTF-8        LC_COLLATE=en_US.UTF-8
 [5] LC_MONETARY=en_US.UTF-8    LC_MESSAGES=en_US.UTF-8
 [7] LC_PAPER=en_US.UTF-8       LC_NAME=C
 [9] LC_ADDRESS=C               LC_TELEPHONE=C
[11] LC_MEASUREMENT=en_US.UTF-8 LC_IDENTIFICATION=C

time zone: Etc/UTC
tzcode source: system (glibc)

attached base packages:
[1] stats4    stats     graphics  grDevices utils     datasets  methods
[8] base

other attached packages:
 [1] teal.modules.hermes_0.1.6.9020 teal_0.15.2.9061
 [3] teal.slice_0.5.1.9011          teal.data_0.6.0.9010
 [5] teal.code_0.5.0.9009           shiny_1.9.1
 [7] hermes_1.7.2.9002              SummarizedExperiment_1.34.0
 [9] Biobase_2.64.0                 GenomicRanges_1.56.1
[11] GenomeInfoDb_1.40.1            IRanges_2.38.1
[13] S4Vectors_0.42.1               BiocGenerics_0.50.0
[15] MatrixGenerics_1.16.0          matrixStats_1.4.1
[17] ggfortify_0.4.17               ggplot2_3.5.1

loaded via a namespace (and not attached):
  [1] RColorBrewer_1.1-3          jsonlite_1.8.8
  [3] shape_1.4.6.1               MultiAssayExperiment_1.30.3
  [5] magrittr_2.0.3              farver_2.1.2
  [7] rmarkdown_2.28              ragg_1.3.3
  [9] GlobalOptions_0.1.2         zlibbioc_1.50.0
 [11] vctrs_0.6.5                 memoise_2.0.1
 [13] webshot_0.5.5               BiocBaseUtils_1.7.3
 [15] htmltools_0.5.8.1           S4Arrays_1.4.1
 [17] forcats_1.0.0               progress_1.2.3
 [19] curl_5.2.2                  SparseArray_1.4.8
 [21] sass_0.4.9                  parallelly_1.38.0
 [23] bslib_0.8.0                 fontawesome_0.5.2
 [25] htmlwidgets_1.6.4           testthat_3.2.1.1
 [27] httr2_1.0.3                 cachem_1.1.0
 [29] teal.widgets_0.4.2.9020     mime_0.12
 [31] lifecycle_1.0.4             iterators_1.0.14
 [33] pkgconfig_2.0.3             webshot2_0.1.1
 [35] Matrix_1.7-0                R6_2.5.1
 [37] fastmap_1.2.0               future_1.34.0
 [39] GenomeInfoDbData_1.2.12     rbibutils_2.2.16
 [41] clue_0.3-65                 digest_0.6.37
 [43] colorspace_2.1-1            shinycssloaders_1.1.0
 [45] ps_1.8.0                    AnnotationDbi_1.66.0
 [47] DESeq2_1.44.0               textshaping_0.4.0
 [49] RSQLite_2.3.7               filelock_1.0.3
 [51] labeling_0.4.3              fansi_1.0.6
 [53] httr_1.4.7                  abind_1.4-8
 [55] compiler_4.4.1              bit64_4.0.5
 [57] withr_3.0.1                 doParallel_1.0.17
 [59] backports_1.5.0             BiocParallel_1.38.0
 [61] DBI_1.2.3                   logger_0.3.0
 [63] biomaRt_2.60.1              rappdirs_0.3.3
 [65] DelayedArray_0.30.1         rjson_0.2.22
 [67] chromote_0.3.1              tools_4.4.1
 [69] httpuv_1.6.15               glue_1.7.0
 [71] callr_3.7.6                 promises_1.3.0
 [73] grid_4.4.1                  checkmate_2.3.2
 [75] cluster_2.1.6               generics_0.1.3
 [77] gtable_0.3.5                websocket_1.4.2
 [79] tidyr_1.3.1                 hms_1.1.3
 [81] xml2_1.3.6                  utf8_1.2.4
 [83] XVector_0.44.0              ggrepel_0.9.6
 [85] foreach_1.5.2               pillar_1.9.0
 [87] stringr_1.5.1               limma_3.60.4
 [89] later_1.3.2                 circlize_0.4.16
 [91] dplyr_1.1.4                 BiocFileCache_2.12.0
 [93] lattice_0.22-6              bit_4.0.5
 [95] tidyselect_1.2.1            ComplexHeatmap_2.20.0
 [97] locfit_1.5-9.10             Biostrings_2.72.1
 [99] knitr_1.48                  gridExtra_2.3
[101] teal.logger_0.2.0.9009      edgeR_4.2.1
[103] xfun_0.47                   statmod_1.5.0
[105] brio_1.1.5                  stringi_1.8.4
[107] UCSC.utils_1.0.0            yaml_2.3.10
[109] shinyWidgets_0.8.6          evaluate_0.24.0
[111] codetools_0.2-20            tibble_3.2.1
[113] cli_3.6.3                   systemfonts_1.1.0
[115] xtable_1.8-4                Rdpack_2.6.1
[117] jquerylib_0.1.4             processx_3.8.4
[119] munsell_0.5.1               teal.reporter_0.3.1.9015
[121] Rcpp_1.0.13                 globals_0.16.3
[123] dbplyr_2.5.0                png_0.1-8
[125] parallel_4.4.1              assertthat_0.2.1
[127] blob_1.2.4                  prettyunits_1.2.0
[129] listenv_0.9.1               scales_1.3.0
[131] purrr_1.0.2                 crayon_1.5.3
[133] GetoptLong_1.0.5            rlang_1.1.4
[135] formatR_1.14                KEGGREST_1.44.1
[137] shinyjs_2.1.0