class: HermesData
assays(1): counts
genes(5085): GeneID:11185 GeneID:10677 ... GeneID:9087 GeneID:9426
additional gene information(12): HGNC HGNCGeneName ... chromosome_name
  LowExpressionFlag
samples(20): 06520011B0023R 06520067C0018R ... 06520015C0016R
  06520019C0023R
additional sample information(74): Filename SampleID ... LowDepthFlag
TechnicalFailureFlagRNAG1
RNAseq QC Graphs
RNAG
This page can be used as a template of how to use the available hermes functions for simple QC analyses of RNA-seq gene expression data and to create interactive QC graphs using teal.modules.hermes.
We start by creating HermesData from a SummarizedExperiment (SE) object. An example SummarizedExperiment object with name summarized_experiment is available in hermes.
At this point we can also take the already prepared object hermes_data instead. First we add all quality flags (low expression, low read depth, technical failure).
We can look at how many samples or genes have been flagged.
FALSE  TRUE
 2391  2694
FALSE  TRUE
   19     1
FALSE
   20
We then filter for samples that pass all quality checks (i.e. all flags are FALSE).
It is also possible to only filter genes or samples via the what argument of filter().
Now that the samples are properly filtered, we can apply our normalization method. By default, if a method is not specified for normalize() then five methods (cpm, rpkm, tpm, voom, vst) will be performed and results saved as separate assays. If only one method is needed, it can be easily specified in the methods argument. In addition, if the rlog transformation method is preferred, it can also be specified in the methods argument.
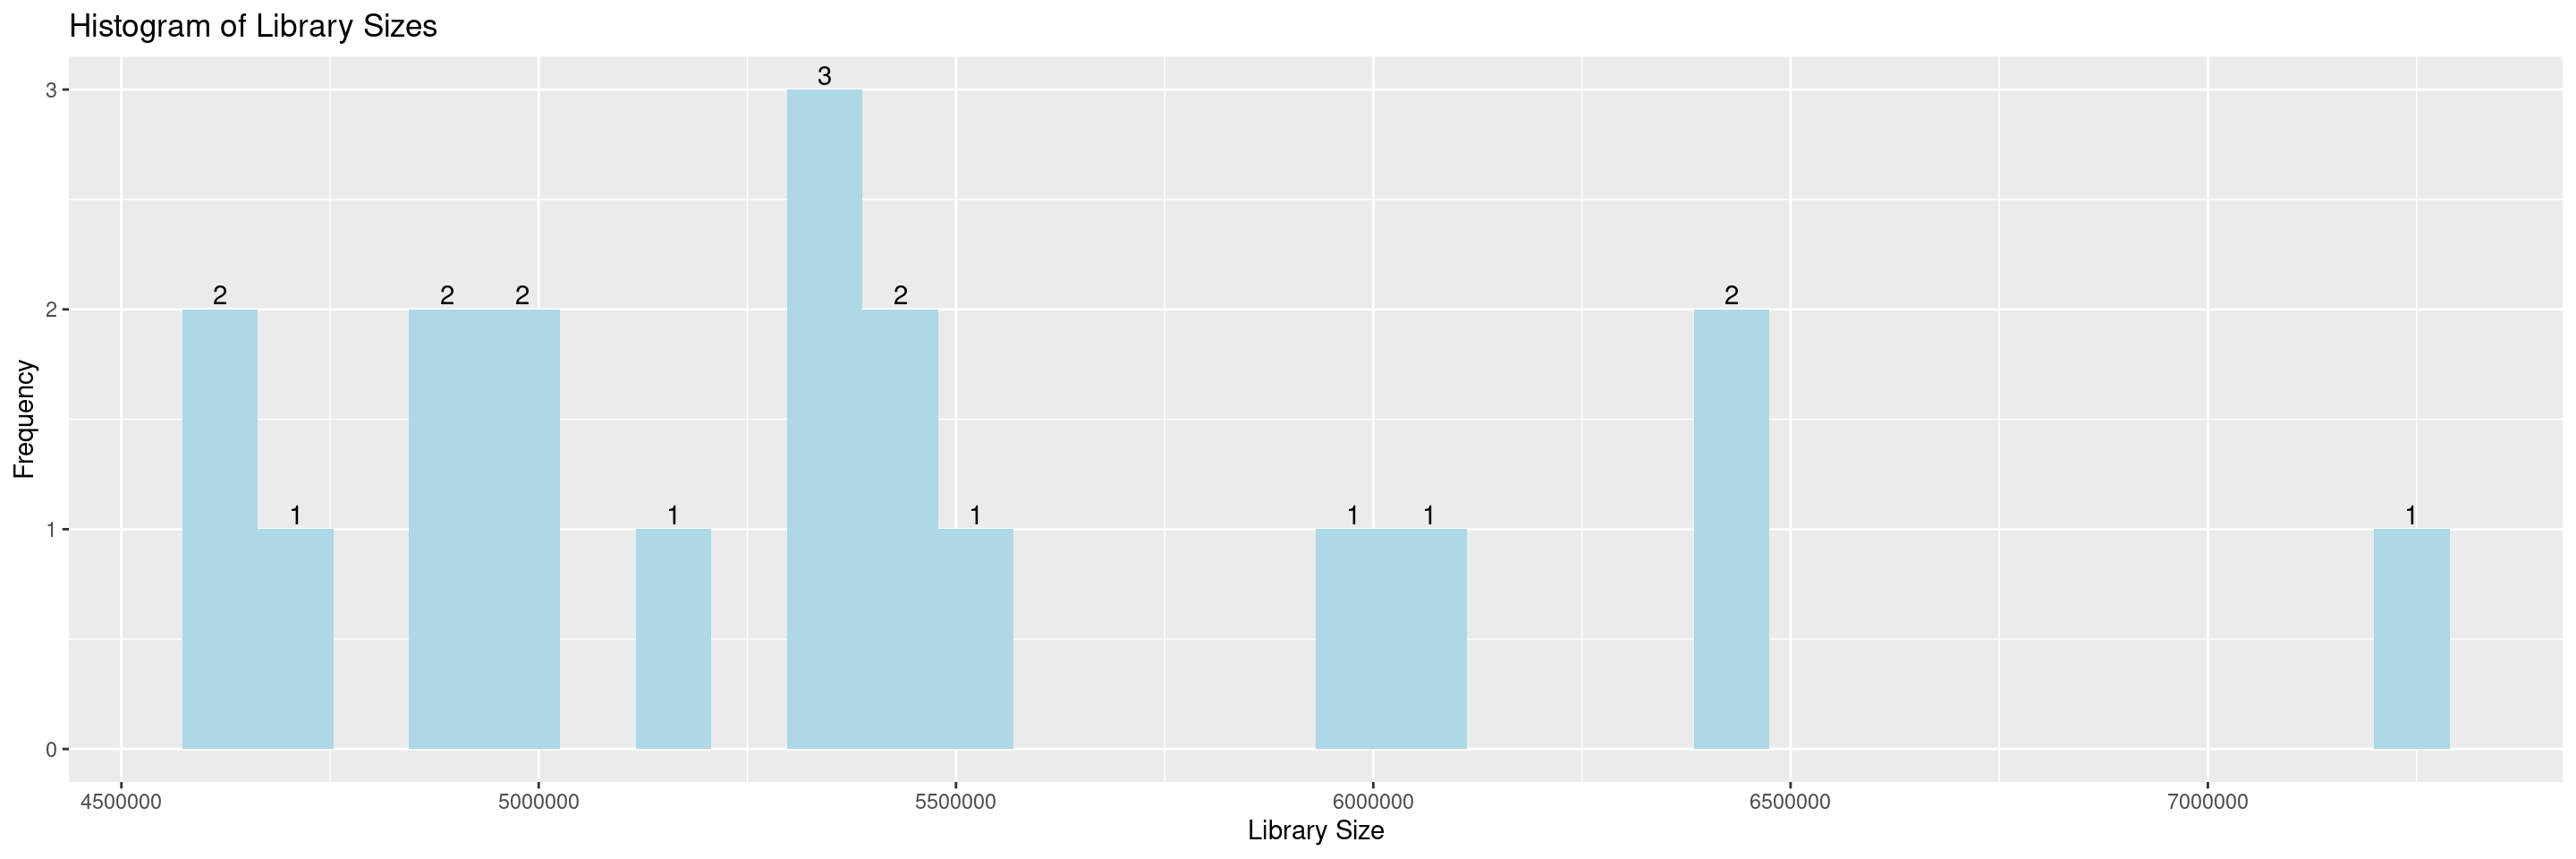
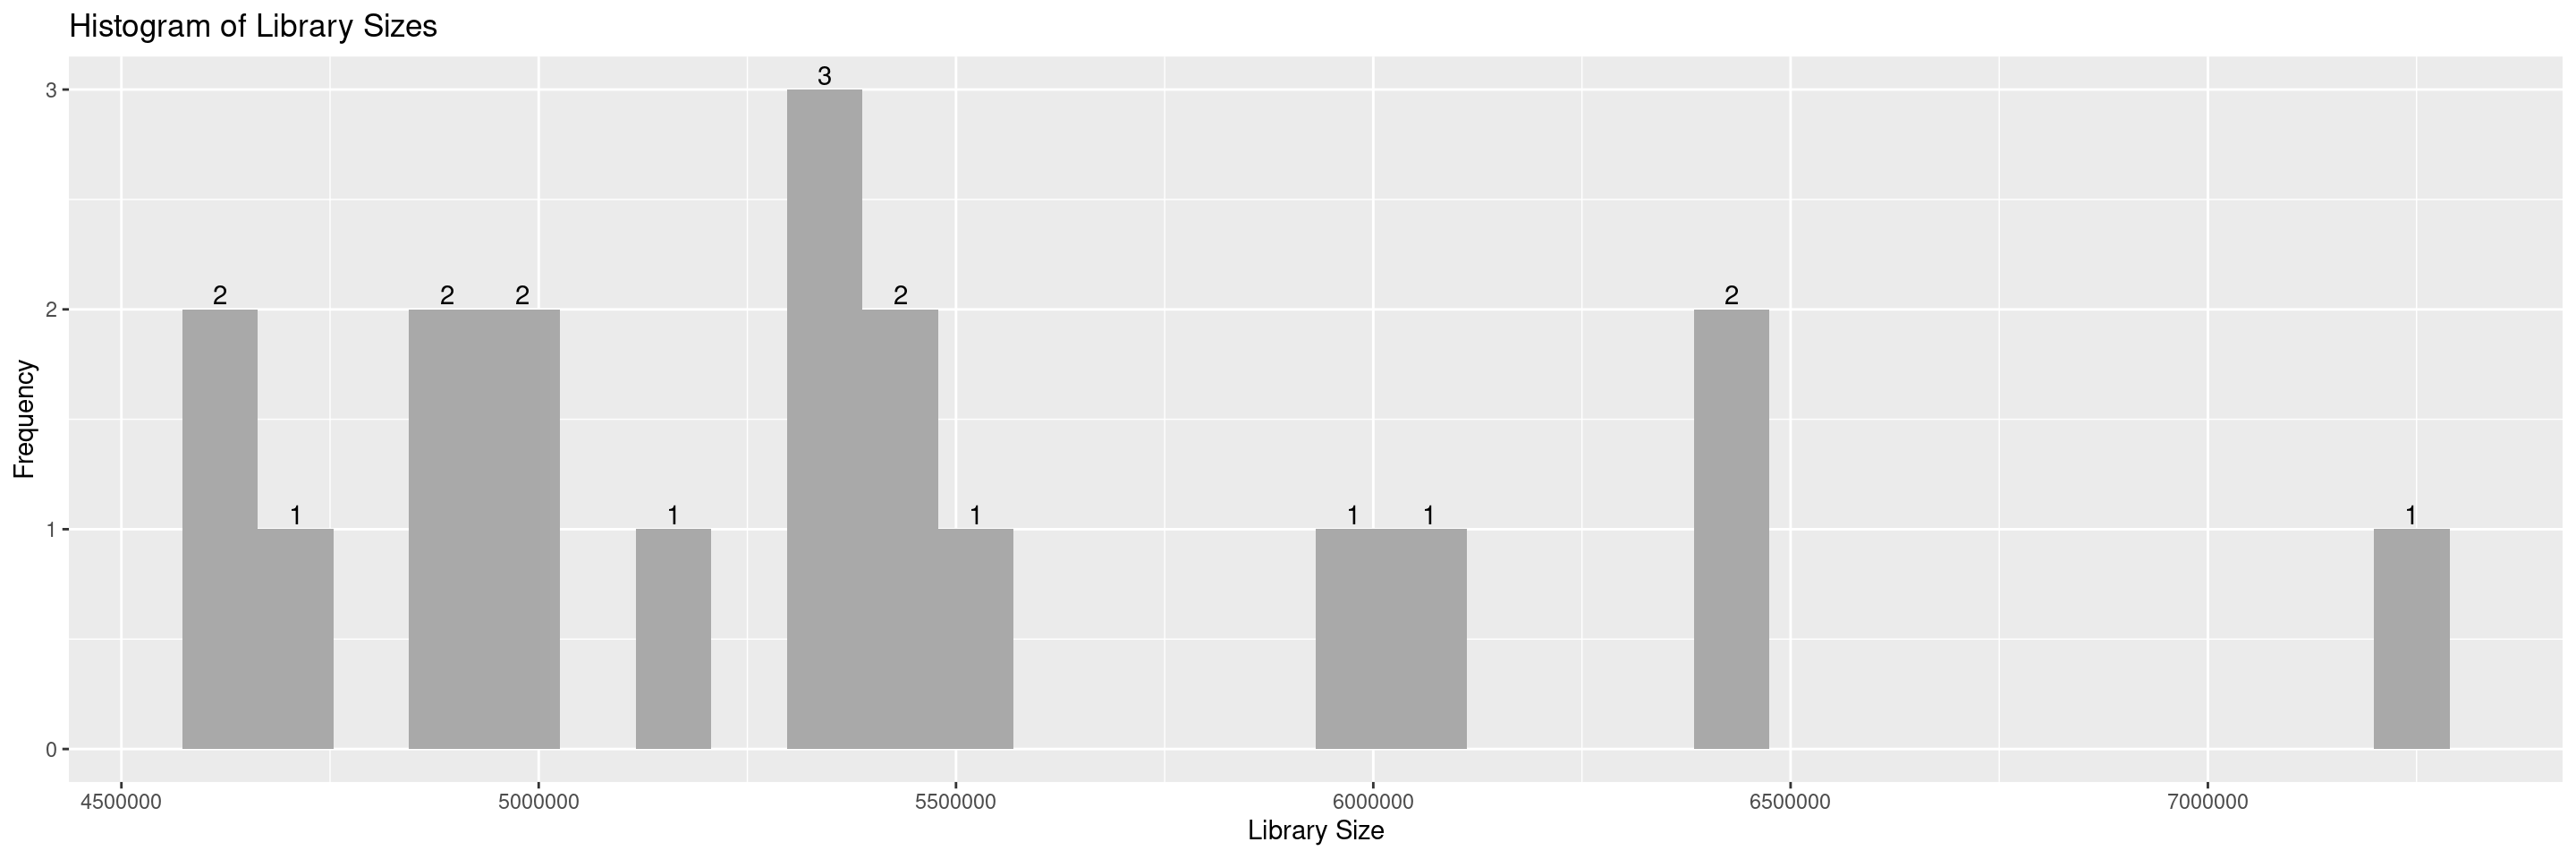
The hermes package offers a series of draw_* functions to help in the QC process. First we introduce draw_libsize_hist() which displays a histogram of the sample library sizes.
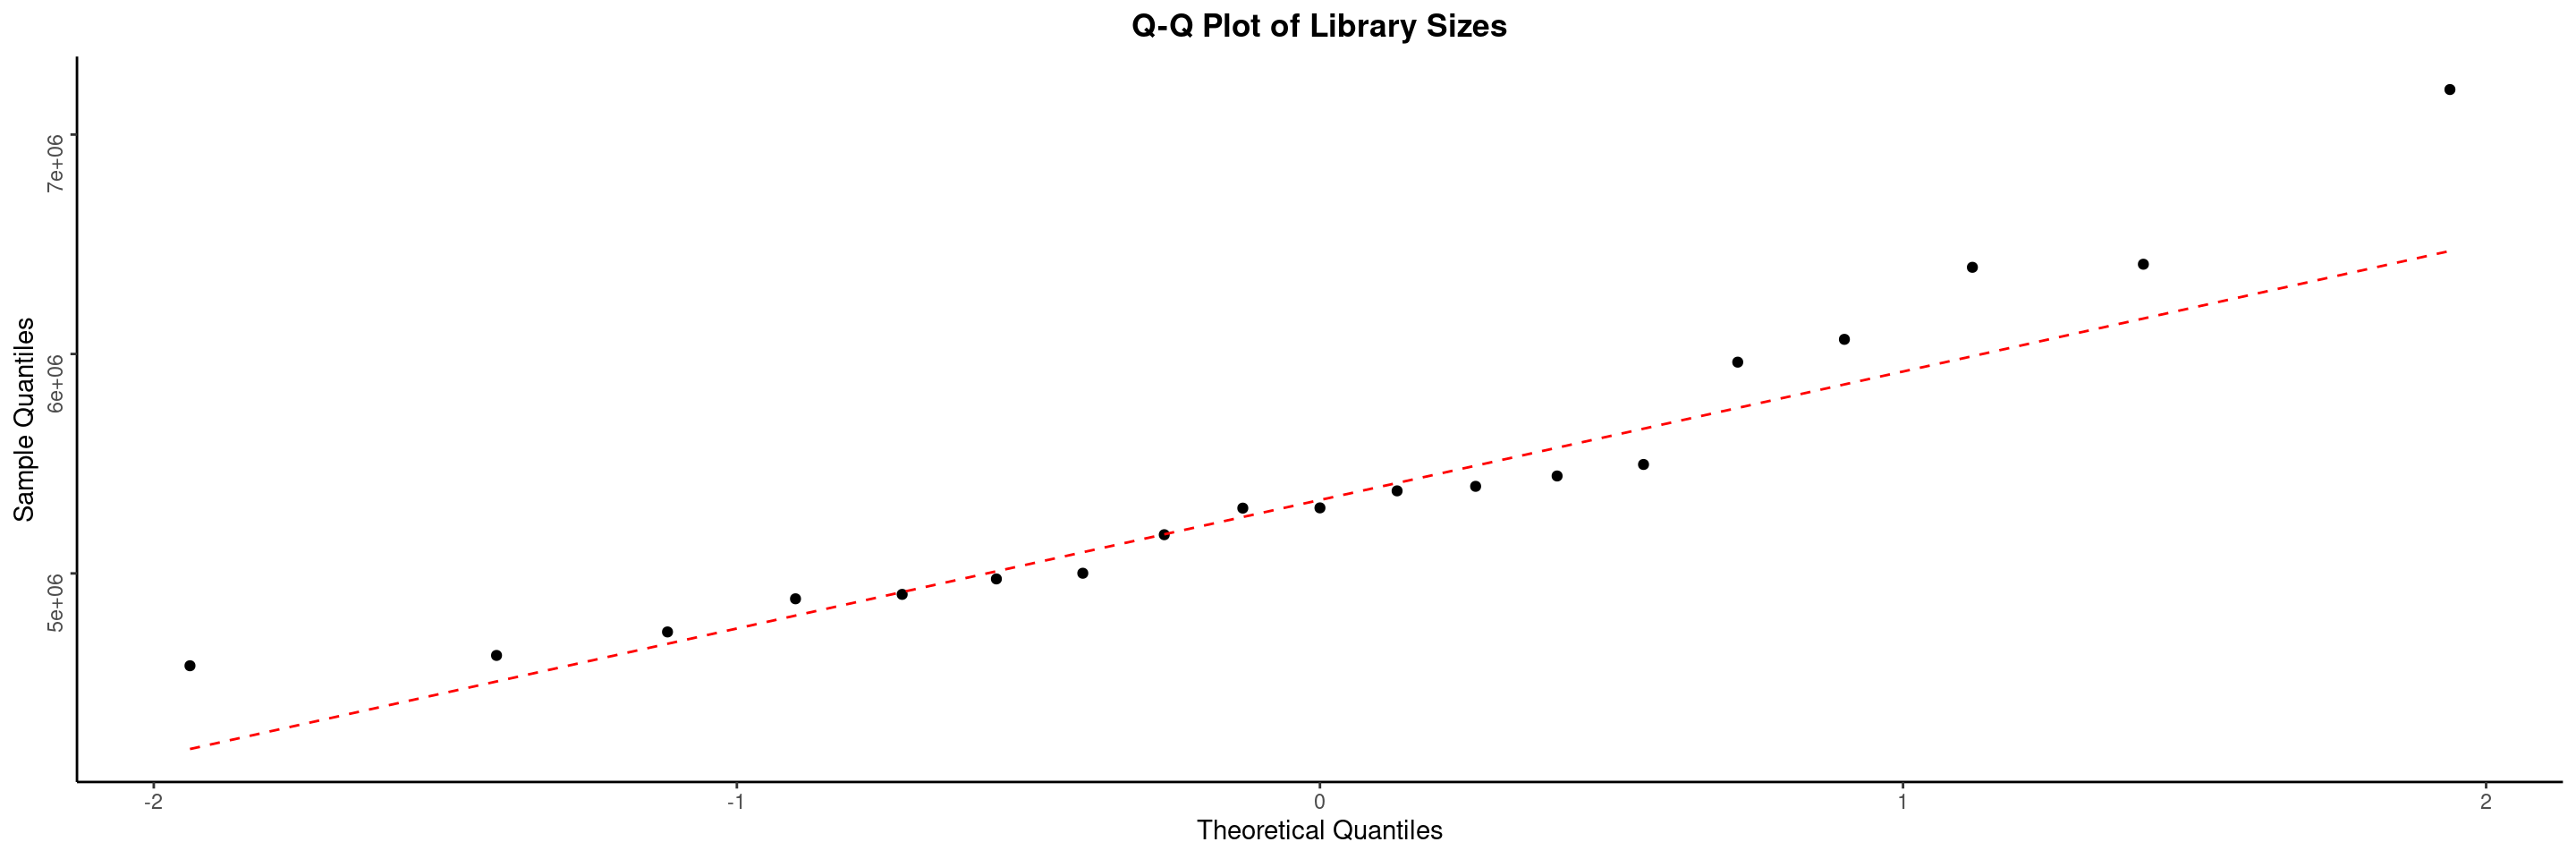
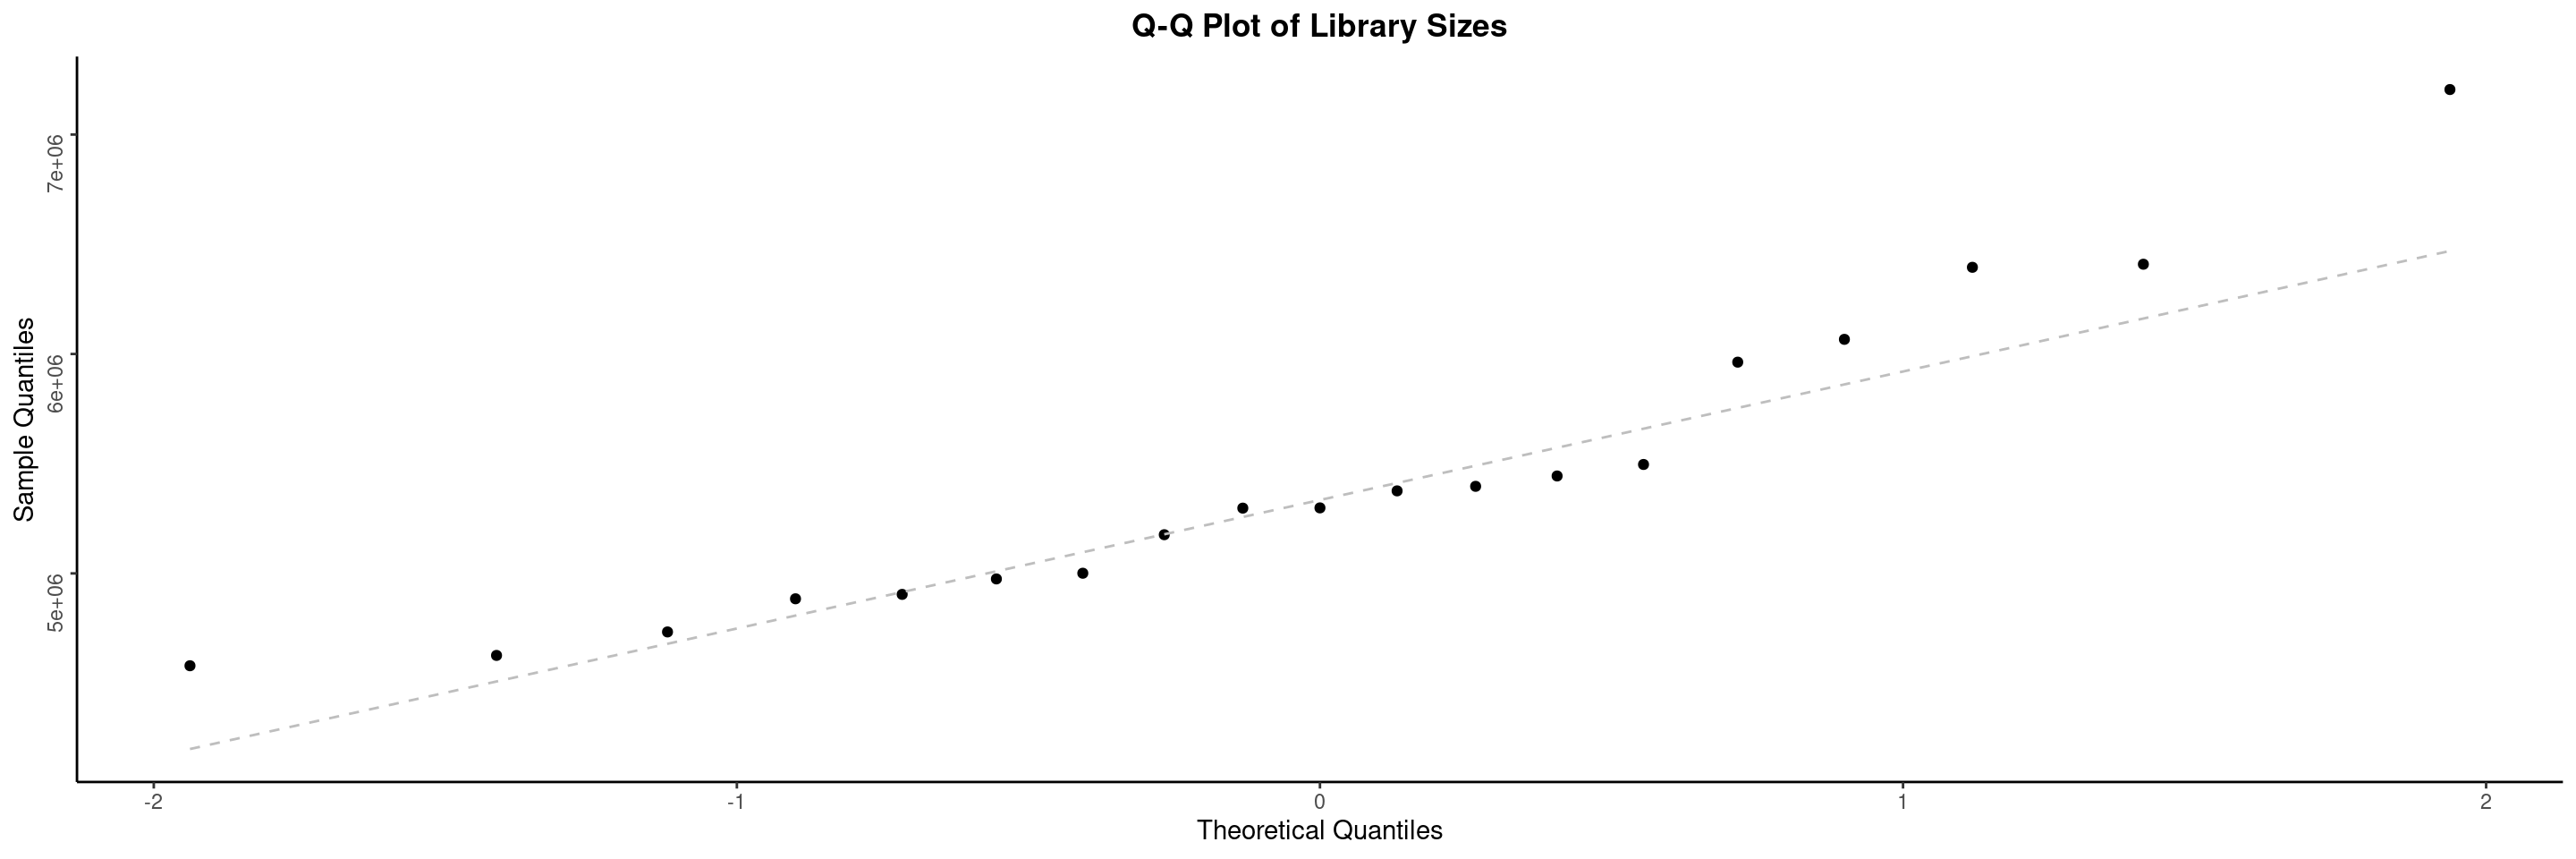
The draw_libsize_qq() displays a QQ plot of the samples library size. Here we look for potential outliers.
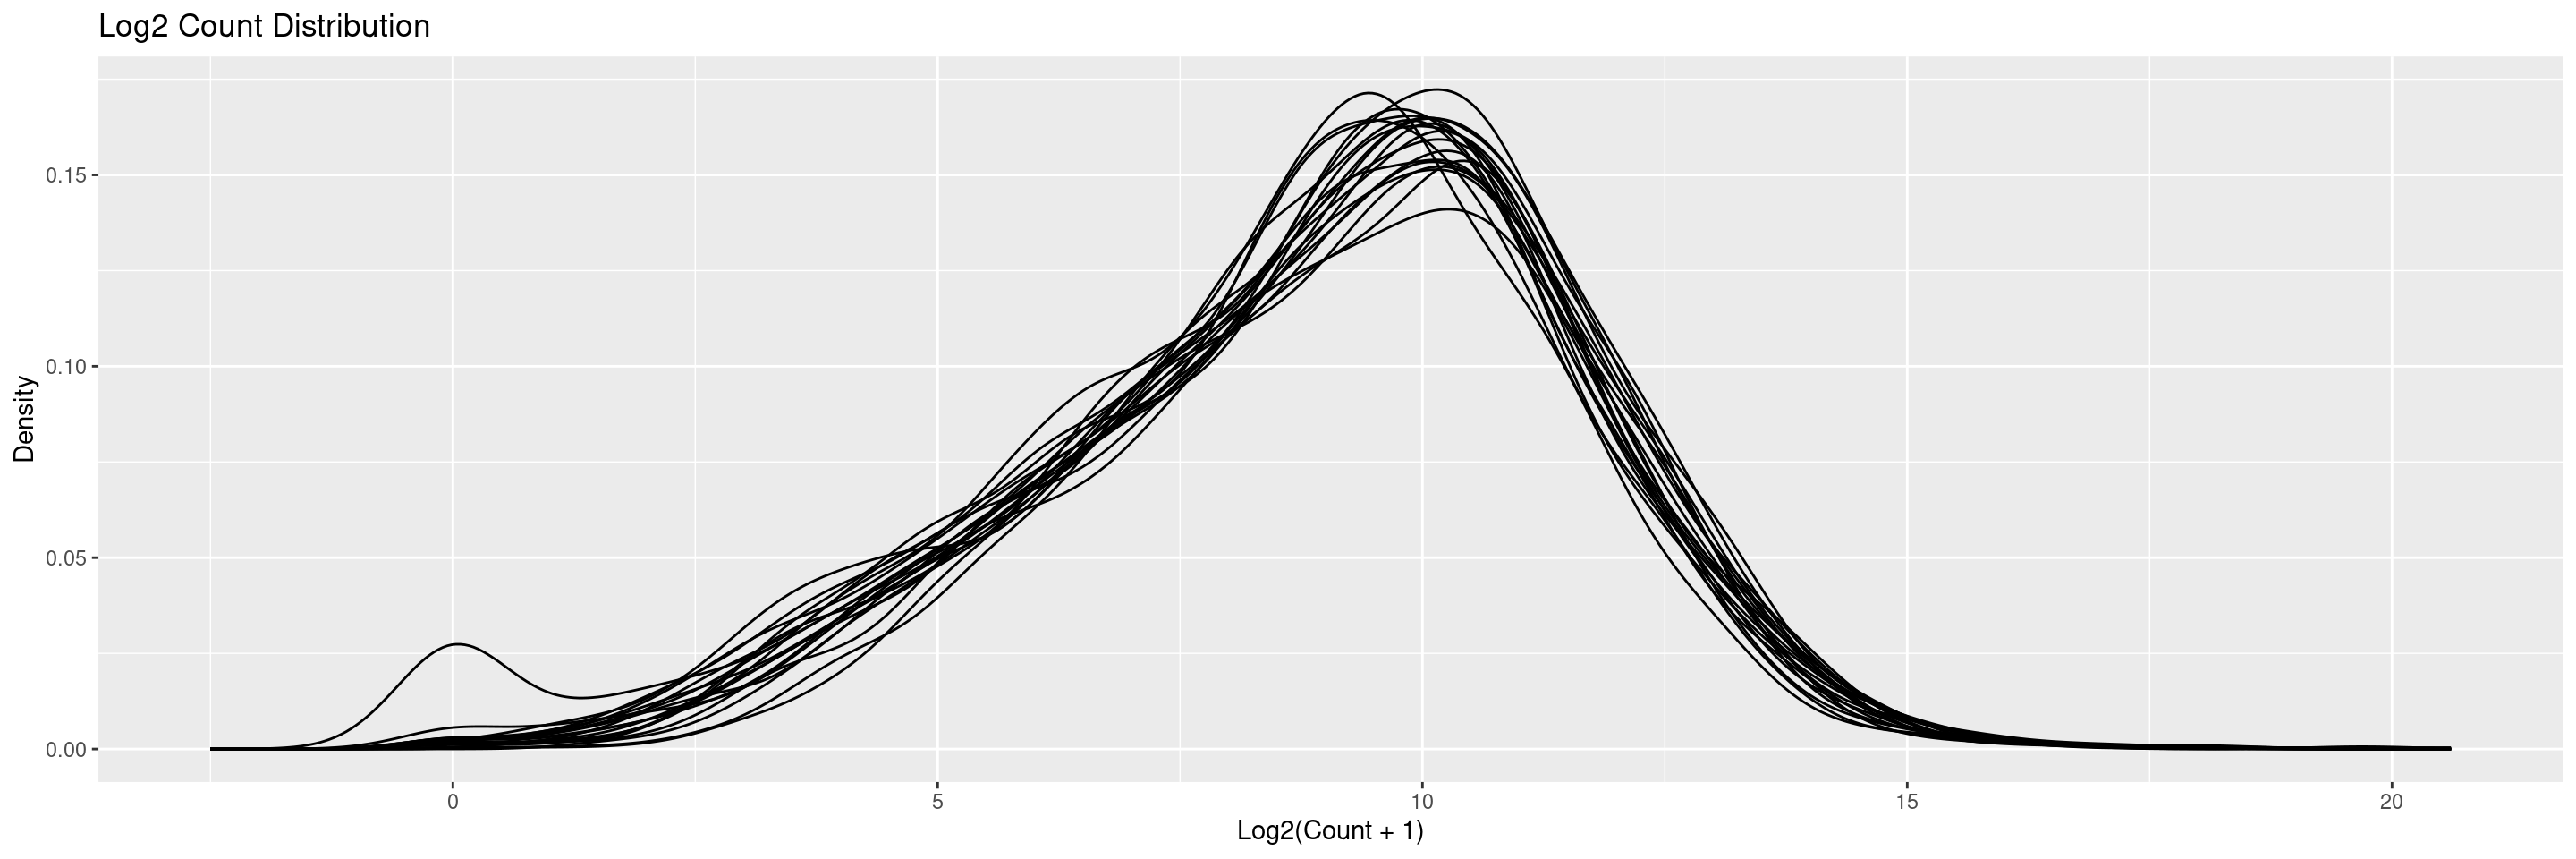
The draw_libsize_densities() displays a density plot of the (log) counts distributions. Distribution lines correspond to each sample.
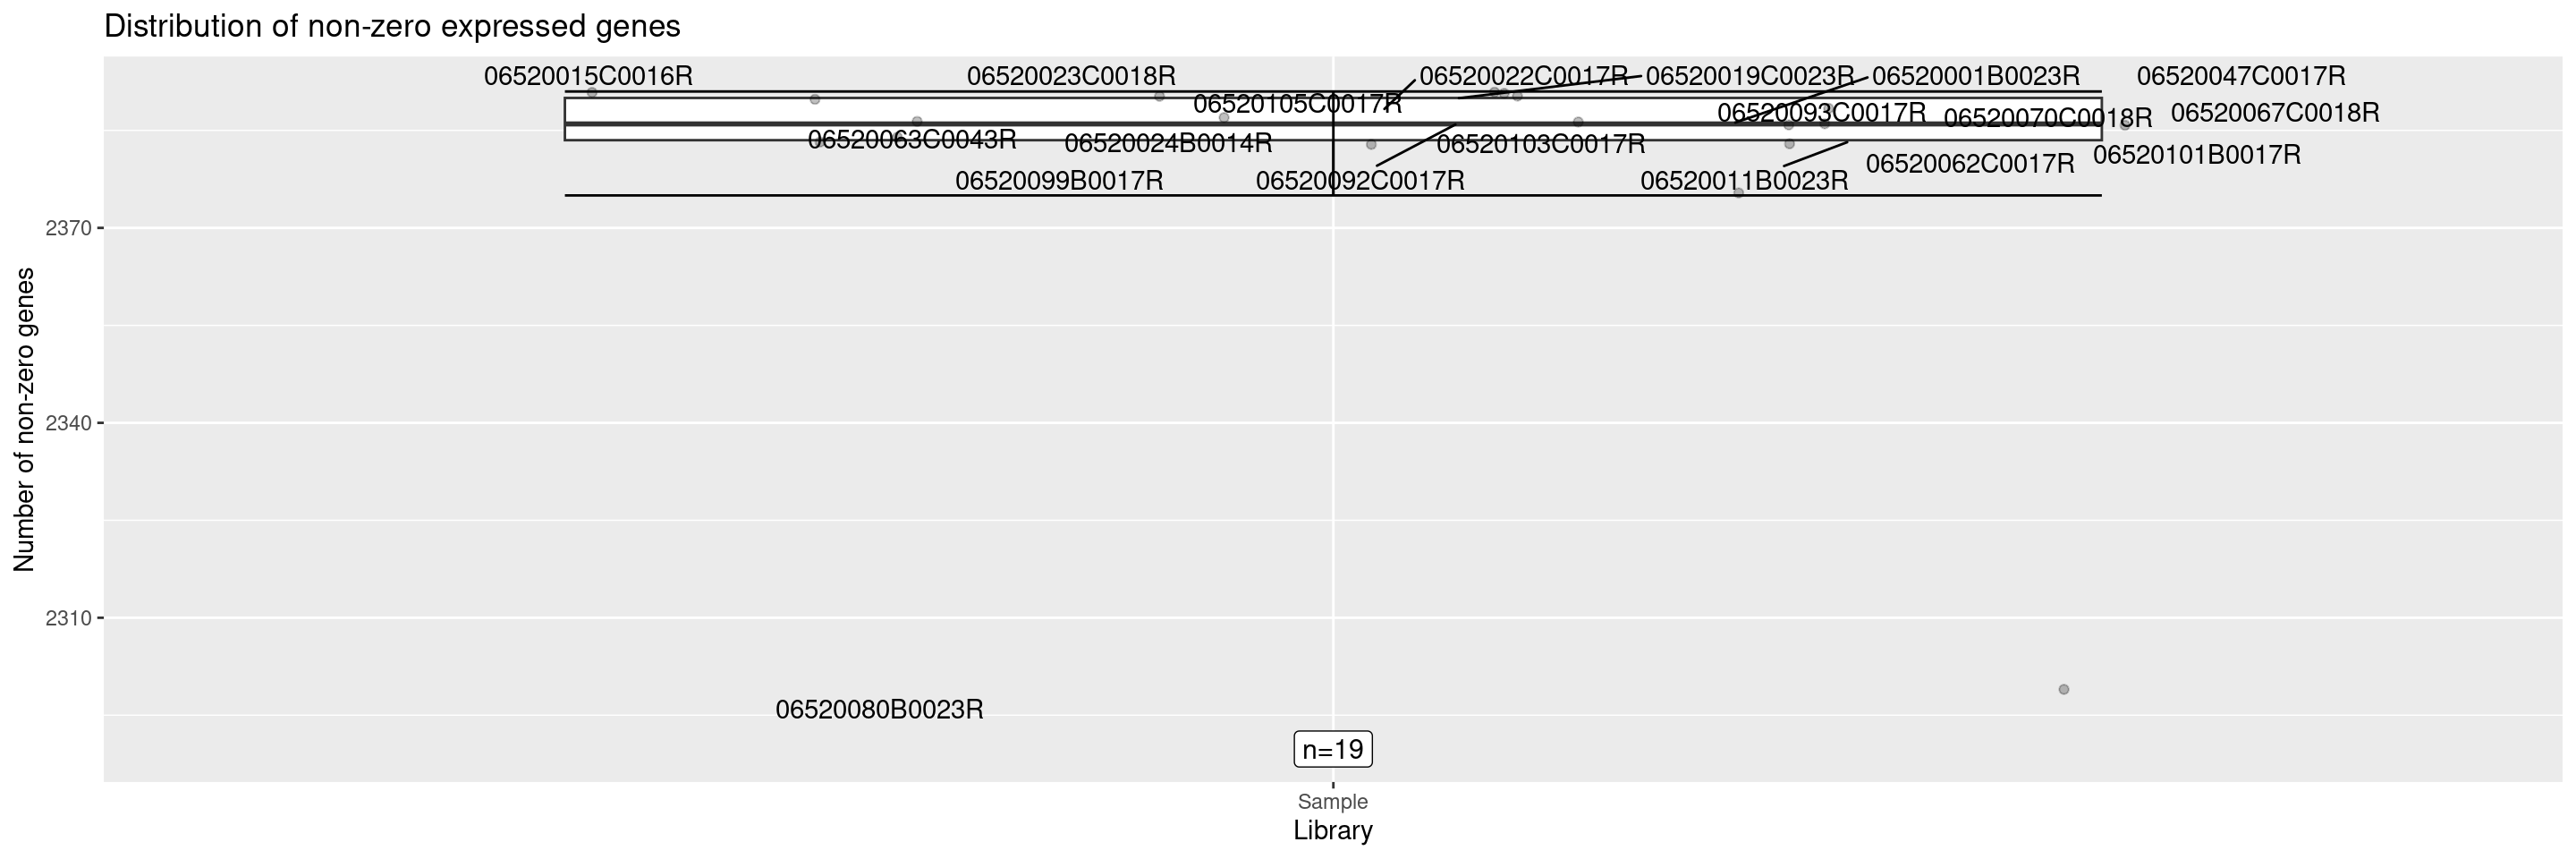
The draw_nonzero_boxplot() displays a box plot of the non-zero expressed genes per sample.
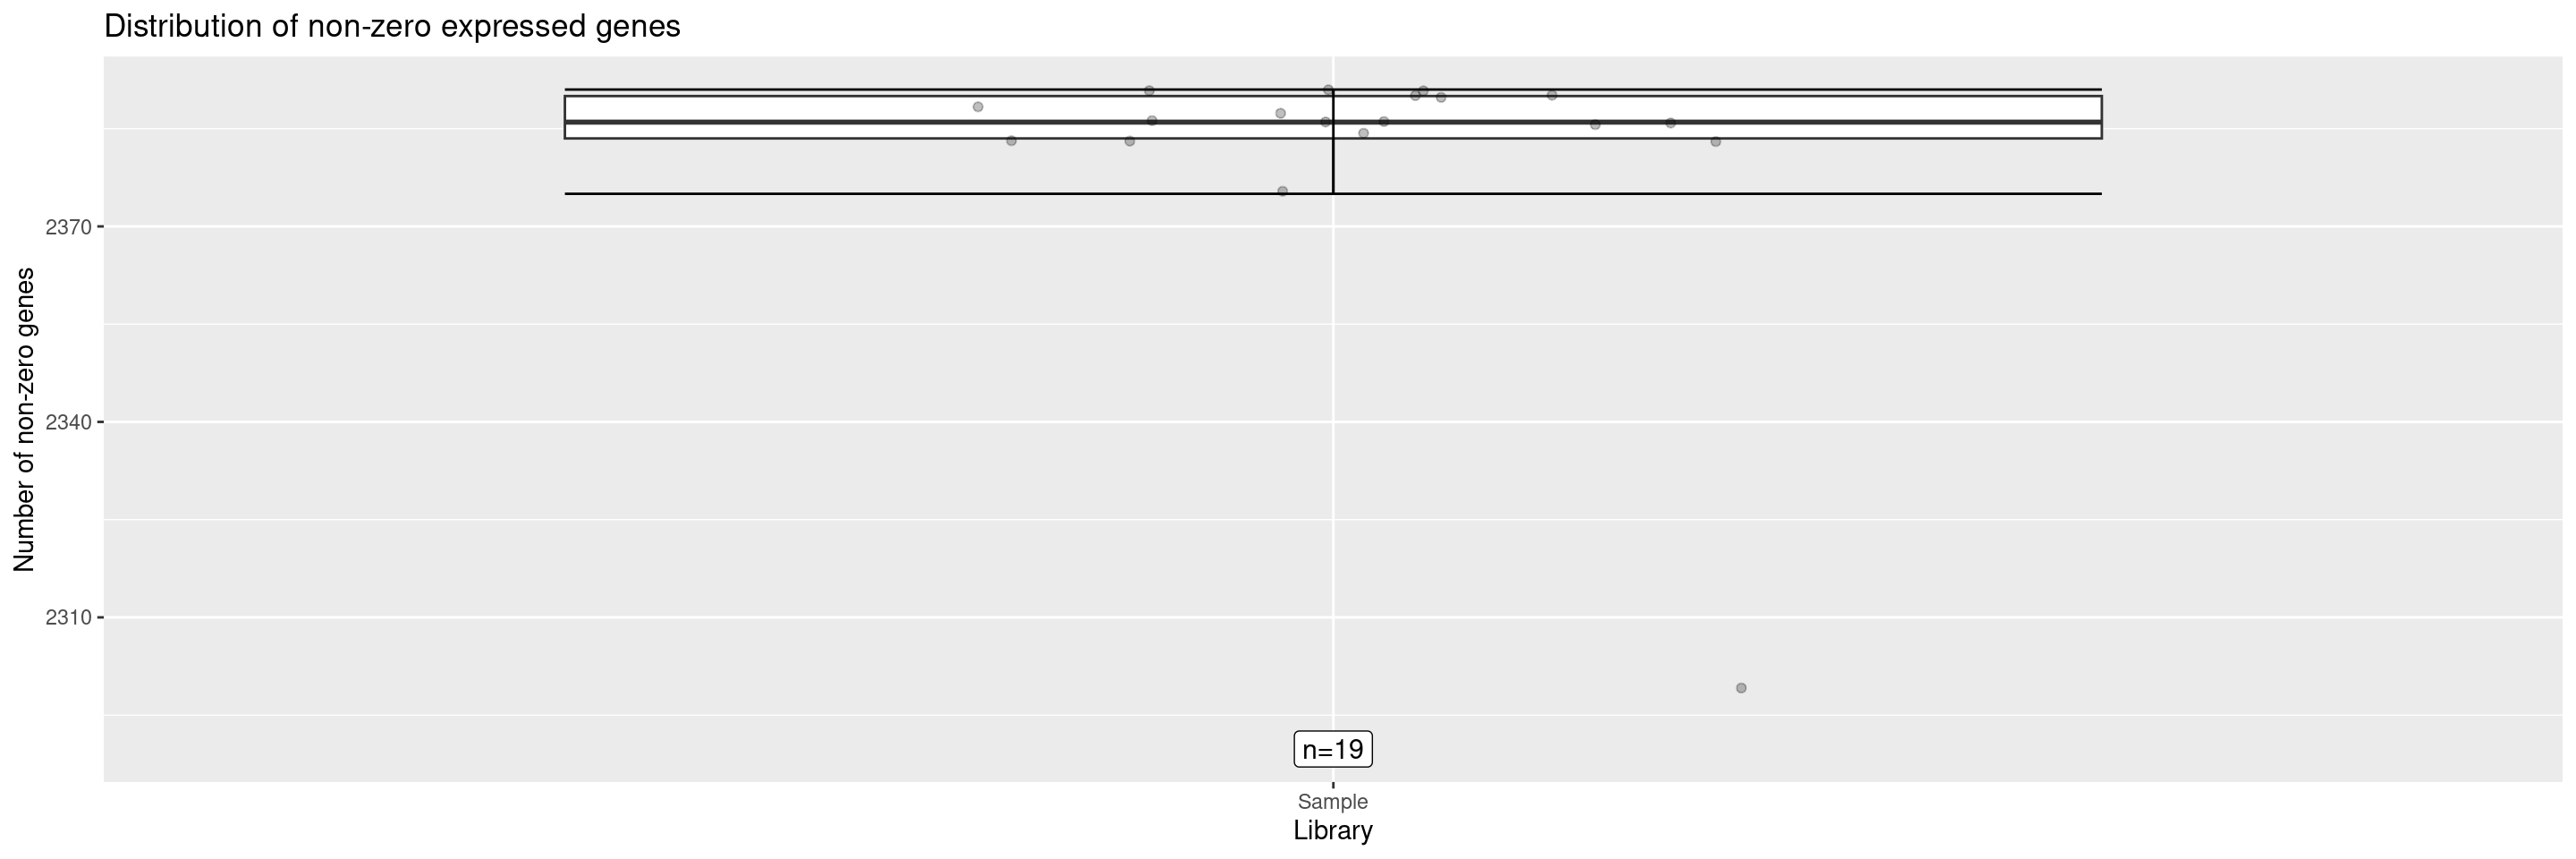
It’s also possible to add an additional ggplot2 layer to get the sample ID of any points of interest, reusing the same position for labeling. If the labeling of several data points overlaps, the parameters of position_jitter() or geom_text_repel() can be adjusted to avoid that.
Code
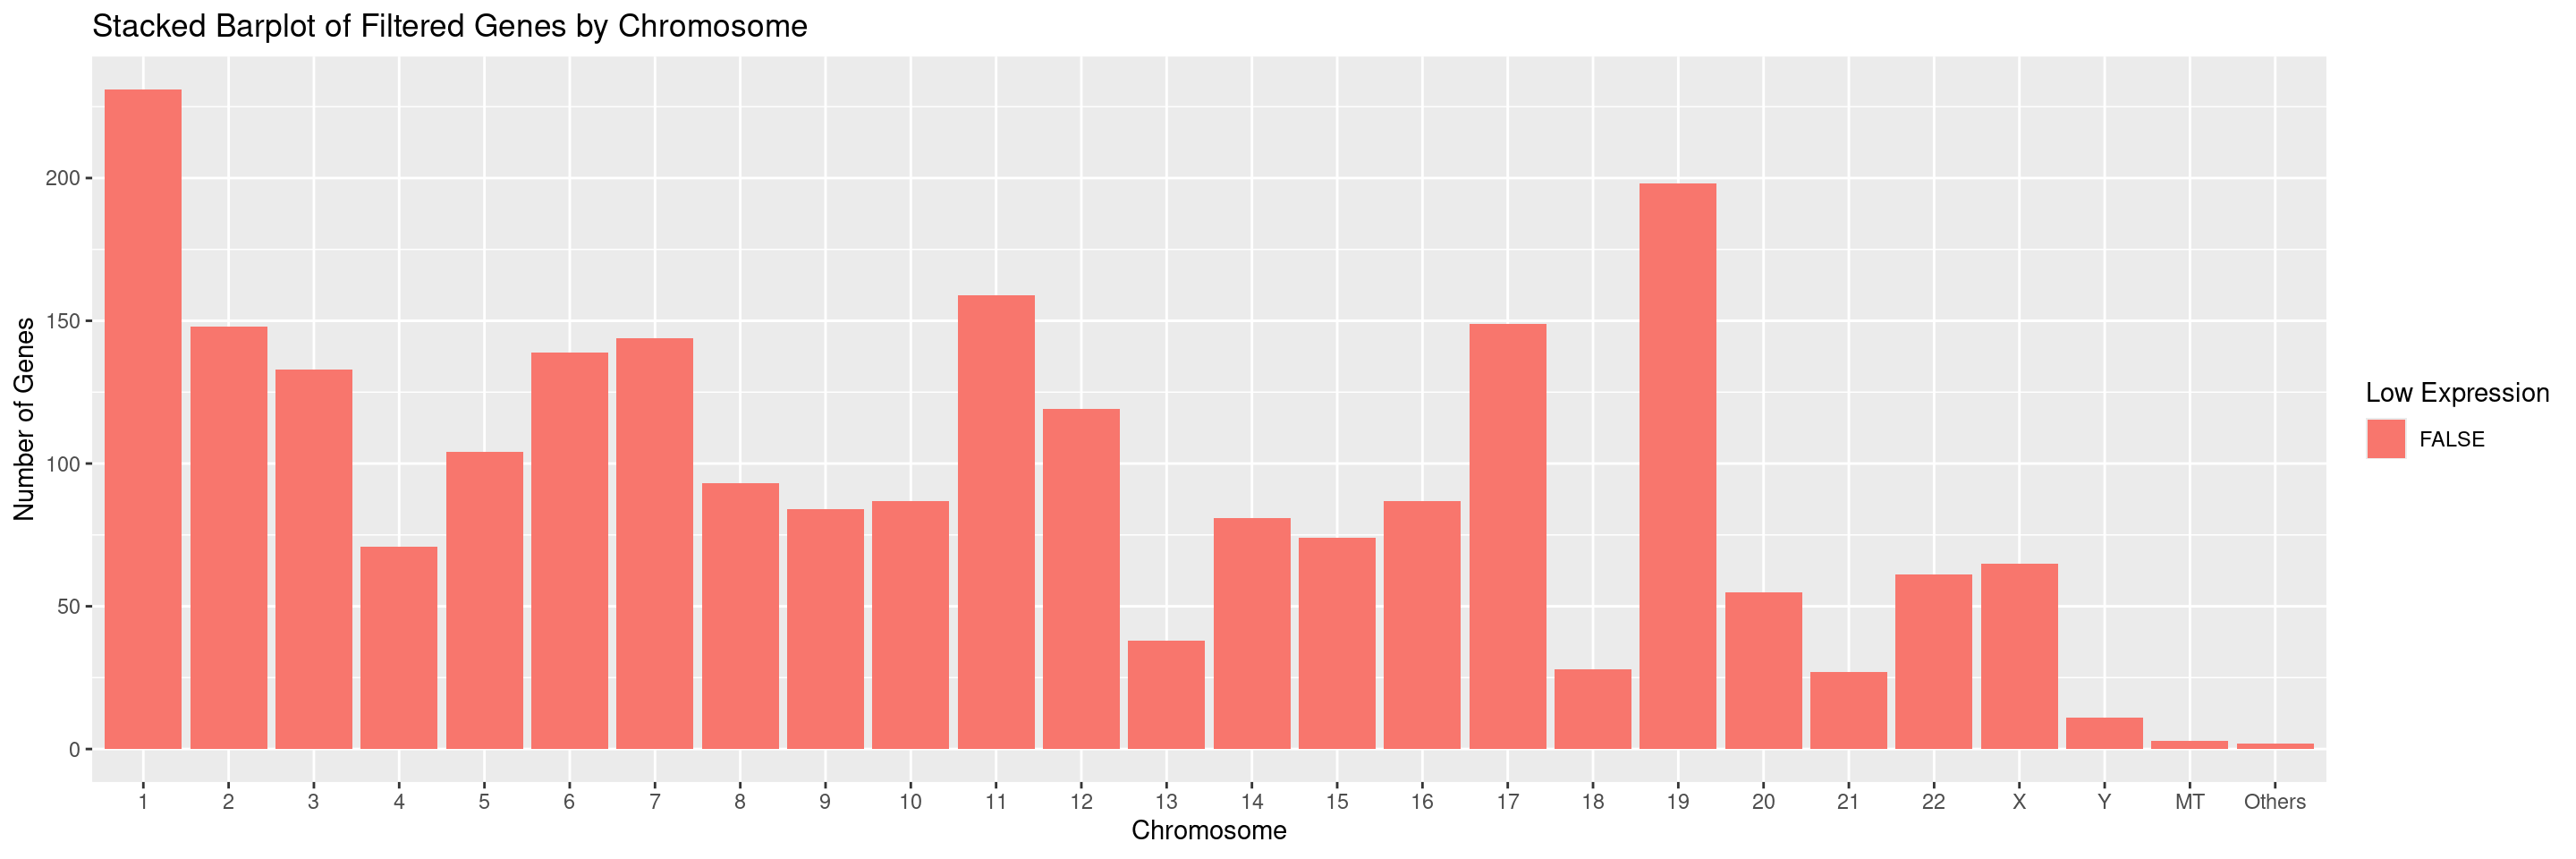
The draw_nonzero_boxplot() displays a box plot of the non-zero expressed genes per sample.
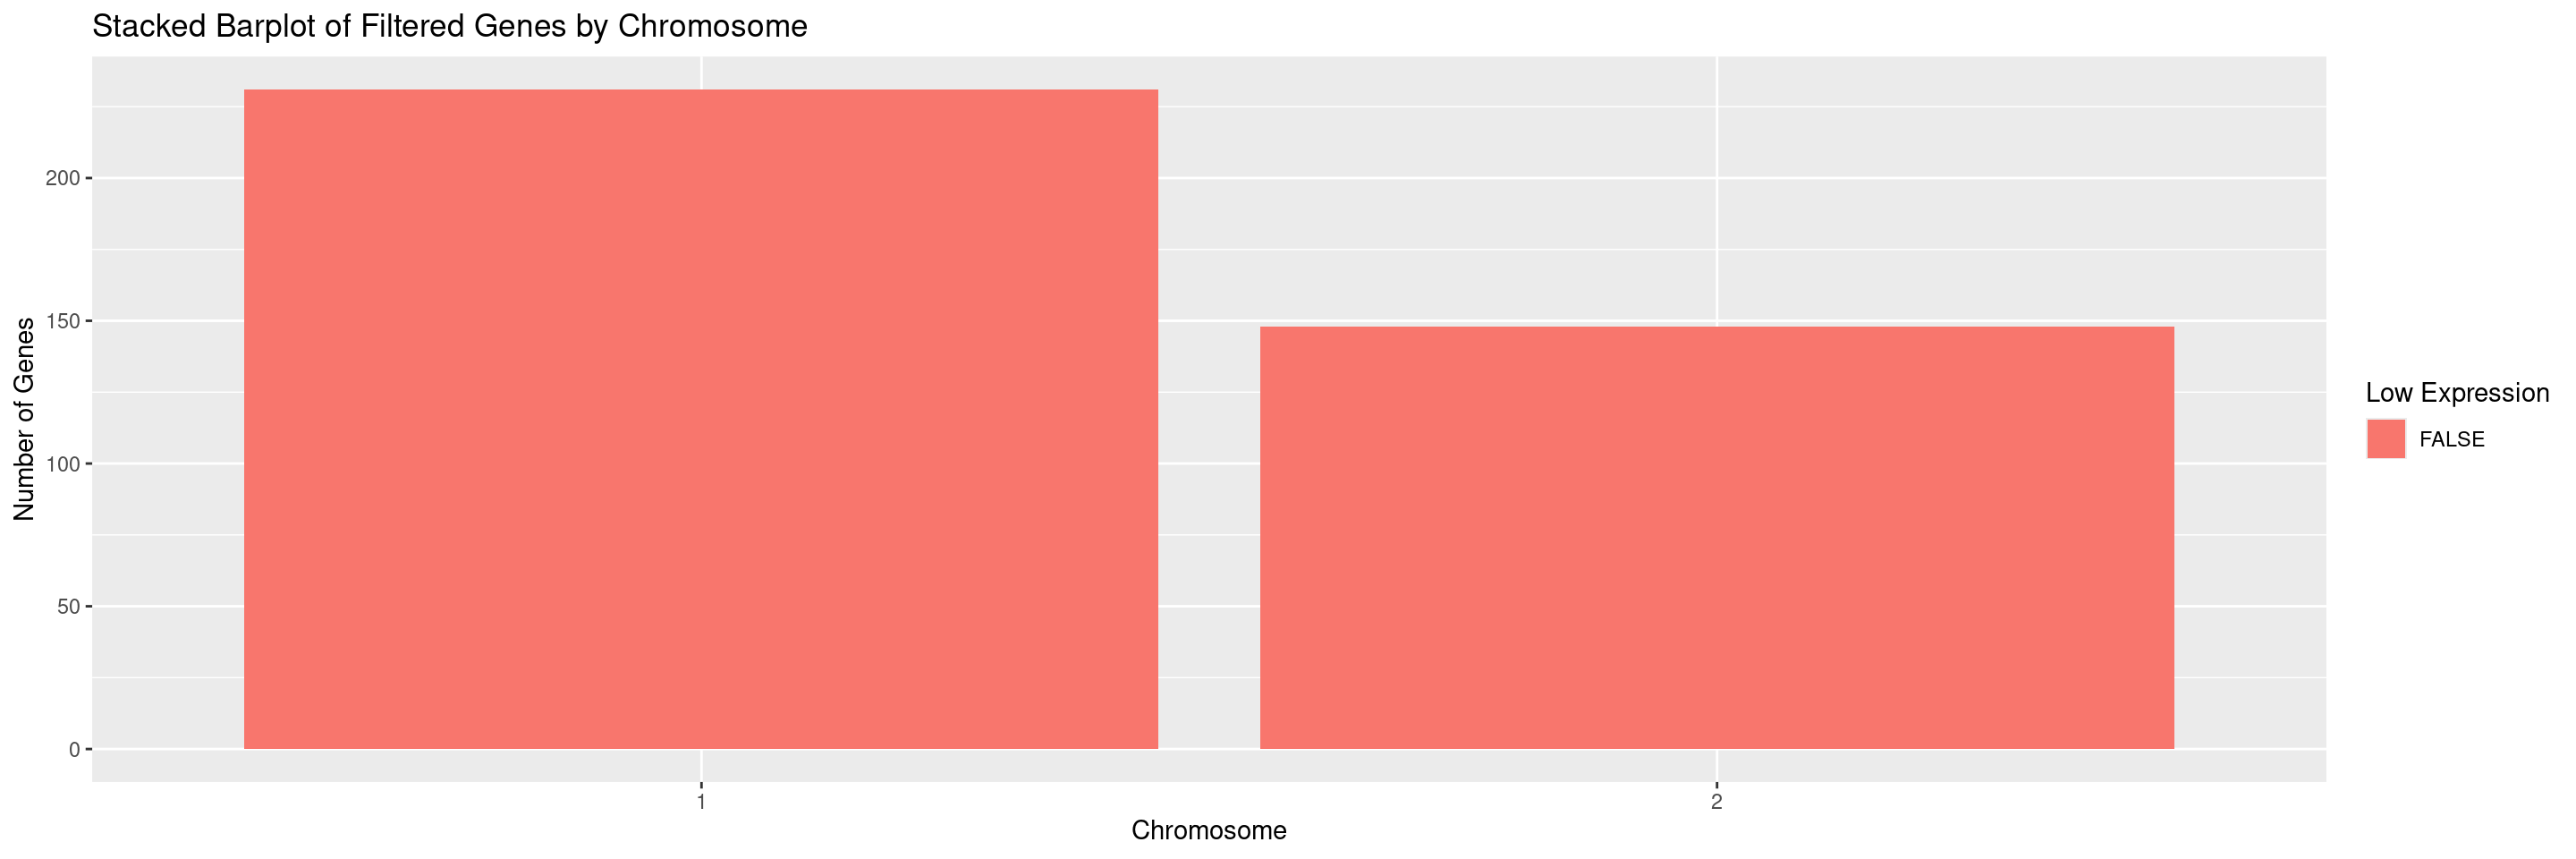
We can also select for specific chromosomes by specifying the values in the chromosomes parameter. For example, to only display chromosomes 1 and 2 separately and ignore all others:
It is also possible to call all available draw_* functions with one function, autoplot(). Note: autoplot() does not allow for customization of the plots. We recommend using the appropriate draw_* function if you wish to make adjustments to the plots.


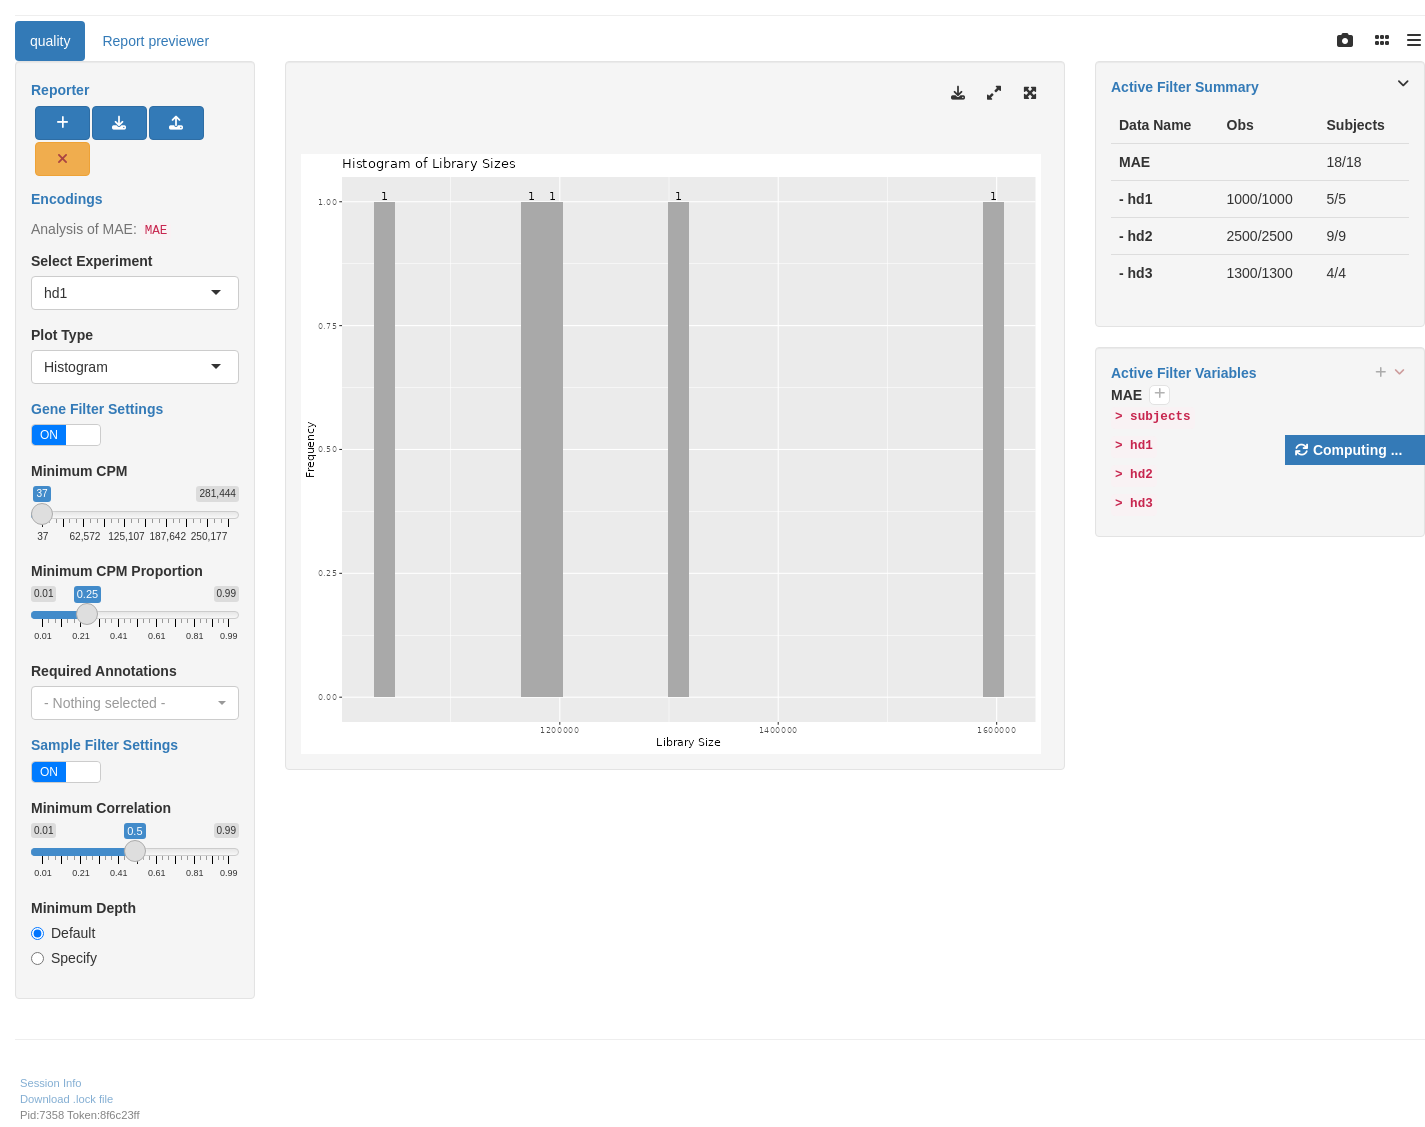
We start by importing a MultiAssayExperiment; here we use the example multi_assay_experiment available in hermes. It is wrapped as a teal::dataset. We can then use the provided teal module tm_g_quality to include a QC module in our teal app.
Code
Warning: 'experiments' dropped; see 'drops()'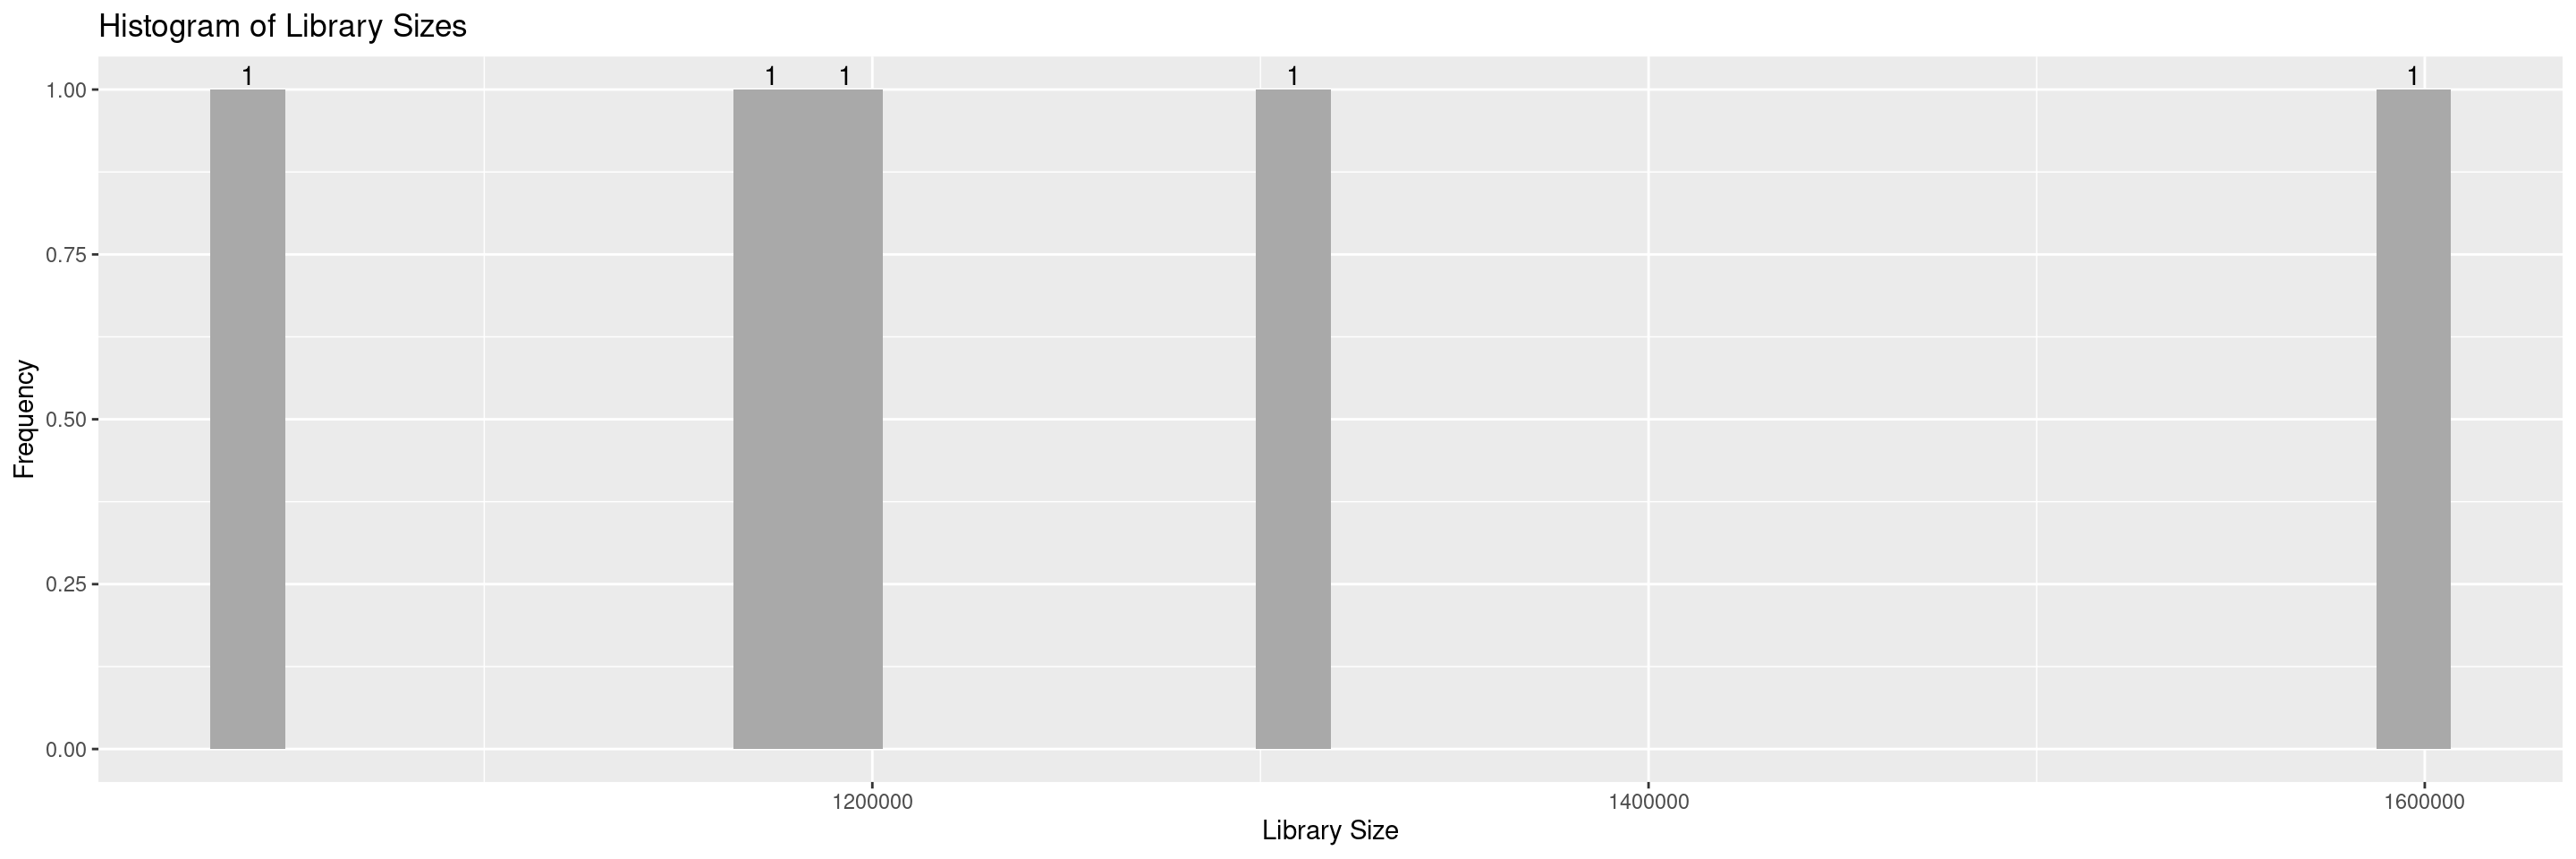
R version 4.4.1 (2024-06-14)
Platform: x86_64-pc-linux-gnu
Running under: Ubuntu 22.04.4 LTS

Matrix products: default
BLAS:   /usr/lib/x86_64-linux-gnu/openblas-pthread/libblas.so.3
LAPACK: /usr/lib/x86_64-linux-gnu/openblas-pthread/libopenblasp-r0.3.20.so;  LAPACK version 3.10.0

locale:
 [1] LC_CTYPE=en_US.UTF-8       LC_NUMERIC=C
 [3] LC_TIME=en_US.UTF-8        LC_COLLATE=en_US.UTF-8
 [5] LC_MONETARY=en_US.UTF-8    LC_MESSAGES=en_US.UTF-8
 [7] LC_PAPER=en_US.UTF-8       LC_NAME=C
 [9] LC_ADDRESS=C               LC_TELEPHONE=C
[11] LC_MEASUREMENT=en_US.UTF-8 LC_IDENTIFICATION=C

time zone: Etc/UTC
tzcode source: system (glibc)

attached base packages:
[1] stats4    stats     graphics  grDevices utils     datasets  methods
[8] base

other attached packages:
 [1] teal.modules.hermes_0.1.6.9020 teal_0.15.2.9061
 [3] teal.slice_0.5.1.9011          teal.data_0.6.0.9010
 [5] teal.code_0.5.0.9009           shiny_1.9.1
 [7] ggrepel_0.9.6                  hermes_1.7.2.9002
 [9] SummarizedExperiment_1.34.0    Biobase_2.64.0
[11] GenomicRanges_1.56.1           GenomeInfoDb_1.40.1
[13] IRanges_2.38.1                 S4Vectors_0.42.1
[15] BiocGenerics_0.50.0            MatrixGenerics_1.16.0
[17] matrixStats_1.4.1              ggfortify_0.4.17
[19] ggplot2_3.5.1

loaded via a namespace (and not attached):
  [1] RColorBrewer_1.1-3          jsonlite_1.8.8
  [3] shape_1.4.6.1               MultiAssayExperiment_1.30.3
  [5] magrittr_2.0.3              farver_2.1.2
  [7] rmarkdown_2.28              ragg_1.3.3
  [9] GlobalOptions_0.1.2         zlibbioc_1.50.0
 [11] vctrs_0.6.5                 memoise_2.0.1
 [13] webshot_0.5.5               BiocBaseUtils_1.7.3
 [15] htmltools_0.5.8.1           S4Arrays_1.4.1
 [17] forcats_1.0.0               progress_1.2.3
 [19] curl_5.2.2                  SparseArray_1.4.8
 [21] sass_0.4.9                  parallelly_1.38.0
 [23] bslib_0.8.0                 fontawesome_0.5.2
 [25] htmlwidgets_1.6.4           testthat_3.2.1.1
 [27] httr2_1.0.3                 cachem_1.1.0
 [29] teal.widgets_0.4.2.9020     mime_0.12
 [31] lifecycle_1.0.4             iterators_1.0.14
 [33] pkgconfig_2.0.3             webshot2_0.1.1
 [35] Matrix_1.7-0                R6_2.5.1
 [37] fastmap_1.2.0               future_1.34.0
 [39] GenomeInfoDbData_1.2.12     rbibutils_2.2.16
 [41] clue_0.3-65                 digest_0.6.37
 [43] colorspace_2.1-1            shinycssloaders_1.1.0
 [45] ps_1.8.0                    AnnotationDbi_1.66.0
 [47] DESeq2_1.44.0               textshaping_0.4.0
 [49] RSQLite_2.3.7               filelock_1.0.3
 [51] labeling_0.4.3              fansi_1.0.6
 [53] httr_1.4.7                  abind_1.4-8
 [55] compiler_4.4.1              bit64_4.0.5
 [57] withr_3.0.1                 doParallel_1.0.17
 [59] backports_1.5.0             BiocParallel_1.38.0
 [61] DBI_1.2.3                   logger_0.3.0
 [63] biomaRt_2.60.1              rappdirs_0.3.3
 [65] DelayedArray_0.30.1         rjson_0.2.22
 [67] chromote_0.3.1              tools_4.4.1
 [69] httpuv_1.6.15               glue_1.7.0
 [71] callr_3.7.6                 promises_1.3.0
 [73] grid_4.4.1                  checkmate_2.3.2
 [75] cluster_2.1.6               generics_0.1.3
 [77] gtable_0.3.5                websocket_1.4.2
 [79] tidyr_1.3.1                 hms_1.1.3
 [81] xml2_1.3.6                  utf8_1.2.4
 [83] XVector_0.44.0              foreach_1.5.2
 [85] pillar_1.9.0                stringr_1.5.1
 [87] limma_3.60.4                later_1.3.2
 [89] circlize_0.4.16             dplyr_1.1.4
 [91] BiocFileCache_2.12.0        lattice_0.22-6
 [93] bit_4.0.5                   tidyselect_1.2.1
 [95] ComplexHeatmap_2.20.0       locfit_1.5-9.10
 [97] Biostrings_2.72.1           knitr_1.48
 [99] gridExtra_2.3               teal.logger_0.2.0.9009
[101] edgeR_4.2.1                 xfun_0.47
[103] statmod_1.5.0               brio_1.1.5
[105] stringi_1.8.4               UCSC.utils_1.0.0
[107] yaml_2.3.10                 shinyWidgets_0.8.6
[109] evaluate_0.24.0             codetools_0.2-20
[111] tibble_3.2.1                cli_3.6.3
[113] systemfonts_1.1.0           xtable_1.8-4
[115] Rdpack_2.6.1                jquerylib_0.1.4
[117] processx_3.8.4              munsell_0.5.1
[119] teal.reporter_0.3.1.9015    Rcpp_1.0.13
[121] globals_0.16.3              EnvStats_3.0.0
[123] dbplyr_2.5.0                png_0.1-8
[125] parallel_4.4.1              assertthat_0.2.1
[127] blob_1.2.4                  prettyunits_1.2.0
[129] listenv_0.9.1               scales_1.3.0
[131] purrr_1.0.2                 crayon_1.5.3
[133] GetoptLong_1.0.5            rlang_1.1.4
[135] formatR_1.14                KEGGREST_1.44.1
[137] shinyjs_2.1.0
Reuse
Copyright 2023, Hoffmann-La Roche Ltd.