KG3
Kaplan-Meier Graphs by Biomarker Subgroups
KG
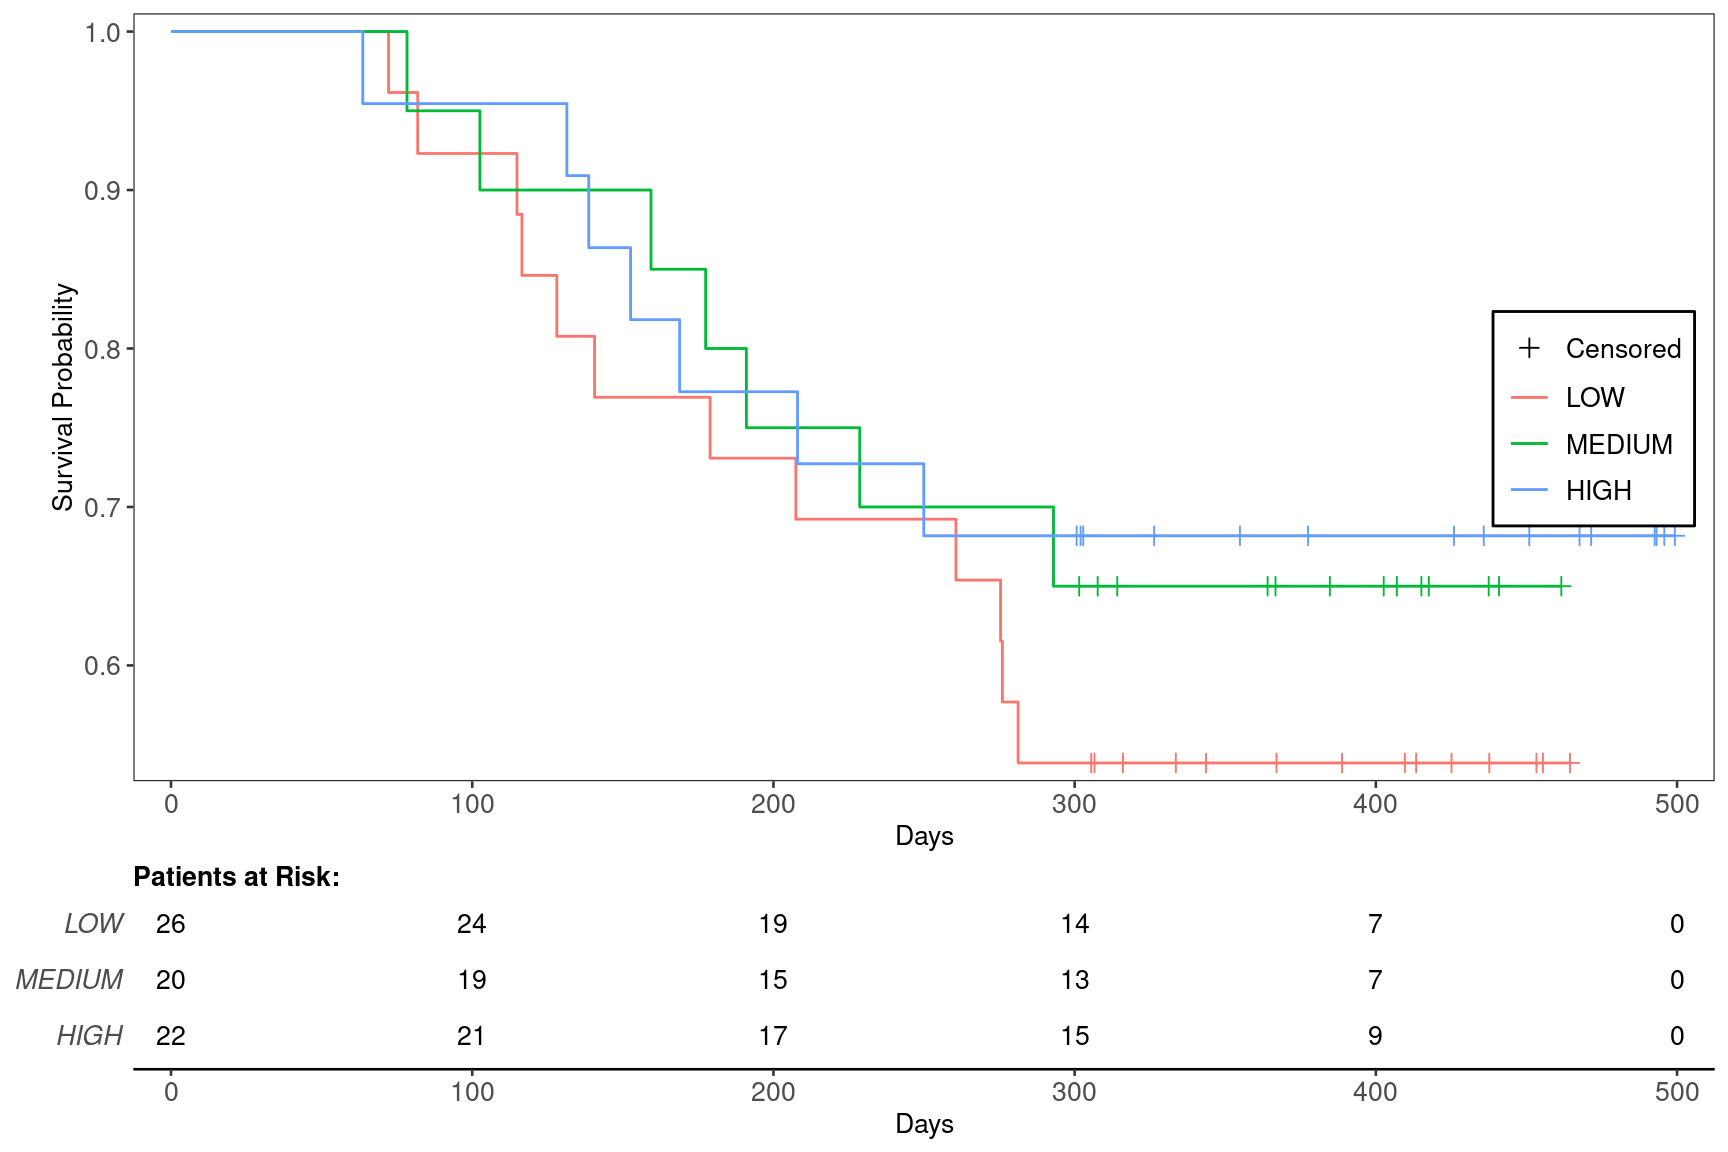
The same data set as in KG1A is used. The difference is that here we use the categorical biomarker variable BMRKR2 as the treatment arm in variables which is then used by g_km() below.
We can produce the basic plot using the g_km() function from tern.
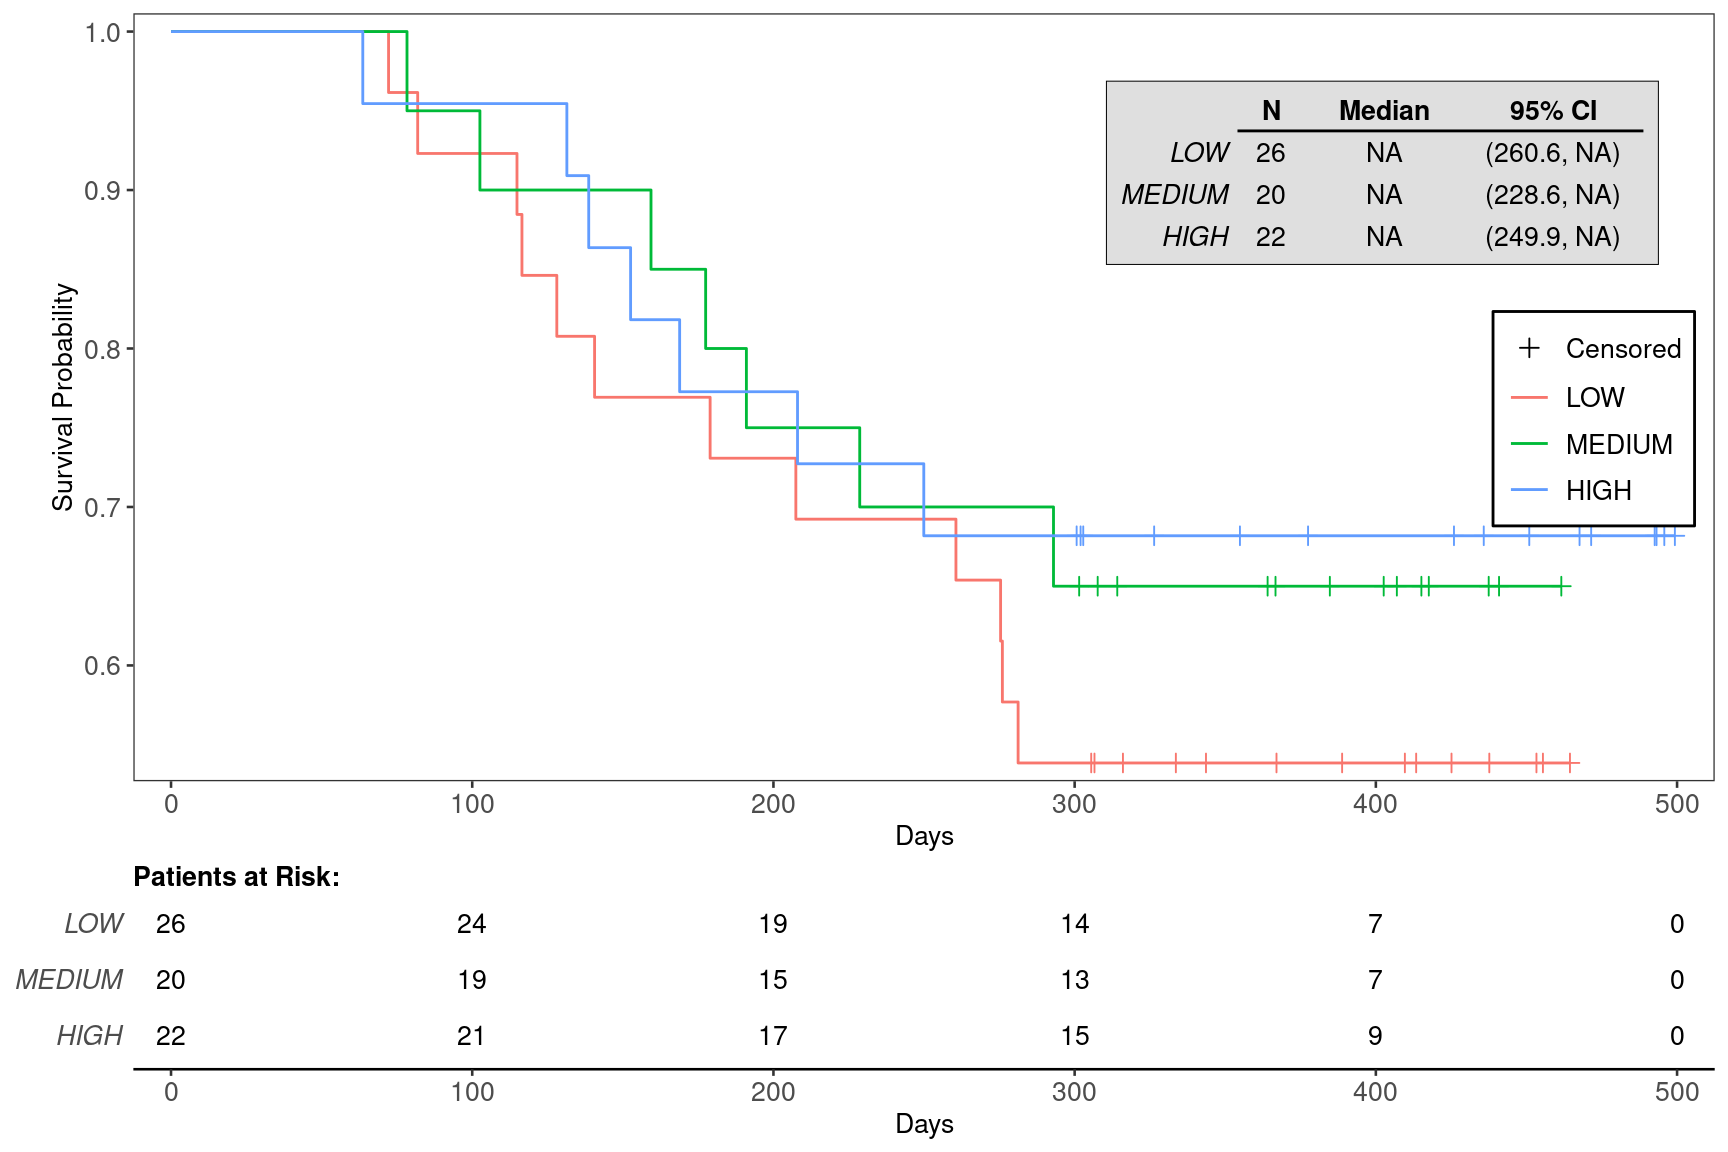
We can also choose to annotate the plot with the median survival time for each of the biomarker subgroups using the annot_surv_med = TRUE option.
R version 4.4.1 (2024-06-14)
Platform: x86_64-pc-linux-gnu
Running under: Ubuntu 22.04.4 LTS

Matrix products: default
BLAS:   /usr/lib/x86_64-linux-gnu/openblas-pthread/libblas.so.3
LAPACK: /usr/lib/x86_64-linux-gnu/openblas-pthread/libopenblasp-r0.3.20.so;  LAPACK version 3.10.0

locale:
 [1] LC_CTYPE=en_US.UTF-8       LC_NUMERIC=C
 [3] LC_TIME=en_US.UTF-8        LC_COLLATE=en_US.UTF-8
 [5] LC_MONETARY=en_US.UTF-8    LC_MESSAGES=en_US.UTF-8
 [7] LC_PAPER=en_US.UTF-8       LC_NAME=C
 [9] LC_ADDRESS=C               LC_TELEPHONE=C
[11] LC_MEASUREMENT=en_US.UTF-8 LC_IDENTIFICATION=C

time zone: Etc/UTC
tzcode source: system (glibc)

attached base packages:
[1] stats     graphics  grDevices utils     datasets  methods   base

other attached packages:
[1] dplyr_1.1.4           tern_0.9.5.9022       rtables_0.6.9.9014
[4] magrittr_2.0.3        formatters_0.5.9.9001

loaded via a namespace (and not attached):
 [1] Matrix_1.7-0                  gtable_0.3.5
 [3] jsonlite_1.8.8                compiler_4.4.1
 [5] tidyselect_1.2.1              stringr_1.5.1
 [7] tidyr_1.3.1                   splines_4.4.1
 [9] scales_1.3.0                  yaml_2.3.10
[11] fastmap_1.2.0                 lattice_0.22-6
[13] ggplot2_3.5.1                 R6_2.5.1
[15] labeling_0.4.3                generics_0.1.3
[17] knitr_1.48                    forcats_1.0.0
[19] rbibutils_2.2.16              htmlwidgets_1.6.4
[21] backports_1.5.0               checkmate_2.3.2
[23] tibble_3.2.1                  munsell_0.5.1
[25] pillar_1.9.0                  rlang_1.1.4
[27] utf8_1.2.4                    broom_1.0.6
[29] stringi_1.8.4                 xfun_0.47
[31] cli_3.6.3                     withr_3.0.1
[33] Rdpack_2.6.1                  digest_0.6.37
[35] grid_4.4.1                    cowplot_1.1.3
[37] lifecycle_1.0.4               vctrs_0.6.5
[39] evaluate_0.24.0               glue_1.7.0
[41] farver_2.1.2                  codetools_0.2-20
[43] survival_3.7-0                random.cdisc.data_0.3.15.9009
[45] fansi_1.0.6                   colorspace_2.1-1
[47] purrr_1.0.2                   rmarkdown_2.28
[49] tools_4.4.1                   pkgconfig_2.0.3
[51] htmltools_0.5.8.1
Reuse
Copyright 2023, Hoffmann-La Roche Ltd.