GENERAL
General Concepts
chevron is a collection of functions to creates tables,
listings, and graphs following Roche standards for clinical trials
reporting. After loading the R packages and the trial data, the output
is to be created by the main function run(...) . Two
arguments object= and adam_db= are always
expected in the function. object= specifies which Roche
Standard Template ID to use. adam_db= specifies the input
dataset. Other mandatory and optional arguments within the
run function vary depending on which template ID is called.
To access which arguments are required and what functions are used in
each template, simply try ?template
(e.g. ?aet01) to see more detailed descriptions and
instructions.
1. Input dataset and dataset names
The input dataset expected by the argument adam_db= in
the run(...) function is a collection of ADaM
datasets as a list object. Each ADaM dataset is expected to
be an object of data frame. If the ADaM datasets are read
in individually, user will need to combine them into a list object and
provide the name of the list to adam_db=. Also, each
element in the list are expected to have corresponding ADaM
dataset names. Conventional ADaM dataset names, including
adsl,adex, adae,
adlb,advs,adeg,adcm,admh,adrs,
and adtte, can be picked up by chevron with
one exception.
2. Expected variables in input analysis dataset
By default, chevron does not pull any subject-level
information from either adsl or adsub and
merge into the analysis dataset in the underlying preprocessing steps.
The analysis dataset fed into adam_db= is expected to have
all variables required for analysis available.
3. Character vs Factor
In the output generation, we often need to specify a particular
sorting order of a variable at the time of display. In
chevron, a character variable needs to be factorized with
pre-specified levels to display in order. When encountering cases, for
instance, "ARM A" has an Asian group only while
"ARM B" has both Asian and White groups, it is not able to
produce outputs like the demographic table unless "RACE" is
factorized to provide access to the same level attribute of the variable
"RACE" after the arm split. It is noted that the feature
comes from rtables instead of chevron.
proc_data <- syn_data
proc_data$adsl <- proc_data$adsl %>%
  mutate(RACE = case_when(
    ARMCD == "ARM A" ~ "ASIAN",
    ARMCD == "ARM B" & !.data$RACE %in% c("WHITE", "ASIAN") ~ "ASIAN",
    TRUE ~ RACE
  ))
Having "RACE" as a character variable rather than a
factor leads to error message showing up as “Error: Error applying
analysis function (var - RACE): Number of rows generated by analysis
function do not match across all columns,” and it is recommended to
convert analysis variable "RACE" to a factor.
run(dmt01, proc_data)To resolve this issue, simply try factorizing the variable
"RACE":
proc_data$adsl$RACE <- as.factor(proc_data$adsl$RACE)
run(dmt01, proc_data)
#>                                         A: Drug X    B: Placebo    C: Combination   All Patients
#>                                          (N=134)       (N=134)        (N=132)         (N=400)
#>   ——————————————————————————————————————————————————————————————————————————————————————————————
#>   Age (yr)
#>     n                                      134           134            132             400
#>     Mean (SD)                          33.8 (6.6)    35.4 (7.9)      35.4 (7.7)      34.9 (7.4)
#>     Median                                33.0          35.0            35.0            34.0
#>     Min - Max                            21 - 50       21 - 62        20 - 69         20 - 69
#>   Age Group
#>     n                                      134           134            132             400
#>     <65                                134 (100%)    134 (100%)     131 (99.2%)     399 (99.8%)
#>     >=65                                    0             0           1 (0.8%)        1 (0.2%)
#>   Sex
#>     n                                      134           134            132             400
#>     Male                               55 (41.0%)    52 (38.8%)      62 (47.0%)     169 (42.2%)
#>     Female                             79 (59.0%)    82 (61.2%)      70 (53.0%)     231 (57.8%)
#>   Ethnicity
#>     n                                      134           134            132             400
#>     NOT REPORTED                        6 (4.5%)      10 (7.5%)      11 (8.3%)       27 (6.8%)
#>     HISPANIC OR LATINO                 15 (11.2%)    18 (13.4%)      15 (11.4%)      48 (12.0%)
#>     NOT HISPANIC OR LATINO             104 (77.6%)   103 (76.9%)    101 (76.5%)     308 (77.0%)
#>     UNKNOWN                             9 (6.7%)      3 (2.2%)        5 (3.8%)       17 (4.2%)
#>   RACE
#>     n                                      134           134            132             400
#>     AMERICAN INDIAN OR ALASKA NATIVE        0             0           6 (4.5%)        6 (1.5%)
#>     ASIAN                              134 (100%)    107 (79.9%)     73 (55.3%)     314 (78.5%)
#>     BLACK OR AFRICAN AMERICAN               0             0          32 (24.2%)      32 (8.0%)
#>     WHITE                                   0        27 (20.1%)      21 (15.9%)      48 (12.0%)
4. Testing the codes for plot generation
The run function when calling a Graphics Template ID
returns a gTree object which will be used in the downstream
workflow for output generation. There are two alternative approaches to
rendering the plot: (1) having draw = TRUE in the
run function to enable the generated plot to be
automatically created and viewed via the Plots tab, and (2)
calling the function grid.draw from the package
grid which can be utilized to render the plot for viewing
and testing purpose. See example below:
proc_data <- log_filter(syn_data, PARAMCD == "OS", "adtte")

# method 1
run(kmg01, proc_data, dataset = "adtte", draw = TRUE)

# method 2
res <- run(kmg01, proc_data, dataset = "adtte")
grid::grid.newpage()
grid::grid.draw(res)
General Control Arguments
1. lbl_overall: Column of Total
The generic argument lbl_overall controls whether the
column of total will be produced or not. lbl_overall = NULL
suppresses the total, lbl_overall = "All Patients" produces
the total.
2. Column counts: N=xxx
Column counts are displayed by default. There is no generic argument
controlling whether the count of unique number of subjects (N=xxx) will
be displayed in the column header or not. Users are allowed to customize
the display of N=xxx by forcing
display_columncounts = FALSE to wipe column counts away
during the postprocessing (with precautions and it is not
recommended).
tbl <- run(dmt01, syn_data) # table with column counts
tbl@col_info@display_columncounts <- FALSE
tbl # no column counts now
#>                                         A: Drug X    B: Placebo    C: Combination   All Patients
#>   ——————————————————————————————————————————————————————————————————————————————————————————————
#>   Age (yr)
#>     n                                      134           134            132             400
#>     Mean (SD)                          33.8 (6.6)    35.4 (7.9)      35.4 (7.7)      34.9 (7.4)
#>     Median                                33.0          35.0            35.0            34.0
#>     Min - Max                            21 - 50       21 - 62        20 - 69         20 - 69
#>   Age Group
#>     n                                      134           134            132             400
#>     <65                                134 (100%)    134 (100%)     131 (99.2%)     399 (99.8%)
#>     >=65                                    0             0           1 (0.8%)        1 (0.2%)
#>   Sex
#>     n                                      134           134            132             400
#>     Male                               55 (41.0%)    52 (38.8%)      62 (47.0%)     169 (42.2%)
#>     Female                             79 (59.0%)    82 (61.2%)      70 (53.0%)     231 (57.8%)
#>   Ethnicity
#>     n                                      134           134            132             400
#>     NOT REPORTED                        6 (4.5%)      10 (7.5%)      11 (8.3%)       27 (6.8%)
#>     HISPANIC OR LATINO                 15 (11.2%)    18 (13.4%)      15 (11.4%)      48 (12.0%)
#>     NOT HISPANIC OR LATINO             104 (77.6%)   103 (76.9%)    101 (76.5%)     308 (77.0%)
#>     UNKNOWN                             9 (6.7%)      3 (2.2%)        5 (3.8%)       17 (4.2%)
#>   RACE
#>     n                                      134           134            132             400
#>     AMERICAN INDIAN OR ALASKA NATIVE    8 (6.0%)      11 (8.2%)       6 (4.5%)       25 (6.2%)
#>     ASIAN                              68 (50.7%)    68 (50.7%)      73 (55.3%)     209 (52.2%)
#>     BLACK OR AFRICAN AMERICAN          31 (23.1%)    28 (20.9%)      32 (24.2%)      91 (22.8%)
#>     WHITE                              27 (20.1%)    27 (20.1%)      21 (15.9%)      75 (18.8%)
TABLES
Safety Summary (AET01)
1. Safety Summary
The aet01 template produces the
standard safety summary.
run(aet01, syn_data, arm_var = "ARM")
#>                                                                 A: Drug X    B: Placebo    C: Combination
#>                                                                  (N=134)       (N=134)        (N=132)
#>   ———————————————————————————————————————————————————————————————————————————————————————————————————————
#>   Total number of patients with at least one AE                122 (91.0%)   123 (91.8%)    120 (90.9%)
#>   Total number of AEs                                              609           622            703
#>   Total number of deaths                                       25 (18.7%)    23 (17.2%)      22 (16.7%)
#>   Total number of patients withdrawn from study due to an AE    3 (2.2%)      6 (4.5%)        5 (3.8%)
#>   Total number of patients with at least one
#>     AE with fatal outcome                                      76 (56.7%)    70 (52.2%)      75 (56.8%)
#>     Serious AE                                                 104 (77.6%)   101 (75.4%)     99 (75.0%)
#>     Serious AE leading to withdrawal from treatment             9 (6.7%)      6 (4.5%)       11 (8.3%)
#>     Serious AE leading to dose modification/interruption       22 (16.4%)    26 (19.4%)      29 (22.0%)
#>     Related Serious AE                                         76 (56.7%)    70 (52.2%)      75 (56.8%)
#>     AE leading to withdrawal from treatment                    27 (20.1%)    26 (19.4%)      30 (22.7%)
#>     AE leading to dose modification/interruption               66 (49.3%)    76 (56.7%)      74 (56.1%)
#>     Related AE                                                 105 (78.4%)   108 (80.6%)    109 (82.6%)
#>     Related AE leading to withdrawal from treatment             6 (4.5%)      12 (9.0%)       8 (6.1%)
#>     Related AE leading to dose modification/interruption       29 (21.6%)    38 (28.4%)      38 (28.8%)
#>     Severe AE (at greatest intensity)                          91 (67.9%)    90 (67.2%)      93 (70.5%)
2. Safety Summary with Modified Rows
Analyses under “Total number of patients with at least one” can be
removed, added, or modified by editing the parameter
anl_vars. An analysis here is an abbreviated name of the
analysis of interest, and supported by a variable in ADAE
derived under the condition of interest. The defined analyses currently
include "FATAL", "SER", "SERWD",
"SERDSM", "RELSER", "WD",
"DSM", "REL", "RELWD",
"RELDSM", and "SEV". When modification is
made, analyses must all be listed in the argument anl_vars.
The example below shows adding the customized analysis
"RELCTC35".
proc_data <- syn_data
proc_data$adae <- proc_data$adae %>%
  filter(.data$ANL01FL == "Y") %>%
  mutate(
    FATAL = with_label(.data$AESDTH == "Y", "AE with fatal outcome"),
    SER = with_label(.data$AESER == "Y", "Serious AE"),
    SEV = with_label(.data$ASEV == "SEVERE", "Severe AE (at greatest intensity)"),
    REL = with_label(.data$AREL == "Y", "Related AE"),
    WD = with_label(.data$AEACN == "DRUG WITHDRAWN", "AE leading to withdrawal from treatment"),
    DSM = with_label(
      .data$AEACN %in% c("DRUG INTERRUPTED", "DOSE INCREASED", "DOSE REDUCED"),
      "AE leading to dose modification/interruption"
    ),
    SERWD = with_label(.data$SER & .data$WD, "Serious AE leading to withdrawal from treatment"),
    SERDSM = with_label(.data$SER & .data$DSM, "Serious AE leading to dose modification/interruption"),
    RELSER = with_label(.data$SER & .data$REL, "Related Serious AE"),
    RELWD = with_label(.data$REL & .data$WD, "Related AE leading to withdrawal from treatment"),
    RELDSM = with_label(.data$REL & .data$DSM, "Related AE leading to dose modification/interruption"),
    CTC35 = with_label(.data$ATOXGR %in% c("3", "4", "5"), "Grade 3-5 AE"),
    CTC45 = with_label(.data$ATOXGR %in% c("4", "5"), "Grade 4/5 AE"),
    RELCTC35 = with_label(.data$ATOXGR %in% c("3", "4", "5") & .data$AEREL == "Y", "Related Grade 3-5")
  )

proc_data$adsl <- proc_data$adsl %>%
  mutate(DCSREAS = reformat(.data$DCSREAS, missing_rule))

run(aet01, proc_data, anl_vars = list(safety_var = c("FATAL", "SER", "RELSER", "RELCTC35")), auto_pre = FALSE)
#>                                                                 A: Drug X    B: Placebo    C: Combination
#>                                                                  (N=134)       (N=134)        (N=132)
#>   ———————————————————————————————————————————————————————————————————————————————————————————————————————
#>   Total number of patients with at least one AE                122 (91.0%)   123 (91.8%)    120 (90.9%)
#>   Total number of AEs                                              609           622            703
#>   Total number of deaths                                       25 (18.7%)    23 (17.2%)      22 (16.7%)
#>   Total number of patients withdrawn from study due to an AE    3 (2.2%)      6 (4.5%)        5 (3.8%)
#>   Total number of patients with at least one
#>     AE with fatal outcome                                      76 (56.7%)    70 (52.2%)      75 (56.8%)
#>     Serious AE                                                 104 (77.6%)   101 (75.4%)     99 (75.0%)
#>     Related Serious AE                                         76 (56.7%)    70 (52.2%)      75 (56.8%)
#>     Related Grade 3-5                                          91 (67.9%)    90 (67.2%)      93 (70.5%)
Safety Summary (Adverse Events of Special Interest)
(AET01_AESI)
1. Safety Summary (Adverse Events of Special Interest)
The aet01_aesi template produces the
standard safety summary for adverse events of special interest.
run(aet01_aesi, syn_data)
#>                                                                                    A: Drug X    B: Placebo    C: Combination
#>                                                                                     (N=134)       (N=134)        (N=132)
#>   ——————————————————————————————————————————————————————————————————————————————————————————————————————————————————————————
#>   Total number of patients with at least one AE                                   122 (91.0%)   123 (91.8%)    120 (90.9%)
#>   Total number of AEs                                                                 609           622            703
#>   Total number of patients with at least one AE by worst grade
#>     Grade 1                                                                        7 (5.2%)      9 (6.7%)        4 (3.0%)
#>     Grade 2                                                                        6 (4.5%)      10 (7.5%)       7 (5.3%)
#>     Grade 3                                                                       18 (13.4%)    14 (10.4%)      16 (12.1%)
#>     Grade 4                                                                       15 (11.2%)    20 (14.9%)      18 (13.6%)
#>     Grade 5 (fatal outcome)                                                       76 (56.7%)    70 (52.2%)      75 (56.8%)
#>   Total number of patients with study drug withdrawn due to AE                    27 (20.1%)    26 (19.4%)      30 (22.7%)
#>   Total number of patients with dose modified/interrupted due to AE               66 (49.3%)    76 (56.7%)      74 (56.1%)
#>   Total number of patients with treatment received for AE                         98 (73.1%)    102 (76.1%)    103 (78.0%)
#>   Total number of patients with all non-fatal AEs resolved                        84 (62.7%)    92 (68.7%)      97 (73.5%)
#>   Total number of patients with at least one unresolved or ongoing non-fatal AE   102 (76.1%)   110 (82.1%)    107 (81.1%)
#>   Total number of patients with at least one serious AE                           104 (77.6%)   101 (75.4%)     99 (75.0%)
#>   Total number of patients with at least one related AE                           105 (78.4%)   108 (80.6%)    109 (82.6%)
2. Safety Summary (Adverse Events of Special Interest) (optional lines)
Additional analyses can be added with the argument
aesi_vars, please type ?aet01_aesi in console
to find out the list of all pre-defined optional analyses in the
HELP.
run(aet01_aesi, syn_data, aesi_vars = c("RESLWD", "RELSER"))
#>                                                                                    A: Drug X    B: Placebo    C: Combination
#>                                                                                     (N=134)       (N=134)        (N=132)
#>   ——————————————————————————————————————————————————————————————————————————————————————————————————————————————————————————
#>   Total number of patients with at least one AE                                   122 (91.0%)   123 (91.8%)    120 (90.9%)
#>   Total number of AEs                                                                 609           622            703
#>   Total number of patients with at least one AE by worst grade
#>     Grade 1                                                                        7 (5.2%)      9 (6.7%)        4 (3.0%)
#>     Grade 2                                                                        6 (4.5%)      10 (7.5%)       7 (5.3%)
#>     Grade 3                                                                       18 (13.4%)    14 (10.4%)      16 (12.1%)
#>     Grade 4                                                                       15 (11.2%)    20 (14.9%)      18 (13.6%)
#>     Grade 5 (fatal outcome)                                                       76 (56.7%)    70 (52.2%)      75 (56.8%)
#>   Total number of patients with study drug withdrawn due to AE                    27 (20.1%)    26 (19.4%)      30 (22.7%)
#>   Total number of patients with dose modified/interrupted due to AE               66 (49.3%)    76 (56.7%)      74 (56.1%)
#>   Total number of patients with treatment received for AE                         98 (73.1%)    102 (76.1%)    103 (78.0%)
#>   Total number of patients with all non-fatal AEs resolved                        84 (62.7%)    92 (68.7%)      97 (73.5%)
#>   Total number of patients with at least one unresolved or ongoing non-fatal AE   102 (76.1%)   110 (82.1%)    107 (81.1%)
#>   Total number of patients with at least one serious AE                           104 (77.6%)   101 (75.4%)     99 (75.0%)
#>   Total number of patients with at least one related AE                           105 (78.4%)   108 (80.6%)    109 (82.6%)
#>     No. of patients with serious, related AE                                      76 (56.7%)    70 (52.2%)      75 (56.8%)
Adverse Events (AET02)
1. Adverse Events
- The template
aet02produces the standard adverse event summary by MedDRA system organ class and preferred term. - The template does not include the column of total as default. The
‘All Patients’ column can be added with the argument
lbl_overall = "All Patients". - Missing values in
"AEBODSYS", and"AEDECOD"are labeled asNo Coding Available.
run(aet02, syn_data)
#>   MedDRA System Organ Class                                     A: Drug X    B: Placebo    C: Combination
#>     MedDRA Preferred Term                                        (N=134)       (N=134)        (N=132)
#>   ———————————————————————————————————————————————————————————————————————————————————————————————————————
#>   Total number of patients with at least one adverse event     122 (91.0%)   123 (91.8%)    120 (90.9%)
#>   Overall total number of events                                   609           622            703
#>   cl A.1
#>     Total number of patients with at least one adverse event   78 (58.2%)    75 (56.0%)      89 (67.4%)
#>     Total number of events                                         132           130            160
#>     dcd A.1.1.1.1                                              50 (37.3%)    45 (33.6%)      63 (47.7%)
#>     dcd A.1.1.1.2                                              48 (35.8%)    48 (35.8%)      50 (37.9%)
#>   cl B.2
#>     Total number of patients with at least one adverse event   79 (59.0%)    74 (55.2%)      85 (64.4%)
#>     Total number of events                                         129           138            143
#>     dcd B.2.2.3.1                                              48 (35.8%)    54 (40.3%)      51 (38.6%)
#>     dcd B.2.1.2.1                                              49 (36.6%)    44 (32.8%)      52 (39.4%)
#>   cl D.1
#>     Total number of patients with at least one adverse event   79 (59.0%)    67 (50.0%)      80 (60.6%)
#>     Total number of events                                         127           106            135
#>     dcd D.1.1.1.1                                              50 (37.3%)    42 (31.3%)      51 (38.6%)
#>     dcd D.1.1.4.2                                              48 (35.8%)    42 (31.3%)      50 (37.9%)
#>   cl D.2
#>     Total number of patients with at least one adverse event   47 (35.1%)    58 (43.3%)      57 (43.2%)
#>     Total number of events                                         62            72              74
#>     dcd D.2.1.5.3                                              47 (35.1%)    58 (43.3%)      57 (43.2%)
#>   cl B.1
#>     Total number of patients with at least one adverse event   47 (35.1%)    49 (36.6%)      43 (32.6%)
#>     Total number of events                                         56            60              62
#>     dcd B.1.1.1.1                                              47 (35.1%)    49 (36.6%)      43 (32.6%)
#>   cl C.2
#>     Total number of patients with at least one adverse event   35 (26.1%)    48 (35.8%)      55 (41.7%)
#>     Total number of events                                         48            53              65
#>     dcd C.2.1.2.1                                              35 (26.1%)    48 (35.8%)      55 (41.7%)
#>   cl C.1
#>     Total number of patients with at least one adverse event   43 (32.1%)    46 (34.3%)      43 (32.6%)
#>     Total number of events                                         55            63              64
#>     dcd C.1.1.1.3                                              43 (32.1%)    46 (34.3%)      43 (32.6%)
2. Adverse Events (with High-level Term)
The syntax below displays adverse events by MedDRA system organ class, high-level term and preferred term.
run(aet02, syn_data, row_split_var = c("AEBODSYS", "AEHLT"))
#>   MedDRA System Organ Class
#>     High Level Term                                               A: Drug X    B: Placebo    C: Combination
#>       MedDRA Preferred Term                                        (N=134)       (N=134)        (N=132)
#>   —————————————————————————————————————————————————————————————————————————————————————————————————————————
#>   Total number of patients with at least one adverse event       122 (91.0%)   123 (91.8%)    120 (90.9%)
#>   Overall total number of events                                     609           622            703
#>   cl A.1
#>     Total number of patients with at least one adverse event     78 (58.2%)    75 (56.0%)      89 (67.4%)
#>     Total number of events                                           132           130            160
#>     hlt A.1.1.1
#>       Total number of patients with at least one adverse event   78 (58.2%)    75 (56.0%)      89 (67.4%)
#>       Total number of events                                         132           130            160
#>       dcd A.1.1.1.1                                              50 (37.3%)    45 (33.6%)      63 (47.7%)
#>       dcd A.1.1.1.2                                              48 (35.8%)    48 (35.8%)      50 (37.9%)
#>   cl B.2
#>     Total number of patients with at least one adverse event     79 (59.0%)    74 (55.2%)      85 (64.4%)
#>     Total number of events                                           129           138            143
#>     hlt B.2.2.3
#>       Total number of patients with at least one adverse event   48 (35.8%)    54 (40.3%)      51 (38.6%)
#>       Total number of events                                         64            76              77
#>       dcd B.2.2.3.1                                              48 (35.8%)    54 (40.3%)      51 (38.6%)
#>     hlt B.2.1.2
#>       Total number of patients with at least one adverse event   49 (36.6%)    44 (32.8%)      52 (39.4%)
#>       Total number of events                                         65            62              66
#>       dcd B.2.1.2.1                                              49 (36.6%)    44 (32.8%)      52 (39.4%)
#>   cl D.1
#>     Total number of patients with at least one adverse event     79 (59.0%)    67 (50.0%)      80 (60.6%)
#>     Total number of events                                           127           106            135
#>     hlt D.1.1.1
#>       Total number of patients with at least one adverse event   50 (37.3%)    42 (31.3%)      51 (38.6%)
#>       Total number of events                                         61            51              71
#>       dcd D.1.1.1.1                                              50 (37.3%)    42 (31.3%)      51 (38.6%)
#>     hlt D.1.1.4
#>       Total number of patients with at least one adverse event   48 (35.8%)    42 (31.3%)      50 (37.9%)
#>       Total number of events                                         66            55              64
#>       dcd D.1.1.4.2                                              48 (35.8%)    42 (31.3%)      50 (37.9%)
#>   cl D.2
#>     Total number of patients with at least one adverse event     47 (35.1%)    58 (43.3%)      57 (43.2%)
#>     Total number of events                                           62            72              74
#>     hlt D.2.1.5
#>       Total number of patients with at least one adverse event   47 (35.1%)    58 (43.3%)      57 (43.2%)
#>       Total number of events                                         62            72              74
#>       dcd D.2.1.5.3                                              47 (35.1%)    58 (43.3%)      57 (43.2%)
#>   cl B.1
#>     Total number of patients with at least one adverse event     47 (35.1%)    49 (36.6%)      43 (32.6%)
#>     Total number of events                                           56            60              62
#>     hlt B.1.1.1
#>       Total number of patients with at least one adverse event   47 (35.1%)    49 (36.6%)      43 (32.6%)
#>       Total number of events                                         56            60              62
#>       dcd B.1.1.1.1                                              47 (35.1%)    49 (36.6%)      43 (32.6%)
#>   cl C.2
#>     Total number of patients with at least one adverse event     35 (26.1%)    48 (35.8%)      55 (41.7%)
#>     Total number of events                                           48            53              65
#>     hlt C.2.1.2
#>       Total number of patients with at least one adverse event   35 (26.1%)    48 (35.8%)      55 (41.7%)
#>       Total number of events                                         48            53              65
#>       dcd C.2.1.2.1                                              35 (26.1%)    48 (35.8%)      55 (41.7%)
#>   cl C.1
#>     Total number of patients with at least one adverse event     43 (32.1%)    46 (34.3%)      43 (32.6%)
#>     Total number of events                                           55            63              64
#>     hlt C.1.1.1
#>       Total number of patients with at least one adverse event   43 (32.1%)    46 (34.3%)      43 (32.6%)
#>       Total number of events                                         55            63              64
#>       dcd C.1.1.1.3                                              43 (32.1%)    46 (34.3%)      43 (32.6%)
3. Adverse Events (Preferred Terms only)
The syntax below displays adverse events by preferred term only.
run(aet02, syn_data, row_split_var = NULL)
#>                                                               A: Drug X    B: Placebo    C: Combination
#>   MedDRA Preferred Term                                        (N=134)       (N=134)        (N=132)
#>   —————————————————————————————————————————————————————————————————————————————————————————————————————
#>   Total number of patients with at least one adverse event   122 (91.0%)   123 (91.8%)    120 (90.9%)
#>   Overall total number of events                                 609           622            703
#>   dcd D.2.1.5.3                                              47 (35.1%)    58 (43.3%)      57 (43.2%)
#>   dcd A.1.1.1.1                                              50 (37.3%)    45 (33.6%)      63 (47.7%)
#>   dcd B.2.2.3.1                                              48 (35.8%)    54 (40.3%)      51 (38.6%)
#>   dcd A.1.1.1.2                                              48 (35.8%)    48 (35.8%)      50 (37.9%)
#>   dcd B.2.1.2.1                                              49 (36.6%)    44 (32.8%)      52 (39.4%)
#>   dcd D.1.1.1.1                                              50 (37.3%)    42 (31.3%)      51 (38.6%)
#>   dcd D.1.1.4.2                                              48 (35.8%)    42 (31.3%)      50 (37.9%)
#>   dcd B.1.1.1.1                                              47 (35.1%)    49 (36.6%)      43 (32.6%)
#>   dcd C.2.1.2.1                                              35 (26.1%)    48 (35.8%)      55 (41.7%)
#>   dcd C.1.1.1.3                                              43 (32.1%)    46 (34.3%)      43 (32.6%)
Adverse Events by Greatest
Intensity(AET03)
1. Adverse Events by Greatest Intensity
This aet03 template produces the
standard adverse event by greatest intensity summary
run(aet03, syn_data)
#>   MedDRA System Organ Class    A: Drug X    B: Placebo    C: Combination
#>     MedDRA Preferred Term       (N=134)       (N=134)        (N=132)
#>   ——————————————————————————————————————————————————————————————————————
#>   - Any Intensity -           122 (91.0%)   123 (91.8%)    120 (90.9%)
#>   MILD                         7 (5.2%)      9 (6.7%)        4 (3.0%)
#>   MODERATE                    24 (17.9%)    24 (17.9%)      23 (17.4%)
#>   SEVERE                      91 (67.9%)    90 (67.2%)      93 (70.5%)
#>   cl A.1
#>     - Any Intensity -         78 (58.2%)    75 (56.0%)      89 (67.4%)
#>     MILD                      30 (22.4%)    27 (20.1%)      39 (29.5%)
#>     MODERATE                  48 (35.8%)    48 (35.8%)      50 (37.9%)
#>     dcd A.1.1.1.1
#>       - Any Intensity -       50 (37.3%)    45 (33.6%)      63 (47.7%)
#>       MILD                    50 (37.3%)    45 (33.6%)      63 (47.7%)
#>     dcd A.1.1.1.2
#>       - Any Intensity -       48 (35.8%)    48 (35.8%)      50 (37.9%)
#>       MODERATE                48 (35.8%)    48 (35.8%)      50 (37.9%)
#>   cl B.2
#>     - Any Intensity -         79 (59.0%)    74 (55.2%)      85 (64.4%)
#>     MILD                      30 (22.4%)    30 (22.4%)      33 (25.0%)
#>     MODERATE                  49 (36.6%)    44 (32.8%)      52 (39.4%)
#>     dcd B.2.2.3.1
#>       - Any Intensity -       48 (35.8%)    54 (40.3%)      51 (38.6%)
#>       MILD                    48 (35.8%)    54 (40.3%)      51 (38.6%)
#>     dcd B.2.1.2.1
#>       - Any Intensity -       49 (36.6%)    44 (32.8%)      52 (39.4%)
#>       MODERATE                49 (36.6%)    44 (32.8%)      52 (39.4%)
#>   cl D.1
#>     - Any Intensity -         79 (59.0%)    67 (50.0%)      80 (60.6%)
#>     MODERATE                  29 (21.6%)    25 (18.7%)      29 (22.0%)
#>     SEVERE                    50 (37.3%)    42 (31.3%)      51 (38.6%)
#>     dcd D.1.1.1.1
#>       - Any Intensity -       50 (37.3%)    42 (31.3%)      51 (38.6%)
#>       SEVERE                  50 (37.3%)    42 (31.3%)      51 (38.6%)
#>     dcd D.1.1.4.2
#>       - Any Intensity -       48 (35.8%)    42 (31.3%)      50 (37.9%)
#>       MODERATE                48 (35.8%)    42 (31.3%)      50 (37.9%)
#>   cl D.2
#>     - Any Intensity -         47 (35.1%)    58 (43.3%)      57 (43.2%)
#>     MILD                      47 (35.1%)    58 (43.3%)      57 (43.2%)
#>     dcd D.2.1.5.3
#>       - Any Intensity -       47 (35.1%)    58 (43.3%)      57 (43.2%)
#>       MILD                    47 (35.1%)    58 (43.3%)      57 (43.2%)
#>   cl B.1
#>     - Any Intensity -         47 (35.1%)    49 (36.6%)      43 (32.6%)
#>     SEVERE                    47 (35.1%)    49 (36.6%)      43 (32.6%)
#>     dcd B.1.1.1.1
#>       - Any Intensity -       47 (35.1%)    49 (36.6%)      43 (32.6%)
#>       SEVERE                  47 (35.1%)    49 (36.6%)      43 (32.6%)
#>   cl C.2
#>     - Any Intensity -         35 (26.1%)    48 (35.8%)      55 (41.7%)
#>     MODERATE                  35 (26.1%)    48 (35.8%)      55 (41.7%)
#>     dcd C.2.1.2.1
#>       - Any Intensity -       35 (26.1%)    48 (35.8%)      55 (41.7%)
#>       MODERATE                35 (26.1%)    48 (35.8%)      55 (41.7%)
#>   cl C.1
#>     - Any Intensity -         43 (32.1%)    46 (34.3%)      43 (32.6%)
#>     SEVERE                    43 (32.1%)    46 (34.3%)      43 (32.6%)
#>     dcd C.1.1.1.3
#>       - Any Intensity -       43 (32.1%)    46 (34.3%)      43 (32.6%)
#>       SEVERE                  43 (32.1%)    46 (34.3%)      43 (32.6%)
Adverse Events by Highest NCI CTCAE Grade
(AET04)
1. Adverse Events by Highest NCI CTCAE
Grade
- The
aet04template produces the standard adverse event by highestNCI CTCAEgrade summary. - By default, this template includes the grouped grades of ‘Grade 1-2’ and ‘Grade 3-4’.
- By default this template removes the rows with 0 count.
- If a treatment group does not have any adverse event, the treatment
group is automatically displayed providing that it is defined in
ADSL.
run(aet04, syn_data)
#>   MedDRA System Organ Class
#>     MedDRA Preferred Term                      A: Drug X    B: Placebo    C: Combination
#>                               Grade             (N=134)       (N=134)        (N=132)
#>   ——————————————————————————————————————————————————————————————————————————————————————
#>   - Any adverse events -
#>                               - Any Grade -   122 (91.0%)   123 (91.8%)    120 (90.9%)
#>                               Grade 1-2        13 (9.7%)    19 (14.2%)      11 (8.3%)
#>                               1                7 (5.2%)      9 (6.7%)        4 (3.0%)
#>                               2                6 (4.5%)      10 (7.5%)       7 (5.3%)
#>                               Grade 3-4       33 (24.6%)    34 (25.4%)      34 (25.8%)
#>                               3               18 (13.4%)    14 (10.4%)      16 (12.1%)
#>                               4               15 (11.2%)    20 (14.9%)      18 (13.6%)
#>                               Grade 5         76 (56.7%)    70 (52.2%)      75 (56.8%)
#>   cl A.1
#>     - Overall -
#>                               - Any Grade -   78 (58.2%)    75 (56.0%)      89 (67.4%)
#>                               Grade 1-2       78 (58.2%)    75 (56.0%)      89 (67.4%)
#>                               1               30 (22.4%)    27 (20.1%)      39 (29.5%)
#>                               2               48 (35.8%)    48 (35.8%)      50 (37.9%)
#>     dcd A.1.1.1.1
#>                               - Any Grade -   50 (37.3%)    45 (33.6%)      63 (47.7%)
#>                               Grade 1-2       50 (37.3%)    45 (33.6%)      63 (47.7%)
#>                               1               50 (37.3%)    45 (33.6%)      63 (47.7%)
#>     dcd A.1.1.1.2
#>                               - Any Grade -   48 (35.8%)    48 (35.8%)      50 (37.9%)
#>                               Grade 1-2       48 (35.8%)    48 (35.8%)      50 (37.9%)
#>                               2               48 (35.8%)    48 (35.8%)      50 (37.9%)
#>   cl B.2
#>     - Overall -
#>                               - Any Grade -   79 (59.0%)    74 (55.2%)      85 (64.4%)
#>                               Grade 1-2       30 (22.4%)    30 (22.4%)      33 (25.0%)
#>                               1               30 (22.4%)    30 (22.4%)      33 (25.0%)
#>                               Grade 3-4       49 (36.6%)    44 (32.8%)      52 (39.4%)
#>                               3               49 (36.6%)    44 (32.8%)      52 (39.4%)
#>     dcd B.2.2.3.1
#>                               - Any Grade -   48 (35.8%)    54 (40.3%)      51 (38.6%)
#>                               Grade 1-2       48 (35.8%)    54 (40.3%)      51 (38.6%)
#>                               1               48 (35.8%)    54 (40.3%)      51 (38.6%)
#>     dcd B.2.1.2.1
#>                               - Any Grade -   49 (36.6%)    44 (32.8%)      52 (39.4%)
#>                               Grade 3-4       49 (36.6%)    44 (32.8%)      52 (39.4%)
#>                               3               49 (36.6%)    44 (32.8%)      52 (39.4%)
#>   cl D.1
#>     - Overall -
#>                               - Any Grade -   79 (59.0%)    67 (50.0%)      80 (60.6%)
#>                               Grade 3-4       29 (21.6%)    25 (18.7%)      29 (22.0%)
#>                               3               29 (21.6%)    25 (18.7%)      29 (22.0%)
#>                               Grade 5         50 (37.3%)    42 (31.3%)      51 (38.6%)
#>     dcd D.1.1.1.1
#>                               - Any Grade -   50 (37.3%)    42 (31.3%)      51 (38.6%)
#>                               Grade 5         50 (37.3%)    42 (31.3%)      51 (38.6%)
#>     dcd D.1.1.4.2
#>                               - Any Grade -   48 (35.8%)    42 (31.3%)      50 (37.9%)
#>                               Grade 3-4       48 (35.8%)    42 (31.3%)      50 (37.9%)
#>                               3               48 (35.8%)    42 (31.3%)      50 (37.9%)
#>   cl D.2
#>     - Overall -
#>                               - Any Grade -   47 (35.1%)    58 (43.3%)      57 (43.2%)
#>                               Grade 1-2       47 (35.1%)    58 (43.3%)      57 (43.2%)
#>                               1               47 (35.1%)    58 (43.3%)      57 (43.2%)
#>     dcd D.2.1.5.3
#>                               - Any Grade -   47 (35.1%)    58 (43.3%)      57 (43.2%)
#>                               Grade 1-2       47 (35.1%)    58 (43.3%)      57 (43.2%)
#>                               1               47 (35.1%)    58 (43.3%)      57 (43.2%)
#>   cl B.1
#>     - Overall -
#>                               - Any Grade -   47 (35.1%)    49 (36.6%)      43 (32.6%)
#>                               Grade 5         47 (35.1%)    49 (36.6%)      43 (32.6%)
#>     dcd B.1.1.1.1
#>                               - Any Grade -   47 (35.1%)    49 (36.6%)      43 (32.6%)
#>                               Grade 5         47 (35.1%)    49 (36.6%)      43 (32.6%)
#>   cl C.2
#>     - Overall -
#>                               - Any Grade -   35 (26.1%)    48 (35.8%)      55 (41.7%)
#>                               Grade 1-2       35 (26.1%)    48 (35.8%)      55 (41.7%)
#>                               2               35 (26.1%)    48 (35.8%)      55 (41.7%)
#>     dcd C.2.1.2.1
#>                               - Any Grade -   35 (26.1%)    48 (35.8%)      55 (41.7%)
#>                               Grade 1-2       35 (26.1%)    48 (35.8%)      55 (41.7%)
#>                               2               35 (26.1%)    48 (35.8%)      55 (41.7%)
#>   cl C.1
#>     - Overall -
#>                               - Any Grade -   43 (32.1%)    46 (34.3%)      43 (32.6%)
#>                               Grade 3-4       43 (32.1%)    46 (34.3%)      43 (32.6%)
#>                               4               43 (32.1%)    46 (34.3%)      43 (32.6%)
#>     dcd C.1.1.1.3
#>                               - Any Grade -   43 (32.1%)    46 (34.3%)      43 (32.6%)
#>                               Grade 3-4       43 (32.1%)    46 (34.3%)      43 (32.6%)
#>                               4               43 (32.1%)    46 (34.3%)      43 (32.6%)
2. Adverse Events by Highest NCI CTCAE Grade
(Fill in of Grades)
If, for some preferred terms, not all grades occur but all grades
should be displayed, this can be achieved by specifying the argument
prune_0 = FALSE.
run(aet04, syn_data, prune_0 = FALSE)
#> MedDRA System Organ Class
#> MedDRA Preferred Term A: Drug X B: Placebo C: Combination
#> Grade (N=134) (N=134) (N=132)
#> ——————————————————————————————————————————————————————————————————————————————————————
#> - Any adverse events -
#> - Any Grade - 122 (91.0%) 123 (91.8%) 120 (90.9%)
#> Grade 1-2 13 (9.7%) 19 (14.2%) 11 (8.3%)
#> 1 7 (5.2%) 9 (6.7%) 4 (3.0%)
#> 2 6 (4.5%) 10 (7.5%) 7 (5.3%)
#> Grade 3-4 33 (24.6%) 34 (25.4%) 34 (25.8%)
#> 3 18 (13.4%) 14 (10.4%) 16 (12.1%)
#> 4 15 (11.2%) 20 (14.9%) 18 (13.6%)
#> Grade 5 76 (56.7%) 70 (52.2%) 75 (56.8%)
#> cl A.1
#> - Overall -
#> - Any Grade - 78 (58.2%) 75 (56.0%) 89 (67.4%)
#> Grade 1-2 78 (58.2%) 75 (56.0%) 89 (67.4%)
#> 1 30 (22.4%) 27 (20.1%) 39 (29.5%)
#> 2 48 (35.8%) 48 (35.8%) 50 (37.9%)
#> Grade 3-4 0 0 0
#> 3 0 0 0
#> 4 0 0 0
#> Grade 5 0 0 0
#> dcd A.1.1.1.1
#> - Any Grade - 50 (37.3%) 45 (33.6%) 63 (47.7%)
#> Grade 1-2 50 (37.3%) 45 (33.6%) 63 (47.7%)
#> 1 50 (37.3%) 45 (33.6%) 63 (47.7%)
#> 2 0 0 0
#> Grade 3-4 0 0 0
#> 3 0 0 0
#> 4 0 0 0
#> Grade 5 0 0 0
#> dcd A.1.1.1.2
#> - Any Grade - 48 (35.8%) 48 (35.8%) 50 (37.9%)
#> Grade 1-2 48 (35.8%) 48 (35.8%) 50 (37.9%)
#> 1 0 0 0
#> 2 48 (35.8%) 48 (35.8%) 50 (37.9%)
#> Grade 3-4 0 0 0
#> 3 0 0 0
#> 4 0 0 0
#> Grade 5 0 0 0
#> cl B.2
#> - Overall -
#> - Any Grade - 79 (59.0%) 74 (55.2%) 85 (64.4%)
#> Grade 1-2 30 (22.4%) 30 (22.4%) 33 (25.0%)
#> 1 30 (22.4%) 30 (22.4%) 33 (25.0%)
#> 2 0 0 0
#> Grade 3-4 49 (36.6%) 44 (32.8%) 52 (39.4%)
#> 3 49 (36.6%) 44 (32.8%) 52 (39.4%)
#> 4 0 0 0
#> Grade 5 0 0 0
#> dcd B.2.2.3.1
#> - Any Grade - 48 (35.8%) 54 (40.3%) 51 (38.6%)
#> Grade 1-2 48 (35.8%) 54 (40.3%) 51 (38.6%)
#> 1 48 (35.8%) 54 (40.3%) 51 (38.6%)
#> 2 0 0 0
#> Grade 3-4 0 0 0
#> 3 0 0 0
#> 4 0 0 0
#> Grade 5 0 0 0
#> dcd B.2.1.2.1
#> - Any Grade - 49 (36.6%) 44 (32.8%) 52 (39.4%)
#> Grade 1-2 0 0 0
#> 1 0 0 0
#> 2 0 0 0
#> Grade 3-4 49 (36.6%) 44 (32.8%) 52 (39.4%)
#> 3 49 (36.6%) 44 (32.8%) 52 (39.4%)
#> 4 0 0 0
#> Grade 5 0 0 0
#> cl D.1
#> - Overall -
#> - Any Grade - 79 (59.0%) 67 (50.0%) 80 (60.6%)
#> Grade 1-2 0 0 0
#> 1 0 0 0
#> 2 0 0 0
#> Grade 3-4 29 (21.6%) 25 (18.7%) 29 (22.0%)
#> 3 29 (21.6%) 25 (18.7%) 29 (22.0%)
#> 4 0 0 0
#> Grade 5 50 (37.3%) 42 (31.3%) 51 (38.6%)
#> dcd D.1.1.1.1
#> - Any Grade - 50 (37.3%) 42 (31.3%) 51 (38.6%)
#> Grade 1-2 0 0 0
#> 1 0 0 0
#> 2 0 0 0
#> Grade 3-4 0 0 0
#> 3 0 0 0
#> 4 0 0 0
#> Grade 5 50 (37.3%) 42 (31.3%) 51 (38.6%)
#> dcd D.1.1.4.2
#> - Any Grade - 48 (35.8%) 42 (31.3%) 50 (37.9%)
#> Grade 1-2 0 0 0
#> 1 0 0 0
#> 2 0 0 0
#> Grade 3-4 48 (35.8%) 42 (31.3%) 50 (37.9%)
#> 3 48 (35.8%) 42 (31.3%) 50 (37.9%)
#> 4 0 0 0
#> Grade 5 0 0 0
#> cl D.2
#> - Overall -
#> - Any Grade - 47 (35.1%) 58 (43.3%) 57 (43.2%)
#> Grade 1-2 47 (35.1%) 58 (43.3%) 57 (43.2%)
#> 1 47 (35.1%) 58 (43.3%) 57 (43.2%)
#> 2 0 0 0
#> Grade 3-4 0 0 0
#> 3 0 0 0
#> 4 0 0 0
#> Grade 5 0 0 0
#> dcd D.2.1.5.3
#> - Any Grade - 47 (35.1%) 58 (43.3%) 57 (43.2%)
#> Grade 1-2 47 (35.1%) 58 (43.3%) 57 (43.2%)
#> 1 47 (35.1%) 58 (43.3%) 57 (43.2%)
#> 2 0 0 0
#> Grade 3-4 0 0 0
#> 3 0 0 0
#> 4 0 0 0
#> Grade 5 0 0 0
#> cl B.1
#> - Overall -
#> - Any Grade - 47 (35.1%) 49 (36.6%) 43 (32.6%)
#> Grade 1-2 0 0 0
#> 1 0 0 0
#> 2 0 0 0
#> Grade 3-4 0 0 0
#> 3 0 0 0
#> 4 0 0 0
#> Grade 5 47 (35.1%) 49 (36.6%) 43 (32.6%)
#> dcd B.1.1.1.1
#> - Any Grade - 47 (35.1%) 49 (36.6%) 43 (32.6%)
#> Grade 1-2 0 0 0
#> 1 0 0 0
#> 2 0 0 0
#> Grade 3-4 0 0 0
#> 3 0 0 0
#> 4 0 0 0
#> Grade 5 47 (35.1%) 49 (36.6%) 43 (32.6%)
#> cl C.2
#> - Overall -
#> - Any Grade - 35 (26.1%) 48 (35.8%) 55 (41.7%)
#> Grade 1-2 35 (26.1%) 48 (35.8%) 55 (41.7%)
#> 1 0 0 0
#> 2 35 (26.1%) 48 (35.8%) 55 (41.7%)
#> Grade 3-4 0 0 0
#> 3 0 0 0
#> 4 0 0 0
#> Grade 5 0 0 0
#> dcd C.2.1.2.1
#> - Any Grade - 35 (26.1%) 48 (35.8%) 55 (41.7%)
#> Grade 1-2 35 (26.1%) 48 (35.8%) 55 (41.7%)
#> 1 0 0 0
#> 2 35 (26.1%) 48 (35.8%) 55 (41.7%)
#> Grade 3-4 0 0 0
#> 3 0 0 0
#> 4 0 0 0
#> Grade 5 0 0 0
#> cl C.1
#> - Overall -
#> - Any Grade - 43 (32.1%) 46 (34.3%) 43 (32.6%)
#> Grade 1-2 0 0 0
#> 1 0 0 0
#> 2 0 0 0
#> Grade 3-4 43 (32.1%) 46 (34.3%) 43 (32.6%)
#> 3 0 0 0
#> 4 43 (32.1%) 46 (34.3%) 43 (32.6%)
#> Grade 5 0 0 0
#> dcd C.1.1.1.3
#> - Any Grade - 43 (32.1%) 46 (34.3%) 43 (32.6%)
#> Grade 1-2 0 0 0
#> 1 0 0 0
#> 2 0 0 0
#> Grade 3-4 43 (32.1%) 46 (34.3%) 43 (32.6%)
#> 3 0 0 0
#> 4 43 (32.1%) 46 (34.3%) 43 (32.6%)
#> Grade 5 0 0 0
3. Adverse Events by Highest NCI CTCAE Grade
with modified grouping of grade
Collapsing grade 3-4 with grade 5, can be achieved by modifying the
definition of grade groups in the argument
grade_groups.
grade_groups <- list(
"Grade 1-2" = c("1", "2"),
"Grade 3-5" = c("3", "4", "5")
)
run(aet04, syn_data, grade_groups = grade_groups, prune_0 = FALSE)
#> MedDRA System Organ Class
#> MedDRA Preferred Term A: Drug X B: Placebo C: Combination
#> Grade (N=134) (N=134) (N=132)
#> ——————————————————————————————————————————————————————————————————————————————————————
#> - Any adverse events -
#> - Any Grade - 122 (91.0%) 123 (91.8%) 120 (90.9%)
#> Grade 1-2 13 (9.7%) 19 (14.2%) 11 (8.3%)
#> 1 7 (5.2%) 9 (6.7%) 4 (3.0%)
#> 2 6 (4.5%) 10 (7.5%) 7 (5.3%)
#> Grade 3-5 109 (81.3%) 104 (77.6%) 109 (82.6%)
#> 3 18 (13.4%) 14 (10.4%) 16 (12.1%)
#> 4 15 (11.2%) 20 (14.9%) 18 (13.6%)
#> 5 76 (56.7%) 70 (52.2%) 75 (56.8%)
#> cl A.1
#> - Overall -
#> - Any Grade - 78 (58.2%) 75 (56.0%) 89 (67.4%)
#> Grade 1-2 78 (58.2%) 75 (56.0%) 89 (67.4%)
#> 1 30 (22.4%) 27 (20.1%) 39 (29.5%)
#> 2 48 (35.8%) 48 (35.8%) 50 (37.9%)
#> Grade 3-5 0 0 0
#> 3 0 0 0
#> 4 0 0 0
#> 5 0 0 0
#> dcd A.1.1.1.1
#> - Any Grade - 50 (37.3%) 45 (33.6%) 63 (47.7%)
#> Grade 1-2 50 (37.3%) 45 (33.6%) 63 (47.7%)
#> 1 50 (37.3%) 45 (33.6%) 63 (47.7%)
#> 2 0 0 0
#> Grade 3-5 0 0 0
#> 3 0 0 0
#> 4 0 0 0
#> 5 0 0 0
#> dcd A.1.1.1.2
#> - Any Grade - 48 (35.8%) 48 (35.8%) 50 (37.9%)
#> Grade 1-2 48 (35.8%) 48 (35.8%) 50 (37.9%)
#> 1 0 0 0
#> 2 48 (35.8%) 48 (35.8%) 50 (37.9%)
#> Grade 3-5 0 0 0
#> 3 0 0 0
#> 4 0 0 0
#> 5 0 0 0
#> cl B.2
#> - Overall -
#> - Any Grade - 79 (59.0%) 74 (55.2%) 85 (64.4%)
#> Grade 1-2 30 (22.4%) 30 (22.4%) 33 (25.0%)
#> 1 30 (22.4%) 30 (22.4%) 33 (25.0%)
#> 2 0 0 0
#> Grade 3-5 49 (36.6%) 44 (32.8%) 52 (39.4%)
#> 3 49 (36.6%) 44 (32.8%) 52 (39.4%)
#> 4 0 0 0
#> 5 0 0 0
#> dcd B.2.2.3.1
#> - Any Grade - 48 (35.8%) 54 (40.3%) 51 (38.6%)
#> Grade 1-2 48 (35.8%) 54 (40.3%) 51 (38.6%)
#> 1 48 (35.8%) 54 (40.3%) 51 (38.6%)
#> 2 0 0 0
#> Grade 3-5 0 0 0
#> 3 0 0 0
#> 4 0 0 0
#> 5 0 0 0
#> dcd B.2.1.2.1
#> - Any Grade - 49 (36.6%) 44 (32.8%) 52 (39.4%)
#> Grade 1-2 0 0 0
#> 1 0 0 0
#> 2 0 0 0
#> Grade 3-5 49 (36.6%) 44 (32.8%) 52 (39.4%)
#> 3 49 (36.6%) 44 (32.8%) 52 (39.4%)
#> 4 0 0 0
#> 5 0 0 0
#> cl D.1
#> - Overall -
#> - Any Grade - 79 (59.0%) 67 (50.0%) 80 (60.6%)
#> Grade 1-2 0 0 0
#> 1 0 0 0
#> 2 0 0 0
#> Grade 3-5 79 (59.0%) 67 (50.0%) 80 (60.6%)
#> 3 29 (21.6%) 25 (18.7%) 29 (22.0%)
#> 4 0 0 0
#> 5 50 (37.3%) 42 (31.3%) 51 (38.6%)
#> dcd D.1.1.1.1
#> - Any Grade - 50 (37.3%) 42 (31.3%) 51 (38.6%)
#> Grade 1-2 0 0 0
#> 1 0 0 0
#> 2 0 0 0
#> Grade 3-5 50 (37.3%) 42 (31.3%) 51 (38.6%)
#> 3 0 0 0
#> 4 0 0 0
#> 5 50 (37.3%) 42 (31.3%) 51 (38.6%)
#> dcd D.1.1.4.2
#> - Any Grade - 48 (35.8%) 42 (31.3%) 50 (37.9%)
#> Grade 1-2 0 0 0
#> 1 0 0 0
#> 2 0 0 0
#> Grade 3-5 48 (35.8%) 42 (31.3%) 50 (37.9%)
#> 3 48 (35.8%) 42 (31.3%) 50 (37.9%)
#> 4 0 0 0
#> 5 0 0 0
#> cl D.2
#> - Overall -
#> - Any Grade - 47 (35.1%) 58 (43.3%) 57 (43.2%)
#> Grade 1-2 47 (35.1%) 58 (43.3%) 57 (43.2%)
#> 1 47 (35.1%) 58 (43.3%) 57 (43.2%)
#> 2 0 0 0
#> Grade 3-5 0 0 0
#> 3 0 0 0
#> 4 0 0 0
#> 5 0 0 0
#> dcd D.2.1.5.3
#> - Any Grade - 47 (35.1%) 58 (43.3%) 57 (43.2%)
#> Grade 1-2 47 (35.1%) 58 (43.3%) 57 (43.2%)
#> 1 47 (35.1%) 58 (43.3%) 57 (43.2%)
#> 2 0 0 0
#> Grade 3-5 0 0 0
#> 3 0 0 0
#> 4 0 0 0
#> 5 0 0 0
#> cl B.1
#> - Overall -
#> - Any Grade - 47 (35.1%) 49 (36.6%) 43 (32.6%)
#> Grade 1-2 0 0 0
#> 1 0 0 0
#> 2 0 0 0
#> Grade 3-5 47 (35.1%) 49 (36.6%) 43 (32.6%)
#> 3 0 0 0
#> 4 0 0 0
#> 5 47 (35.1%) 49 (36.6%) 43 (32.6%)
#> dcd B.1.1.1.1
#> - Any Grade - 47 (35.1%) 49 (36.6%) 43 (32.6%)
#> Grade 1-2 0 0 0
#> 1 0 0 0
#> 2 0 0 0
#> Grade 3-5 47 (35.1%) 49 (36.6%) 43 (32.6%)
#> 3 0 0 0
#> 4 0 0 0
#> 5 47 (35.1%) 49 (36.6%) 43 (32.6%)
#> cl C.2
#> - Overall -
#> - Any Grade - 35 (26.1%) 48 (35.8%) 55 (41.7%)
#> Grade 1-2 35 (26.1%) 48 (35.8%) 55 (41.7%)
#> 1 0 0 0
#> 2 35 (26.1%) 48 (35.8%) 55 (41.7%)
#> Grade 3-5 0 0 0
#> 3 0 0 0
#> 4 0 0 0
#> 5 0 0 0
#> dcd C.2.1.2.1
#> - Any Grade - 35 (26.1%) 48 (35.8%) 55 (41.7%)
#> Grade 1-2 35 (26.1%) 48 (35.8%) 55 (41.7%)
#> 1 0 0 0
#> 2 35 (26.1%) 48 (35.8%) 55 (41.7%)
#> Grade 3-5 0 0 0
#> 3 0 0 0
#> 4 0 0 0
#> 5 0 0 0
#> cl C.1
#> - Overall -
#> - Any Grade - 43 (32.1%) 46 (34.3%) 43 (32.6%)
#> Grade 1-2 0 0 0
#> 1 0 0 0
#> 2 0 0 0
#> Grade 3-5 43 (32.1%) 46 (34.3%) 43 (32.6%)
#> 3 0 0 0
#> 4 43 (32.1%) 46 (34.3%) 43 (32.6%)
#> 5 0 0 0
#> dcd C.1.1.1.3
#> - Any Grade - 43 (32.1%) 46 (34.3%) 43 (32.6%)
#> Grade 1-2 0 0 0
#> 1 0 0 0
#> 2 0 0 0
#> Grade 3-5 43 (32.1%) 46 (34.3%) 43 (32.6%)
#> 3 0 0 0
#> 4 43 (32.1%) 46 (34.3%) 43 (32.6%)
#> 5 0 0 0
Adverse Event Rate Adjusted for Patient-Years at Risk -
First Occurrence (AET05)
1. Adverse Event Rate Adjusted for Patient-Years at Risk - First Occurrence
- The
aet05template produces the standard adverse event rate adjusted for patient-years at risk summary considering first occurrence only. - By default, all
adsaftteparameter codes containing the string"TTE"are included in the output. Users are expected to filter the parameter(s) of interest from input safety time-to-event dataset in pre-processing if needed. - In the input safety time-to-event dataset, in the censoring variable
CNSR,0indicates the occurrence of an event of interest and1denotes censoring.
proc_data <- log_filter(syn_data, PARAMCD == "AETTE1", "adsaftte")

run(aet05, proc_data)
#>                                                     A: Drug X        B: Placebo      C: Combination
#>                                                      (N=134)           (N=134)          (N=132)
#>   —————————————————————————————————————————————————————————————————————————————————————————————————
#>   Time to first occurrence of any adverse event
#>     Total patient-years at risk                       162.4             103.8            172.6
#>     Number of adverse events observed                   78               104               67
#>     AE rate per 100 patient-years                     48.03            100.15            38.82
#>     95% CI                                        (37.37, 58.69)   (80.90, 119.40)   (29.53, 48.12)
2. Adverse Event Rate Adjusted for Patient-Years at Risk - First Occurrence (setting type of confidence interval)
- The type of the confidence interval for rate can be specified by the
argument
conf_type. Options includenormal(default),normal_logandexact. - The confidence interval can be adjusted by the argument
conf_level.
run(aet05, syn_data, conf_level = 0.90, conf_type = "exact")
#>                                                              A: Drug X          B: Placebo      C: Combination
#>                                                               (N=134)            (N=134)            (N=132)
#>   —————————————————————————————————————————————————————————————————————————————————————————————————————————————
#>   Time to first occurrence of a grade 3-5 adverse event
#>     Total patient-years at risk                                 89.3               59.2              91.8
#>     Number of adverse events observed                           106                123                103
#>     AE rate per 100 patient-years                              118.75             207.62            112.21
#>     90% CI                                                (100.43, 139.54)   (177.82, 241.16)   (94.66, 132.17)
#>   Time to first occurrence of any adverse event
#>     Total patient-years at risk                                162.4              103.8              172.6
#>     Number of adverse events observed                            78                104                67
#>     AE rate per 100 patient-years                              48.03              100.15             38.82
#>     90% CI                                                 (39.45, 57.99)    (84.56, 117.87)    (31.36, 47.58)
#>   Time to first occurrence of any serious adverse event
#>     Total patient-years at risk                                135.8               80.1              127.8
#>     Number of adverse events observed                            89                123                88
#>     AE rate per 100 patient-years                              65.56              153.62             68.84
#>     90% CI                                                 (54.56, 78.19)    (131.57, 178.44)   (57.23, 82.19)
Adverse Event Rate Adjusted for Patient-Years at Risk - All
Occurrences (AET05_ALL)
1. Adverse Event Rate Adjusted for Patient-Years at Risk - All Occurrences
- The
aet05_alltemplate produces the standard adverse event rate adjusted for patient-years at risk summary considering all occurrences. - By default, all
adsaftteparameter codes containing the string"TOT"and the parameter code"AEREPTTE"are required."TOT"parameters store the number of occurrences of adverse event of interests. Parameter code"AEREPTTE"stores the time to end of adverse event reporting period in years that contribute to the summary of “total patient-years at risk” in the output. Users are expected to filter parameters of interest from input analysis dataset in pre-processing, if needed. - In the input safety time-to-event dataset, in the censoring variable
CNSR,0indicates the occurrence of an event of interest and1denotes censoring.
proc_data <- log_filter(syn_data, PARAMCD == "AETOT1" | PARAMCD == "AEREPTTE", "adsaftte")

run(aet05_all, proc_data)
#>                                                   A: Drug X         B: Placebo       C: Combination
#>                                                    (N=134)           (N=134)            (N=132)
#>   ——————————————————————————————————————————————————————————————————————————————————————————————————
#>   Number of occurrences of any adverse event
#>     Total patient-years at risk                     337.9             331.8              341.6
#>     Number of adverse events observed                343               380                397
#>     AE rate per 100 patient-years                  101.51             114.52             116.22
#>     95% CI                                     (90.77, 112.26)   (103.00, 126.03)   (104.79, 127.66)
2. Adverse Event Rate Adjusted for Patient-Years at Risk - All Occurrences (setting type of confidence interval)
- The type of the confidence interval for rate can be specified by the
argument
conf_type. Options includenormal(default),normal_log,exact, andbyar. - The confidence interval can be adjusted by the argument
conf_level.
run(aet05_all, syn_data, conf_level = 0.90, conf_type = "exact")
#>                                                           A: Drug X          B: Placebo       C: Combination
#>                                                            (N=134)            (N=134)            (N=132)
#>   ———————————————————————————————————————————————————————————————————————————————————————————————————————————
#>   Number of occurrences of a grade 3-5 adverse event
#>     Total patient-years at risk                             337.9              331.8              341.6
#>     Number of adverse events observed                        534                465                652
#>     AE rate per 100 patient-years                           158.04             140.13             190.87
#>     90% CI                                             (146.96, 169.76)   (129.62, 151.30)   (178.75, 203.64)
#>   Number of occurrences of any adverse event
#>     Total patient-years at risk                             337.9              331.8              341.6
#>     Number of adverse events observed                        343                380                397
#>     AE rate per 100 patient-years                           101.51             114.52             116.22
#>     90% CI                                             (92.67, 111.00)    (105.03, 124.66)   (106.80, 126.29)
#>   Number of occurrences of any serious adverse event
#>     Total patient-years at risk                             337.9              331.8              341.6
#>     Number of adverse events observed                        355                331                446
#>     AE rate per 100 patient-years                           105.06             99.75              130.57
#>     90% CI                                             (96.06, 114.71)    (90.91, 109.25)    (120.57, 141.20)
Most Common (>=5%) Adverse Events
(AET10)
1. Most Common (>=5%) Adverse Events
- The
aet10template produces the standard most common adverse events occurring with relative frequency >=5% output.
run(aet10, syn_data)
#>                           A: Drug X    B: Placebo   C: Combination
#>   MedDRA Preferred Term    (N=134)      (N=134)        (N=132)
#>   ————————————————————————————————————————————————————————————————
#>   dcd D.2.1.5.3           47 (35.1%)   58 (43.3%)     57 (43.2%)
#>   dcd A.1.1.1.1           50 (37.3%)   45 (33.6%)     63 (47.7%)
#>   dcd B.2.2.3.1           48 (35.8%)   54 (40.3%)     51 (38.6%)
#>   dcd A.1.1.1.2           48 (35.8%)   48 (35.8%)     50 (37.9%)
#>   dcd B.2.1.2.1           49 (36.6%)   44 (32.8%)     52 (39.4%)
#>   dcd D.1.1.1.1           50 (37.3%)   42 (31.3%)     51 (38.6%)
#>   dcd D.1.1.4.2           48 (35.8%)   42 (31.3%)     50 (37.9%)
#>   dcd B.1.1.1.1           47 (35.1%)   49 (36.6%)     43 (32.6%)
#>   dcd C.2.1.2.1           35 (26.1%)   48 (35.8%)     55 (41.7%)
#>   dcd C.1.1.1.3           43 (32.1%)   46 (34.3%)     43 (32.6%)
2. Most Common (>=8%) Adverse Events (setting threshold)
To modify the threshold for displaying preferred terms, this can be
achieved by providing the threshold to the argument
atleast.
run(aet10, syn_data, atleast = 0.08)
#>                           A: Drug X    B: Placebo   C: Combination
#>   MedDRA Preferred Term    (N=134)      (N=134)        (N=132)
#>   ————————————————————————————————————————————————————————————————
#>   dcd D.2.1.5.3           47 (35.1%)   58 (43.3%)     57 (43.2%)
#>   dcd A.1.1.1.1           50 (37.3%)   45 (33.6%)     63 (47.7%)
#>   dcd B.2.2.3.1           48 (35.8%)   54 (40.3%)     51 (38.6%)
#>   dcd A.1.1.1.2           48 (35.8%)   48 (35.8%)     50 (37.9%)
#>   dcd B.2.1.2.1           49 (36.6%)   44 (32.8%)     52 (39.4%)
#>   dcd D.1.1.1.1           50 (37.3%)   42 (31.3%)     51 (38.6%)
#>   dcd D.1.1.4.2           48 (35.8%)   42 (31.3%)     50 (37.9%)
#>   dcd B.1.1.1.1           47 (35.1%)   49 (36.6%)     43 (32.6%)
#>   dcd C.2.1.2.1           35 (26.1%)   48 (35.8%)     55 (41.7%)
#>   dcd C.1.1.1.3           43 (32.1%)   46 (34.3%)     43 (32.6%)
Concomitant Medications by Medication Class and Preferred
Name (CMT01A)
1. Concomitant Medications by Medication Class and Preferred Name
- The
cmt01atemplate displays concomitant medications byATC Level 2and Preferred Name by default. - The template does not include the column of total by default.
- The template sort medication class and preferred name by alphabetical order by default.
run(cmt01a, syn_data)
#>   ATC Level 2 Text                                          A: Drug X    B: Placebo    C: Combination
#>     Other Treatment                                          (N=134)       (N=134)        (N=132)
#>   ———————————————————————————————————————————————————————————————————————————————————————————————————
#>   Total number of patients with at least one treatment     122 (91.0%)   123 (91.8%)    120 (90.9%)
#>   Total number of treatments                                   609           622            703
#>   ATCCLAS2 A
#>     Total number of patients with at least one treatment   97 (72.4%)    98 (73.1%)     102 (77.3%)
#>     Total number of treatments                                 205           207            242
#>     medname A_1/3                                          54 (40.3%)    49 (36.6%)      69 (52.3%)
#>     medname A_2/3                                          53 (39.6%)    50 (37.3%)      56 (42.4%)
#>     medname A_3/3                                          45 (33.6%)    54 (40.3%)      48 (36.4%)
#>   ATCCLAS2 A p2
#>     Total number of patients with at least one treatment   45 (33.6%)    54 (40.3%)      48 (36.4%)
#>     Total number of treatments                                 58            66              64
#>     medname A_3/3                                          45 (33.6%)    54 (40.3%)      48 (36.4%)
#>   ATCCLAS2 B
#>     Total number of patients with at least one treatment   102 (76.1%)   101 (75.4%)    108 (81.8%)
#>     Total number of treatments                                 264           275            306
#>     medname B_1/4                                          52 (38.8%)    57 (42.5%)      59 (44.7%)
#>     medname B_2/4                                          52 (38.8%)    55 (41.0%)      56 (42.4%)
#>     medname B_4/4                                          50 (37.3%)    45 (33.6%)      55 (41.7%)
#>     medname B_3/4                                          47 (35.1%)    47 (35.1%)      52 (39.4%)
#>   ATCCLAS2 B p2
#>     Total number of patients with at least one treatment   78 (58.2%)    82 (61.2%)      89 (67.4%)
#>     Total number of treatments                                 139           155            159
#>     medname B_1/4                                          52 (38.8%)    57 (42.5%)      59 (44.7%)
#>     medname B_2/4                                          52 (38.8%)    55 (41.0%)      56 (42.4%)
#>   ATCCLAS2 B p3
#>     Total number of patients with at least one treatment   78 (58.2%)    82 (61.2%)      89 (67.4%)
#>     Total number of treatments                                 139           155            159
#>     medname B_1/4                                          52 (38.8%)    57 (42.5%)      59 (44.7%)
#>     medname B_2/4                                          52 (38.8%)    55 (41.0%)      56 (42.4%)
#>   ATCCLAS2 C
#>     Total number of patients with at least one treatment   82 (61.2%)    84 (62.7%)      89 (67.4%)
#>     Total number of treatments                                 140           140            155
#>     medname C_2/2                                          52 (38.8%)    58 (43.3%)      60 (45.5%)
#>     medname C_1/2                                          51 (38.1%)    50 (37.3%)      56 (42.4%)
#>   ATCCLAS2 C p2
#>     Total number of patients with at least one treatment   82 (61.2%)    84 (62.7%)      89 (67.4%)
#>     Total number of treatments                                 140           140            155
#>     medname C_2/2                                          52 (38.8%)    58 (43.3%)      60 (45.5%)
#>     medname C_1/2                                          51 (38.1%)    50 (37.3%)      56 (42.4%)
#>   ATCCLAS2 C p3
#>     Total number of patients with at least one treatment   52 (38.8%)    58 (43.3%)      60 (45.5%)
#>     Total number of treatments                                 69            73              80
#>     medname C_2/2                                          52 (38.8%)    58 (43.3%)      60 (45.5%)
2. Concomitant Medications by Medication Class and Preferred
Name (changing ATC class level)
run(cmt01a, syn_data, row_split_var = "ATC1")
#>   ATC Level 1 Text                                          A: Drug X    B: Placebo    C: Combination
#>     Other Treatment                                          (N=134)       (N=134)        (N=132)
#>   ———————————————————————————————————————————————————————————————————————————————————————————————————
#>   Total number of patients with at least one treatment     122 (91.0%)   123 (91.8%)    120 (90.9%)
#>   Total number of treatments                                   609           622            703
#>   ATCCLAS1 A
#>     Total number of patients with at least one treatment   97 (72.4%)    98 (73.1%)     102 (77.3%)
#>     Total number of treatments                                 205           207            242
#>     medname A_1/3                                          54 (40.3%)    49 (36.6%)      69 (52.3%)
#>     medname A_2/3                                          53 (39.6%)    50 (37.3%)      56 (42.4%)
#>     medname A_3/3                                          45 (33.6%)    54 (40.3%)      48 (36.4%)
#>   ATCCLAS1 A p2
#>     Total number of patients with at least one treatment   45 (33.6%)    54 (40.3%)      48 (36.4%)
#>     Total number of treatments                                 58            66              64
#>     medname A_3/3                                          45 (33.6%)    54 (40.3%)      48 (36.4%)
#>   ATCCLAS1 B
#>     Total number of patients with at least one treatment   102 (76.1%)   101 (75.4%)    108 (81.8%)
#>     Total number of treatments                                 264           275            306
#>     medname B_1/4                                          52 (38.8%)    57 (42.5%)      59 (44.7%)
#>     medname B_2/4                                          52 (38.8%)    55 (41.0%)      56 (42.4%)
#>     medname B_4/4                                          50 (37.3%)    45 (33.6%)      55 (41.7%)
#>     medname B_3/4                                          47 (35.1%)    47 (35.1%)      52 (39.4%)
#>   ATCCLAS1 B p2
#>     Total number of patients with at least one treatment   78 (58.2%)    82 (61.2%)      89 (67.4%)
#>     Total number of treatments                                 139           155            159
#>     medname B_1/4                                          52 (38.8%)    57 (42.5%)      59 (44.7%)
#>     medname B_2/4                                          52 (38.8%)    55 (41.0%)      56 (42.4%)
#>   ATCCLAS1 B p3
#>     Total number of patients with at least one treatment   78 (58.2%)    82 (61.2%)      89 (67.4%)
#>     Total number of treatments                                 139           155            159
#>     medname B_1/4                                          52 (38.8%)    57 (42.5%)      59 (44.7%)
#>     medname B_2/4                                          52 (38.8%)    55 (41.0%)      56 (42.4%)
#>   ATCCLAS1 C
#>     Total number of patients with at least one treatment   82 (61.2%)    84 (62.7%)      89 (67.4%)
#>     Total number of treatments                                 140           140            155
#>     medname C_2/2                                          52 (38.8%)    58 (43.3%)      60 (45.5%)
#>     medname C_1/2                                          51 (38.1%)    50 (37.3%)      56 (42.4%)
#>   ATCCLAS1 C p2
#>     Total number of patients with at least one treatment   82 (61.2%)    84 (62.7%)      89 (67.4%)
#>     Total number of treatments                                 140           140            155
#>     medname C_2/2                                          52 (38.8%)    58 (43.3%)      60 (45.5%)
#>     medname C_1/2                                          51 (38.1%)    50 (37.3%)      56 (42.4%)
#>   ATCCLAS1 C p3
#>     Total number of patients with at least one treatment   52 (38.8%)    58 (43.3%)      60 (45.5%)
#>     Total number of treatments                                 69            73              80
#>     medname C_2/2                                          52 (38.8%)    58 (43.3%)      60 (45.5%)
3. Concomitant Medications by Medication Class and Preferred Name (classes sorted by frequency)
The argument sort_by_freq = TRUE sort medication class
by frequency.
run(cmt01a, syn_data, sort_by_freq = TRUE)
#>   ATC Level 2 Text                                          A: Drug X    B: Placebo    C: Combination
#>     Other Treatment                                          (N=134)       (N=134)        (N=132)
#>   ———————————————————————————————————————————————————————————————————————————————————————————————————
#>   Total number of patients with at least one treatment     122 (91.0%)   123 (91.8%)    120 (90.9%)
#>   Total number of treatments                                   609           622            703
#>   ATCCLAS2 B
#>     Total number of patients with at least one treatment   102 (76.1%)   101 (75.4%)    108 (81.8%)
#>     Total number of treatments                                 264           275            306
#>     medname B_1/4                                          52 (38.8%)    57 (42.5%)      59 (44.7%)
#>     medname B_2/4                                          52 (38.8%)    55 (41.0%)      56 (42.4%)
#>     medname B_4/4                                          50 (37.3%)    45 (33.6%)      55 (41.7%)
#>     medname B_3/4                                          47 (35.1%)    47 (35.1%)      52 (39.4%)
#>   ATCCLAS2 A
#>     Total number of patients with at least one treatment   97 (72.4%)    98 (73.1%)     102 (77.3%)
#>     Total number of treatments                                 205           207            242
#>     medname A_1/3                                          54 (40.3%)    49 (36.6%)      69 (52.3%)
#>     medname A_2/3                                          53 (39.6%)    50 (37.3%)      56 (42.4%)
#>     medname A_3/3                                          45 (33.6%)    54 (40.3%)      48 (36.4%)
#>   ATCCLAS2 C
#>     Total number of patients with at least one treatment   82 (61.2%)    84 (62.7%)      89 (67.4%)
#>     Total number of treatments                                 140           140            155
#>     medname C_2/2                                          52 (38.8%)    58 (43.3%)      60 (45.5%)
#>     medname C_1/2                                          51 (38.1%)    50 (37.3%)      56 (42.4%)
#>   ATCCLAS2 C p2
#>     Total number of patients with at least one treatment   82 (61.2%)    84 (62.7%)      89 (67.4%)
#>     Total number of treatments                                 140           140            155
#>     medname C_2/2                                          52 (38.8%)    58 (43.3%)      60 (45.5%)
#>     medname C_1/2                                          51 (38.1%)    50 (37.3%)      56 (42.4%)
#>   ATCCLAS2 B p2
#>     Total number of patients with at least one treatment   78 (58.2%)    82 (61.2%)      89 (67.4%)
#>     Total number of treatments                                 139           155            159
#>     medname B_1/4                                          52 (38.8%)    57 (42.5%)      59 (44.7%)
#>     medname B_2/4                                          52 (38.8%)    55 (41.0%)      56 (42.4%)
#>   ATCCLAS2 B p3
#>     Total number of patients with at least one treatment   78 (58.2%)    82 (61.2%)      89 (67.4%)
#>     Total number of treatments                                 139           155            159
#>     medname B_1/4                                          52 (38.8%)    57 (42.5%)      59 (44.7%)
#>     medname B_2/4                                          52 (38.8%)    55 (41.0%)      56 (42.4%)
#>   ATCCLAS2 C p3
#>     Total number of patients with at least one treatment   52 (38.8%)    58 (43.3%)      60 (45.5%)
#>     Total number of treatments                                 69            73              80
#>     medname C_2/2                                          52 (38.8%)    58 (43.3%)      60 (45.5%)
#>   ATCCLAS2 A p2
#>     Total number of patients with at least one treatment   45 (33.6%)    54 (40.3%)      48 (36.4%)
#>     Total number of treatments                                 58            66              64
#>     medname A_3/3                                          45 (33.6%)    54 (40.3%)      48 (36.4%)
4. Concomitant Medications by Medication Class and Preferred Name (total number of treatments per medication class suppressed)
The cmt01a template includes the
analysis of ‘total number of treatments’ by default, modify the argument
summary_labels to change it.
run(cmt01a, syn_data, summary_labels = list(TOTAL = cmt01_label, ATC2 = cmt01_label[1]))
#>   ATC Level 2 Text                                          A: Drug X    B: Placebo    C: Combination
#>     Other Treatment                                          (N=134)       (N=134)        (N=132)
#>   ———————————————————————————————————————————————————————————————————————————————————————————————————
#>   Total number of patients with at least one treatment     122 (91.0%)   123 (91.8%)    120 (90.9%)
#>   Total number of treatments                                   609           622            703
#>   ATCCLAS2 A
#>     Total number of patients with at least one treatment   97 (72.4%)    98 (73.1%)     102 (77.3%)
#>     medname A_1/3                                          54 (40.3%)    49 (36.6%)      69 (52.3%)
#>     medname A_2/3                                          53 (39.6%)    50 (37.3%)      56 (42.4%)
#>     medname A_3/3                                          45 (33.6%)    54 (40.3%)      48 (36.4%)
#>   ATCCLAS2 A p2
#>     Total number of patients with at least one treatment   45 (33.6%)    54 (40.3%)      48 (36.4%)
#>     medname A_3/3                                          45 (33.6%)    54 (40.3%)      48 (36.4%)
#>   ATCCLAS2 B
#>     Total number of patients with at least one treatment   102 (76.1%)   101 (75.4%)    108 (81.8%)
#>     medname B_1/4                                          52 (38.8%)    57 (42.5%)      59 (44.7%)
#>     medname B_2/4                                          52 (38.8%)    55 (41.0%)      56 (42.4%)
#>     medname B_4/4                                          50 (37.3%)    45 (33.6%)      55 (41.7%)
#>     medname B_3/4                                          47 (35.1%)    47 (35.1%)      52 (39.4%)
#>   ATCCLAS2 B p2
#>     Total number of patients with at least one treatment   78 (58.2%)    82 (61.2%)      89 (67.4%)
#>     medname B_1/4                                          52 (38.8%)    57 (42.5%)      59 (44.7%)
#>     medname B_2/4                                          52 (38.8%)    55 (41.0%)      56 (42.4%)
#>   ATCCLAS2 B p3
#>     Total number of patients with at least one treatment   78 (58.2%)    82 (61.2%)      89 (67.4%)
#>     medname B_1/4                                          52 (38.8%)    57 (42.5%)      59 (44.7%)
#>     medname B_2/4                                          52 (38.8%)    55 (41.0%)      56 (42.4%)
#>   ATCCLAS2 C
#>     Total number of patients with at least one treatment   82 (61.2%)    84 (62.7%)      89 (67.4%)
#>     medname C_2/2                                          52 (38.8%)    58 (43.3%)      60 (45.5%)
#>     medname C_1/2                                          51 (38.1%)    50 (37.3%)      56 (42.4%)
#>   ATCCLAS2 C p2
#>     Total number of patients with at least one treatment   82 (61.2%)    84 (62.7%)      89 (67.4%)
#>     medname C_2/2                                          52 (38.8%)    58 (43.3%)      60 (45.5%)
#>     medname C_1/2                                          51 (38.1%)    50 (37.3%)      56 (42.4%)
#>   ATCCLAS2 C p3
#>     Total number of patients with at least one treatment   52 (38.8%)    58 (43.3%)      60 (45.5%)
#>     medname C_2/2                                          52 (38.8%)    58 (43.3%)      60 (45.5%)
Concomitant Medications by Preferred Name
(CMT02_PT)
1. Concomitant Medications by Preferred Name
- The
cmt02_pttemplate displays concomitant medications by Preferred Name by default. - The template does not include the column of total by default.
- The template sorts preferred name by alphabetical order by default.
Set the argument
sort_by_freq = TRUEto sort preferred names by frequency.
run(cmt02_pt, syn_data)
#>                                                           A: Drug X    B: Placebo    C: Combination
#>   Other Treatment                                          (N=134)       (N=134)        (N=132)
#>   —————————————————————————————————————————————————————————————————————————————————————————————————
#>   Total number of patients with at least one treatment   122 (91.0%)   123 (91.8%)    120 (90.9%)
#>   Total number of treatments                                 609           622            703
#>   medname A_1/3                                          54 (40.3%)    49 (36.6%)      69 (52.3%)
#>   medname C_2/2                                          52 (38.8%)    58 (43.3%)      60 (45.5%)
#>   medname B_1/4                                          52 (38.8%)    57 (42.5%)      59 (44.7%)
#>   medname B_2/4                                          52 (38.8%)    55 (41.0%)      56 (42.4%)
#>   medname A_2/3                                          53 (39.6%)    50 (37.3%)      56 (42.4%)
#>   medname C_1/2                                          51 (38.1%)    50 (37.3%)      56 (42.4%)
#>   medname B_4/4                                          50 (37.3%)    45 (33.6%)      55 (41.7%)
#>   medname A_3/3                                          45 (33.6%)    54 (40.3%)      48 (36.4%)
#>   medname B_3/4                                          47 (35.1%)    47 (35.1%)      52 (39.4%)
Cox Regression (COXT01)
1. Cox Regression
- The
coxt01template produces the standard Cox regression output. - Users are expected to pre-process the input analysis data by selecting a time-to-event parameter to be analyzed. The example below is based on the time-to-event parameter “Duration of Confirmed Response by Investigator”.
- The time variable in the model is specified through the
time_varargument. By default,time_varis set to"AVAL", which comes fromADTTE.AVAL. - The event variable in the model is specified through the
event_varargument. By default,event_varis set to"EVENT", which is derived based on the censoring indicatorADTTE.CNSRin the pre-processing functioncoxt01_pre. - If there are more than two treatment groups present in the input
analysis data, users are also expected to select only two treatment
groups. The example below is based on treatment groups
"Arm A"and"Arm B".
proc_data <- log_filter(syn_data, PARAMCD == "CRSD", "adtte")
proc_data <- log_filter(proc_data, ARMCD != "ARM C", "adsl")
run(coxt01, proc_data, time_var = "AVAL", event_var = "EVENT")
#>                                                Treatment Effect Adjusted for Covariate
#>   Effect/Covariate Included in the Model     n     Hazard Ratio       95% CI       p-value
#>   —————————————————————————————————————————————————————————————————————————————————————————
#>   Treatment:
#>     B: Placebo vs control (A: Drug X)       268        1.43        (1.06, 1.94)     0.0204
#>   Covariate:
#>     Sex                                     268        1.43        (1.06, 1.94)     0.0208
#>     RACE                                    268        1.44        (1.06, 1.96)     0.0208
#>     Age (yr)                                268        1.46        (1.07, 1.98)     0.0154
2. Cox Regression (with interaction term)
To add the interaction term to the model,
interaction = TRUE, which is passed to
tern::control_coxreg(), needs to be specified.
run(coxt01, proc_data, interaction = TRUE)
#>                                                         Treatment Effect Adjusted for Covariate
#>   Effect/Covariate Included in the Model    n    Hazard Ratio      95% CI      p-value   Interaction p-value
#>   ——————————————————————————————————————————————————————————————————————————————————————————————————————————
#>   Treatment:
#>     B: Placebo vs control (A: Drug X)      268       1.43       (1.06, 1.94)   0.0204
#>   Covariate:
#>     Sex                                    268                                                 0.2580
#>       F                                              1.66       (1.11, 2.48)
#>       M                                              1.16       (0.73, 1.86)
#>     RACE                                   268                                                 0.0772
#>       AMERICAN INDIAN OR ALASKA NATIVE               0.37       (0.11, 1.27)
#>       ASIAN                                          1.34       (0.88, 2.06)
#>       BLACK OR AFRICAN AMERICAN                      2.40       (1.20, 4.76)
#>       WHITE                                          1.45       (0.77, 2.72)
#>     Age (yr)                               268                                                 0.6586
#>       34                                             1.47       (1.08, 1.99)
3. Cox Regression (specifying covariates)
- By default,
"SEX","RACE"and"AAGE"are used as the covariates for the model. - Users can specify a different set of covariates through the
covariatesargument. In the example below,"ETHNIC","RACE", and"AAGE"are used as covariates.
run(coxt01, proc_data, covariates = c("ETHNIC", "RACE", "AAGE"))
#>                                                Treatment Effect Adjusted for Covariate
#>   Effect/Covariate Included in the Model     n     Hazard Ratio       95% CI       p-value
#>   —————————————————————————————————————————————————————————————————————————————————————————
#>   Treatment:
#>     B: Placebo vs control (A: Drug X)       268        1.43        (1.06, 1.94)     0.0204
#>   Covariate:
#>     Ethnicity                               268        1.48        (1.08, 2.03)     0.0143
#>     RACE                                    268        1.44        (1.06, 1.96)     0.0208
#>     Age (yr)                                268        1.46        (1.07, 1.98)     0.0154
4. Cox Regression (setting strata, ties, and alpha level)
- By default,
strata = NULL(no stratification),ties = "exact"(equivalent toDISCRETEin SAS), andconf_level = 0.95are applied. - Users can specify one or more stratification variables via the
strataargument. - Other tie handling methods, i.e.,
"efron"or"breslow", can be specified in thetieargument, which is passed totern::control_coxreg(). - Users can also customize the alpha level for the confidence
intervals through the
conf_levelargument, which is passed totern::control_coxreg().
run(coxt01, proc_data, covariates = c("SEX", "AAGE"), strata = c("RACE"), conf_level = 0.90)
#>                                                Treatment Effect Adjusted for Covariate
#>   Effect/Covariate Included in the Model     n     Hazard Ratio       90% CI       p-value
#>   —————————————————————————————————————————————————————————————————————————————————————————
#>   Treatment:
#>     B: Placebo vs control (A: Drug X)       268        1.42        (1.09, 1.84)     0.0274
#>   Covariate:
#>     Sex                                     268        1.42        (1.09, 1.84)     0.0273
#>     Age (yr)                                268        1.44        (1.11, 1.87)     0.0211
Multi-variable Cox Regression
(COXT02)
1. Multi-variable Cox Regression
- The
coxt02template produces the standard multi-variable cox regression output. - Users are expected to pre-process the input analysis data by selecting a time-to-event parameter to be analyzed. The example below is based on the time-to-event parameter “Duration of Confirmed Response by Investigator”.
- The time variable in the model is specified through the
time_varargument. By default,time_varis set to"AVAL", which comes fromADTTE.AVAL. - The event variable in the model is specified through the
event_varargument. By default,event_varis set to"EVENT", which is derived based on the censoring indicatorADTTE.CNSRin the pre-processing functioncoxt01_pre.
proc_data <- log_filter(syn_data, PARAMCD == "CRSD", "adtte")
run(coxt02, proc_data, time_var = "AVAL", event_var = "EVENT")
#>   Effect/Covariate Included in the Model                  Hazard Ratio      95% CI      p-value
#>   —————————————————————————————————————————————————————————————————————————————————————————————
#>   Treatment:
#>     Description of Planned Arm (reference = A: Drug X)                                  <0.0001
#>       B: Placebo                                              1.45       (1.07, 1.98)   0.0176
#>       C: Combination                                          2.49       (1.84, 3.37)   <0.0001
#>   Covariate:
#>     Sex (reference = F)
#>       M                                                       0.99       (0.78, 1.27)   0.9564
#>     RACE (reference = AMERICAN INDIAN OR ALASKA NATIVE)                                 0.9134
#>       ASIAN                                                   0.85       (0.49, 1.46)   0.5568
#>       BLACK OR AFRICAN AMERICAN                               0.85       (0.48, 1.50)   0.5673
#>       WHITE                                                   0.91       (0.51, 1.63)   0.7579
#>     Age (yr)
#>       All                                                     0.99       (0.97, 1.01)   0.2501
2. Multi-variable Cox Regression (specifying covariates)
- By default,
"SEX","RACE"and"AAGE"are used as the covariates for the model. - Users can specify a different set of covariates through the
covariatesargument. In the example below,"ETHNIC","RACE", and"AAGE"are used as covariates.
run(coxt02, proc_data, covariates = c("ETHNIC", "RACE", "AAGE"))
#>   Effect/Covariate Included in the Model                  Hazard Ratio      95% CI      p-value
#>   —————————————————————————————————————————————————————————————————————————————————————————————
#>   Treatment:
#>     Description of Planned Arm (reference = A: Drug X)                                  <0.0001
#>       B: Placebo                                              1.52       (1.11, 2.08)   0.0096
#>       C: Combination                                          2.58       (1.90, 3.52)   <0.0001
#>   Covariate:
#>     Ethnicity  NOT REPORTED)                                                            0.1654
#>       HISPANIC OR LATINO                                      0.85       (0.49, 1.47)   0.5562
#>       NOT HISPANIC OR LATINO                                  0.84       (0.53, 1.32)   0.4502
#>       UNKNOWN                                                 1.63       (0.78, 3.40)   0.1907
#>     RACE (reference = AMERICAN INDIAN OR ALASKA NATIVE)                                 0.8659
#>       ASIAN                                                   0.82       (0.47, 1.41)   0.4692
#>       BLACK OR AFRICAN AMERICAN                               0.84       (0.47, 1.50)   0.5581
#>       WHITE                                                   0.90       (0.50, 1.60)   0.7111
#>     Age (yr)
#>       All                                                     0.99       (0.97, 1.01)   0.2141
3. Multi-variable Cox Regression (setting strata, ties, and alpha level)
- By default,
strata = NULL(no stratification),ties = "exact"(equivalent toDISCRETEin SAS), andconf_level = 0.95are applied. - Users can specify one or more stratification variables via the
strataargument. - Other tie handling methods, i.e.,
"efron"or"breslow", can be specified in thetieargument, which is passed totern::control_coxreg(). - Users can also customize the alpha level for the confidence
intervals through the
conf_levelargument, which is passed totern::control_coxreg().
run(coxt02, proc_data, covariates = c("SEX", "AAGE"), strata = c("RACE"), conf_level = 0.90, ties = "efron")
#>   Effect/Covariate Included in the Model                 Hazard Ratio      90% CI      p-value
#>   ————————————————————————————————————————————————————————————————————————————————————————————
#>   Treatment:
#>     Description of Planned Arm (reference = A: Drug X)                                 <0.0001
#>       B: Placebo                                             1.45       (1.12, 1.88)   0.0192
#>       C: Combination                                         2.51       (1.94, 3.24)   <0.0001
#>   Covariate:
#>     Sex (reference = F)
#>       M                                                      1.00       (0.81, 1.23)   0.9692
#>     Age (yr)
#>       All                                                    0.99       (0.97, 1.00)   0.1956
Demographics and Baseline Characteristics
(DMT01)
1. Demographics and Baseline Characteristics with All Patients
- The
dmt01template produces the standard demographics and baseline characteristics summary. - This template includes the column of total by default.
run(dmt01, syn_data)
#>                                         A: Drug X    B: Placebo    C: Combination   All Patients
#>                                          (N=134)       (N=134)        (N=132)         (N=400)
#>   ——————————————————————————————————————————————————————————————————————————————————————————————
#>   Age (yr)
#>     n                                      134           134            132             400
#>     Mean (SD)                          33.8 (6.6)    35.4 (7.9)      35.4 (7.7)      34.9 (7.4)
#>     Median                                33.0          35.0            35.0            34.0
#>     Min - Max                            21 - 50       21 - 62        20 - 69         20 - 69
#>   Age Group
#>     n                                      134           134            132             400
#>     <65                                134 (100%)    134 (100%)     131 (99.2%)     399 (99.8%)
#>     >=65                                    0             0           1 (0.8%)        1 (0.2%)
#>   Sex
#>     n                                      134           134            132             400
#>     Male                               55 (41.0%)    52 (38.8%)      62 (47.0%)     169 (42.2%)
#>     Female                             79 (59.0%)    82 (61.2%)      70 (53.0%)     231 (57.8%)
#>   Ethnicity
#>     n                                      134           134            132             400
#>     NOT REPORTED                        6 (4.5%)      10 (7.5%)      11 (8.3%)       27 (6.8%)
#>     HISPANIC OR LATINO                 15 (11.2%)    18 (13.4%)      15 (11.4%)      48 (12.0%)
#>     NOT HISPANIC OR LATINO             104 (77.6%)   103 (76.9%)    101 (76.5%)     308 (77.0%)
#>     UNKNOWN                             9 (6.7%)      3 (2.2%)        5 (3.8%)       17 (4.2%)
#>   RACE
#>     n                                      134           134            132             400
#>     AMERICAN INDIAN OR ALASKA NATIVE    8 (6.0%)      11 (8.2%)       6 (4.5%)       25 (6.2%)
#>     ASIAN                              68 (50.7%)    68 (50.7%)      73 (55.3%)     209 (52.2%)
#>     BLACK OR AFRICAN AMERICAN          31 (23.1%)    28 (20.9%)      32 (24.2%)      91 (22.8%)
#>     WHITE                              27 (20.1%)    27 (20.1%)      21 (15.9%)      75 (18.8%)
2. Demographics and Baseline Characteristics without All Patients
To remove the column of total, set the argument
lbl_overall to NULL.
run(dmt01, syn_data, lbl_overall = NULL)
#>                                         A: Drug X    B: Placebo    C: Combination
#>                                          (N=134)       (N=134)        (N=132)
#>   ———————————————————————————————————————————————————————————————————————————————
#>   Age (yr)
#>     n                                      134           134            132
#>     Mean (SD)                          33.8 (6.6)    35.4 (7.9)      35.4 (7.7)
#>     Median                                33.0          35.0            35.0
#>     Min - Max                            21 - 50       21 - 62        20 - 69
#>   Age Group
#>     n                                      134           134            132
#>     <65                                134 (100%)    134 (100%)     131 (99.2%)
#>     >=65                                    0             0           1 (0.8%)
#>   Sex
#>     n                                      134           134            132
#>     Male                               55 (41.0%)    52 (38.8%)      62 (47.0%)
#>     Female                             79 (59.0%)    82 (61.2%)      70 (53.0%)
#>   Ethnicity
#>     n                                      134           134            132
#>     NOT REPORTED                        6 (4.5%)      10 (7.5%)      11 (8.3%)
#>     HISPANIC OR LATINO                 15 (11.2%)    18 (13.4%)      15 (11.4%)
#>     NOT HISPANIC OR LATINO             104 (77.6%)   103 (76.9%)    101 (76.5%)
#>     UNKNOWN                             9 (6.7%)      3 (2.2%)        5 (3.8%)
#>   RACE
#>     n                                      134           134            132
#>     AMERICAN INDIAN OR ALASKA NATIVE    8 (6.0%)      11 (8.2%)       6 (4.5%)
#>     ASIAN                              68 (50.7%)    68 (50.7%)      73 (55.3%)
#>     BLACK OR AFRICAN AMERICAN          31 (23.1%)    28 (20.9%)      32 (24.2%)
#>     WHITE                              27 (20.1%)    27 (20.1%)      21 (15.9%)
3. Demographics and Baseline Characteristics with an additional study specific continuous variable
- Study specific continuous variables can be added to the standard
demographics and baseline characteristics summary by editing the
argument
summaryvars. To add or remove analyses, you need to pass all variables you would like to include to the argument. - CHEVRON performs the analysis based on the type of variable as defined in the input data.
run(dmt01, syn_data, summaryvars = c("AGE", "AGEGR1", "SEX", "ETHNIC", "RACE", "BBMISI"), lbl_overall = NULL)
#>                                          A: Drug X      B: Placebo     C: Combination
#>                                           (N=134)         (N=134)         (N=132)
#>   ———————————————————————————————————————————————————————————————————————————————————
#>   Age
#>     n                                       134             134             132
#>     Mean (SD)                           33.8 (6.6)      35.4 (7.9)       35.4 (7.7)
#>     Median                                 33.0            35.0             35.0
#>     Min - Max                             21 - 50         21 - 62         20 - 69
#>   Age Group
#>     n                                       134             134             132
#>     <65                                 134 (100%)      134 (100%)      131 (99.2%)
#>     >=65                                     0               0            1 (0.8%)
#>   Sex
#>     n                                       134             134             132
#>     Male                                55 (41.0%)      52 (38.8%)       62 (47.0%)
#>     Female                              79 (59.0%)      82 (61.2%)       70 (53.0%)
#>   Ethnicity
#>     n                                       134             134             132
#>     NOT REPORTED                         6 (4.5%)        10 (7.5%)       11 (8.3%)
#>     HISPANIC OR LATINO                  15 (11.2%)      18 (13.4%)       15 (11.4%)
#>     NOT HISPANIC OR LATINO              104 (77.6%)     103 (76.9%)     101 (76.5%)
#>     UNKNOWN                              9 (6.7%)        3 (2.2%)         5 (3.8%)
#>   RACE
#>     n                                       134             134             132
#>     AMERICAN INDIAN OR ALASKA NATIVE     8 (6.0%)        11 (8.2%)        6 (4.5%)
#>     ASIAN                               68 (50.7%)      68 (50.7%)       73 (55.3%)
#>     BLACK OR AFRICAN AMERICAN           31 (23.1%)      28 (20.9%)       32 (24.2%)
#>     WHITE                               27 (20.1%)      27 (20.1%)       21 (15.9%)
#>   Baseline BMI
#>     n                                       134             134             132
#>     Mean (SD)                          29.96 (18.30)   32.39 (23.23)   30.07 (18.44)
#>     Median                                 27.10           31.10           30.00
#>     Min - Max                           -6.9 - 75.9    -26.6 - 117.9    -44.2 - 87.5
4. Demographics and Baseline Characteristics with an additional study specific categorical variable
- Study specific categorical variables can be added to the standard
demographics and baseline characteristics summary by editing the
argument
summaryvars. - To display the values within a categorical variable in pre-specified order, the categorical variable need to be factorized with pre-specified order provided as levels.
proc_data <- syn_data
proc_data$adsl <- proc_data$adsl %>%
  mutate(
    SEX = reformat(.data$SEX, rule(Male = "M", Female = "F")),
    BBMIGR1 = factor(case_when(
      BBMISI < 15 ~ "Very severely underweight",
      BBMISI >= 15 & BBMISI < 16 ~ "Severely underweight",
      BBMISI >= 16 & BBMISI < 18.5 ~ "Underweight",
      BBMISI >= 18.5 & BBMISI < 25 ~ "Normal (healthy weight)",
      BBMISI >= 25 & BBMISI < 30 ~ "Overweight",
      BBMISI >= 30 & BBMISI < 35 ~ "Obese Class I (Moderately obese)",
      BBMISI >= 35 & BBMISI < 40 ~ "Obese Class II (Severely obese)",
      BBMISI >= 40 ~ "Obese Class III (Very severely obese)"
    ), levels = c(
      "Very severely underweight",
      "Severely underweight",
      "Underweight",
      "Normal (healthy weight)",
      "Overweight",
      "Obese Class I (Moderately obese)",
      "Obese Class II (Severely obese)",
      "Obese Class III (Very severely obese)"
    ))
  )

run(dmt01, proc_data, summaryvars = c("AGE", "AGEGR1", "SEX", "ETHNIC", "RACE", "BBMIGR1"), auto_pre = FALSE)
#>                                              A: Drug X    B: Placebo    C: Combination   All Patients
#>                                               (N=134)       (N=134)        (N=132)         (N=400)
#>   ———————————————————————————————————————————————————————————————————————————————————————————————————
#>   Age
#>     n                                           134           134            132             400
#>     Mean (SD)                               33.8 (6.6)    35.4 (7.9)      35.4 (7.7)      34.9 (7.4)
#>     Median                                     33.0          35.0            35.0            34.0
#>     Min - Max                                 21 - 50       21 - 62        20 - 69         20 - 69
#>   Age Group
#>     n                                           134           134            132             400
#>     <65                                     134 (100%)    134 (100%)     131 (99.2%)     399 (99.8%)
#>     >=65                                         0             0           1 (0.8%)        1 (0.2%)
#>   Sex
#>     n                                           134           134            132             400
#>     Male                                    55 (41.0%)    52 (38.8%)      62 (47.0%)     169 (42.2%)
#>     Female                                  79 (59.0%)    82 (61.2%)      70 (53.0%)     231 (57.8%)
#>   Ethnicity
#>     n                                           134           134            132             400
#>     NOT REPORTED                             6 (4.5%)      10 (7.5%)      11 (8.3%)       27 (6.8%)
#>     HISPANIC OR LATINO                      15 (11.2%)    18 (13.4%)      15 (11.4%)      48 (12.0%)
#>     NOT HISPANIC OR LATINO                  104 (77.6%)   103 (76.9%)    101 (76.5%)     308 (77.0%)
#>     UNKNOWN                                  9 (6.7%)      3 (2.2%)        5 (3.8%)       17 (4.2%)
#>   RACE
#>     n                                           134           134            132             400
#>     AMERICAN INDIAN OR ALASKA NATIVE         8 (6.0%)      11 (8.2%)       6 (4.5%)       25 (6.2%)
#>     ASIAN                                   68 (50.7%)    68 (50.7%)      73 (55.3%)     209 (52.2%)
#>     BLACK OR AFRICAN AMERICAN               31 (23.1%)    28 (20.9%)      32 (24.2%)      91 (22.8%)
#>     WHITE                                   27 (20.1%)    27 (20.1%)      21 (15.9%)      75 (18.8%)
#>   BBMIGR1
#>     n                                           134           134            132             400
#>     Very severely underweight               31 (23.1%)    29 (21.6%)      24 (18.2%)      84 (21.0%)
#>     Severely underweight                     4 (3.0%)      1 (0.7%)        1 (0.8%)        6 (1.5%)
#>     Underweight                              9 (6.7%)      7 (5.2%)        3 (2.3%)       19 (4.8%)
#>     Normal (healthy weight)                 17 (12.7%)    18 (13.4%)      20 (15.2%)      55 (13.8%)
#>     Overweight                               11 (8.2%)     10 (7.5%)      18 (13.6%)      39 (9.8%)
#>     Obese Class I (Moderately obese)         12 (9.0%)     11 (8.2%)      16 (12.1%)      39 (9.8%)
#>     Obese Class II (Severely obese)          11 (8.2%)     13 (9.7%)      16 (12.1%)      40 (10.0%)
#>     Obese Class III (Very severely obese)   39 (29.1%)    45 (33.6%)      34 (25.8%)     118 (29.5%)
5. Demographics and Baseline Characteristics with additional
vital signs baseline values from ADVS or
ADSUB
To add baseline vital signs or other baseline characteristics to the
demographics and baseline characteristics summary, manual preprocess of
input adsl dataset is expected and merge the vital signs
baseline values from advs (where
ADVS.ABLFL == "Y") or adsub with
adsl by unique subject identifier.
proc_data <- syn_data
diabpbl <- proc_data$advs %>%
  filter(ABLFL == "Y" & PARAMCD == "DIABP") %>%
  mutate(DIABPBL = AVAL) %>%
  select("STUDYID", "USUBJID", "DIABPBL")

proc_data$adsl <- proc_data$adsl %>%
  mutate(SEX = reformat(.data$SEX, rule(Male = "M", Female = "F"))) %>%
  left_join(diabpbl, by = c("STUDYID", "USUBJID"))

run(dmt01, proc_data, summaryvars = c("AGE", "AGEGR1", "SEX", "ETHNIC", "RACE", "DIABPBL"), auto_pre = FALSE)
#>                                             A: Drug X              B: Placebo           C: Combination          All Patients
#>                                              (N=134)                (N=134)                (N=132)                (N=400)
#>   ——————————————————————————————————————————————————————————————————————————————————————————————————————————————————————————————
#>   Age
#>     n                                          134                    134                    132                    400
#>     Mean (SD)                               33.8 (6.6)             35.4 (7.9)             35.4 (7.7)             34.9 (7.4)
#>     Median                                     33.0                   35.0                   35.0                   34.0
#>     Min - Max                                21 - 50                21 - 62                20 - 69                20 - 69
#>   Age Group
#>     n                                          134                    134                    132                    400
#>     <65                                     134 (100%)             134 (100%)            131 (99.2%)            399 (99.8%)
#>     >=65                                        0                      0                   1 (0.8%)               1 (0.2%)
#>   Sex
#>     n                                          134                    134                    132                    400
#>     Male                                    55 (41.0%)             52 (38.8%)             62 (47.0%)            169 (42.2%)
#>     Female                                  79 (59.0%)             82 (61.2%)             70 (53.0%)            231 (57.8%)
#>   Ethnicity
#>     n                                          134                    134                    132                    400
#>     NOT REPORTED                             6 (4.5%)              10 (7.5%)              11 (8.3%)              27 (6.8%)
#>     HISPANIC OR LATINO                      15 (11.2%)             18 (13.4%)             15 (11.4%)             48 (12.0%)
#>     NOT HISPANIC OR LATINO                 104 (77.6%)            103 (76.9%)            101 (76.5%)            308 (77.0%)
#>     UNKNOWN                                  9 (6.7%)               3 (2.2%)               5 (3.8%)              17 (4.2%)
#>   RACE
#>     n                                          134                    134                    132                    400
#>     AMERICAN INDIAN OR ALASKA NATIVE         8 (6.0%)              11 (8.2%)               6 (4.5%)              25 (6.2%)
#>     ASIAN                                   68 (50.7%)             68 (50.7%)             73 (55.3%)            209 (52.2%)
#>     BLACK OR AFRICAN AMERICAN               31 (23.1%)             28 (20.9%)             32 (24.2%)             91 (22.8%)
#>     WHITE                                   27 (20.1%)             27 (20.1%)             21 (15.9%)             75 (18.8%)
#>   Analysis Value
#>     n                                          134                    134                    132                    400
#>     Mean (SD)                          48.601917 (7.961988)   50.441527 (7.948359)   51.106602 (7.790312)   50.044732 (7.952381)
#>     Median                                  48.418363              50.179334              50.803791              50.001320
#>     Min - Max                          27.71188 - 64.63737    21.68331 - 67.50825    29.74889 - 71.39897    21.68331 - 71.39897
Patient Disposition (DST01)
1. Patient Disposition
- The
dst01template produces the standard patient disposition summary. - The template includes the column of total by default. Use
lbl_overall = NULLto suppress the default.
run(dst01, syn_data, lbl_overall = NULL)
#>                                     A: Drug X    B: Placebo   C: Combination
#>                                      (N=134)      (N=134)        (N=132)
#>   ——————————————————————————————————————————————————————————————————————————
#>   Completed                         68 (50.7%)   66 (49.3%)     73 (55.3%)
#>   Ongoing                           24 (17.9%)   28 (20.9%)     21 (15.9%)
#>   Discontinued                      42 (31.3%)   40 (29.9%)     38 (28.8%)
#>     ADVERSE EVENT                    3 (2.2%)     6 (4.5%)       5 (3.8%)
#>     DEATH                           25 (18.7%)   23 (17.2%)     22 (16.7%)
#>     LACK OF EFFICACY                 2 (1.5%)     2 (1.5%)       3 (2.3%)
#>     PHYSICIAN DECISION               2 (1.5%)     3 (2.2%)       2 (1.5%)
#>     PROTOCOL VIOLATION               5 (3.7%)     3 (2.2%)       4 (3.0%)
#>     WITHDRAWAL BY PARENT/GUARDIAN    4 (3.0%)     2 (1.5%)       1 (0.8%)
#>     WITHDRAWAL BY SUBJECT            1 (0.7%)     1 (0.7%)       1 (0.8%)
2. Patient Disposition (with grouping of reasons)
- The syntax below produces the standard patient disposition summary with grouping of the discontinuation reasons.
- The variable [
ADSL.DCSREASGP] that groups the discontinuation reasons needs to be derived manually and provided in the inputadsldataset.
run(dst01, syn_data, detail_vars = list(Discontinued = c("DCSREASGP", "DCSREAS")), lbl_overall = NULL)
#>                                       A: Drug X    B: Placebo   C: Combination
#>                                        (N=134)      (N=134)        (N=132)
#>   ————————————————————————————————————————————————————————————————————————————
#>   Completed                           68 (50.7%)   66 (49.3%)     73 (55.3%)
#>   Ongoing                             24 (17.9%)   28 (20.9%)     21 (15.9%)
#>   Discontinued                        42 (31.3%)   40 (29.9%)     38 (28.8%)
#>     Safety
#>       ADVERSE EVENT                    3 (2.2%)     6 (4.5%)       5 (3.8%)
#>       DEATH                           25 (18.7%)   23 (17.2%)     22 (16.7%)
#>     Non-Safety
#>       LACK OF EFFICACY                 2 (1.5%)     2 (1.5%)       3 (2.3%)
#>       PHYSICIAN DECISION               2 (1.5%)     3 (2.2%)       2 (1.5%)
#>       PROTOCOL VIOLATION               5 (3.7%)     3 (2.2%)       4 (3.0%)
#>       WITHDRAWAL BY PARENT/GUARDIAN    4 (3.0%)     2 (1.5%)       1 (0.8%)
#>       WITHDRAWAL BY SUBJECT            1 (0.7%)     1 (0.7%)       1 (0.8%)
3. Patient Disposition (adding end of treatment status)
The syntax below adds the end of treatment status to the standard
patient disposition summary by providing the end of treatment status
variable to the argument trt_status_var.
run(dst01, syn_data, trt_status_var = "EOTSTT", lbl_overall = NULL)
#>                                     A: Drug X    B: Placebo   C: Combination
#>                                      (N=134)      (N=134)        (N=132)
#>   ——————————————————————————————————————————————————————————————————————————
#>   Completed                         68 (50.7%)   66 (49.3%)     73 (55.3%)
#>   Ongoing                           24 (17.9%)   28 (20.9%)     21 (15.9%)
#>   Discontinued                      42 (31.3%)   40 (29.9%)     38 (28.8%)
#>     ADVERSE EVENT                    3 (2.2%)     6 (4.5%)       5 (3.8%)
#>     DEATH                           25 (18.7%)   23 (17.2%)     22 (16.7%)
#>     LACK OF EFFICACY                 2 (1.5%)     2 (1.5%)       3 (2.3%)
#>     PHYSICIAN DECISION               2 (1.5%)     3 (2.2%)       2 (1.5%)
#>     PROTOCOL VIOLATION               5 (3.7%)     3 (2.2%)       4 (3.0%)
#>     WITHDRAWAL BY PARENT/GUARDIAN    4 (3.0%)     2 (1.5%)       1 (0.8%)
#>     WITHDRAWAL BY SUBJECT            1 (0.7%)     1 (0.7%)       1 (0.8%)
#>   Completed Treatment               47 (35.1%)   35 (26.1%)     42 (31.8%)
#>   Ongoing Treatment                 39 (29.1%)   46 (34.3%)     46 (34.8%)
#>   Discontinued Treatment            48 (35.8%)   53 (39.6%)     44 (33.3%)
4. Patient Disposition (adding details of study ongoing status)
The syntax adds the details of study ongoing/alive status to the
standard patient disposition summary by modifying the argument
detail_vars.
run(dst01, syn_data, detail_vars = list(Discontinued = "DCSREAS", Ongoing = "STDONS"))
#>                                     A: Drug X    B: Placebo   C: Combination   All Patients
#>                                      (N=134)      (N=134)        (N=132)         (N=400)
#>   —————————————————————————————————————————————————————————————————————————————————————————
#>   Completed                         68 (50.7%)   66 (49.3%)     73 (55.3%)     207 (51.7%)
#>   Ongoing                           24 (17.9%)   28 (20.9%)     21 (15.9%)      73 (18.2%)
#>     Alive: Ongoing                   8 (6.0%)     6 (4.5%)       8 (6.1%)       22 (5.5%)
#>     Alive: In Follow-up             16 (11.9%)   22 (16.4%)     13 (9.8%)       51 (12.8%)
#>   Discontinued                      42 (31.3%)   40 (29.9%)     38 (28.8%)     120 (30.0%)
#>     ADVERSE EVENT                    3 (2.2%)     6 (4.5%)       5 (3.8%)       14 (3.5%)
#>     DEATH                           25 (18.7%)   23 (17.2%)     22 (16.7%)      70 (17.5%)
#>     LACK OF EFFICACY                 2 (1.5%)     2 (1.5%)       3 (2.3%)        7 (1.8%)
#>     PHYSICIAN DECISION               2 (1.5%)     3 (2.2%)       2 (1.5%)        7 (1.8%)
#>     PROTOCOL VIOLATION               5 (3.7%)     3 (2.2%)       4 (3.0%)       12 (3.0%)
#>     WITHDRAWAL BY PARENT/GUARDIAN    4 (3.0%)     2 (1.5%)       1 (0.8%)        7 (1.8%)
#>     WITHDRAWAL BY SUBJECT            1 (0.7%)     1 (0.7%)       1 (0.8%)        3 (0.8%)
Deaths (DTHT01)
1. Deaths
The dtht01 template produces the
standard deaths output.
run(dst01, syn_data)
#>                                     A: Drug X    B: Placebo   C: Combination   All Patients
#>                                      (N=134)      (N=134)        (N=132)         (N=400)
#>   —————————————————————————————————————————————————————————————————————————————————————————
#>   Completed                         68 (50.7%)   66 (49.3%)     73 (55.3%)     207 (51.7%)
#>   Ongoing                           24 (17.9%)   28 (20.9%)     21 (15.9%)      73 (18.2%)
#>   Discontinued                      42 (31.3%)   40 (29.9%)     38 (28.8%)     120 (30.0%)
#>     ADVERSE EVENT                    3 (2.2%)     6 (4.5%)       5 (3.8%)       14 (3.5%)
#>     DEATH                           25 (18.7%)   23 (17.2%)     22 (16.7%)      70 (17.5%)
#>     LACK OF EFFICACY                 2 (1.5%)     2 (1.5%)       3 (2.3%)        7 (1.8%)
#>     PHYSICIAN DECISION               2 (1.5%)     3 (2.2%)       2 (1.5%)        7 (1.8%)
#>     PROTOCOL VIOLATION               5 (3.7%)     3 (2.2%)       4 (3.0%)       12 (3.0%)
#>     WITHDRAWAL BY PARENT/GUARDIAN    4 (3.0%)     2 (1.5%)       1 (0.8%)        7 (1.8%)
#>     WITHDRAWAL BY SUBJECT            1 (0.7%)     1 (0.7%)       1 (0.8%)        3 (0.8%)
2. Deaths (adding “Primary Cause of Death” details for ‘Other’ category)
run(dtht01, syn_data, other_category = TRUE)
#>                                       A: Drug X    B: Placebo   C: Combination
#>                                        (N=134)      (N=134)        (N=132)
#>   ————————————————————————————————————————————————————————————————————————————
#>   Total number of deaths              25 (18.7%)   23 (17.2%)     22 (16.7%)
#>   Primary Cause of Death
#>     n                                     25           23             22
#>     Adverse Event                     9 (36.0%)    7 (30.4%)      10 (45.5%)
#>     Progressive Disease               8 (32.0%)    6 (26.1%)      6 (27.3%)
#>     Other                             8 (32.0%)    10 (43.5%)     6 (27.3%)
#>       LOST TO FOLLOW UP                2 (8.3%)     2 (8.3%)       2 (8.3%)
#>       MISSING                          2 (8.3%)    3 (12.5%)       2 (8.3%)
#>       Post-study reporting of death    1 (4.2%)     2 (8.3%)       1 (4.2%)
#>       SUICIDE                          2 (8.3%)     2 (8.3%)       1 (4.2%)
#>       UNKNOWN                          1 (4.2%)     1 (4.2%)          0
NOTE: In order to avoid the warning above and display ‘Other’ as the
last category under “Primary Cause of Death” right above the detailed
reasons for “Other”, the user is expected to manually provide levels to
ADSL.DTHCAT based on categories available in the
dataset.
3. Deaths (adding summary by days from last study drug administration)
Setting time_since_last_dose to TRUE, the
syntax produces the count of deaths by days from last study drug
administration as well as the count of deaths by primary cause and days
from last study drug administration.
run(dtht01, syn_data, time_since_last_dose = TRUE)
#>                                                               A: Drug X    B: Placebo   C: Combination
#>                                                                (N=134)      (N=134)        (N=132)
#>   ————————————————————————————————————————————————————————————————————————————————————————————————————
#>   Total number of deaths                                      25 (18.7%)   23 (17.2%)     22 (16.7%)
#>   Days from last drug administration
#>     n                                                             25           23             22
#>     <=30                                                      14 (56.0%)   11 (47.8%)     14 (63.6%)
#>     >30                                                       11 (44.0%)   12 (52.2%)     8 (36.4%)
#>   Primary cause by days from last study drug administration
#>     <=30
#>       n                                                           14           11             14
#>       Adverse Event                                           4 (28.6%)    2 (18.2%)      6 (42.9%)
#>       Progressive Disease                                     6 (42.9%)    3 (27.3%)      4 (28.6%)
#>       Other                                                   4 (28.6%)    6 (54.5%)      4 (28.6%)
#>     >30
#>       n                                                           11           12             8
#>       Adverse Event                                           5 (45.5%)    5 (41.7%)      4 (50.0%)
#>       Progressive Disease                                     2 (18.2%)    3 (25.0%)      2 (25.0%)
#>       Other                                                   4 (36.4%)    4 (33.3%)      2 (25.0%)
ECG Results and Change from Baseline by Visit
(EGT01)
1. ECG Results and Change from Baseline by Visit
The egt01 template produces the
standard ECG results and change from baseline by visit summary.
run(egt01, syn_data)
#> A: Drug X B: Placebo C: Combination
#> Change from Change from Change from
#> Value at Visit Baseline Value at Visit Baseline Value at Visit Baseline
#> Analysis Visit (N=134) (N=134) (N=134) (N=134) (N=132) (N=132)
#> —————————————————————————————————————————————————————————————————————————————————————————————————————————————————————————————————————————————
#> Heart Rate
#> BASELINE
#> n 134 134 132
#> Mean (SD) 71.447 (17.932) 69.829 (20.717) 69.341 (20.948)
#> Median 72.697 73.352 71.956
#> Min - Max 9.09 - 106.91 13.49 - 115.52 11.63 - 115.49
#> WEEK 1 DAY 8
#> n 134 134 134 134 132 132
#> Mean (SD) 70.191 (20.274) -1.257 (25.966) 69.427 (20.799) -0.401 (29.735) 68.654 (18.064) -0.687 (27.807)
#> Median 70.703 -2.197 70.462 -0.520 68.573 -0.760
#> Min - Max 8.53 - 127.50 -50.97 - 89.16 16.85 - 129.14 -68.18 - 88.38 16.87 - 115.60 -68.25 - 67.20
#> WEEK 2 DAY 15
#> n 134 134 134 134 132 132
#> Mean (SD) 70.317 (19.561) -1.130 (26.262) 71.108 (20.556) 1.279 (31.353) 69.193 (18.056) -0.148 (28.606)
#> Median 70.885 -1.105 72.524 -0.311 69.304 -1.548
#> Min - Max 17.14 - 116.32 -85.03 - 67.52 9.22 - 120.54 -73.07 - 81.44 29.62 - 120.50 -67.75 - 66.29
#> WEEK 3 DAY 22
#> n 134 134 134 134 132 132
#> Mean (SD) 68.251 (20.168) -3.196 (28.657) 68.947 (20.558) -0.881 (30.142) 70.884 (20.280) 1.543 (27.285)
#> Median 68.787 -2.167 67.802 1.195 70.124 0.139
#> Min - Max 13.33 - 131.73 -81.20 - 72.57 23.98 - 130.41 -73.03 - 103.31 20.91 - 116.79 -64.51 - 72.52
#> WEEK 4 DAY 29
#> n 134 134 134 134 132 132
#> Mean (SD) 70.063 (18.410) -1.385 (26.595) 71.601 (20.336) 1.772 (30.262) 71.020 (20.591) 1.679 (29.597)
#> Median 69.330 -4.535 72.211 -0.884 70.523 3.811
#> Min - Max 22.30 - 116.51 -58.07 - 77.32 17.53 - 129.06 -64.32 - 85.34 10.35 - 117.30 -65.91 - 105.67
#> WEEK 5 DAY 36
#> n 134 134 134 134 132 132
#> Mean (SD) 66.406 (19.745) -5.041 (27.112) 71.252 (18.923) 1.423 (27.084) 71.257 (18.563) 1.916 (29.591)
#> Median 65.405 -6.827 70.858 0.637 73.292 1.735
#> Min - Max 23.89 - 110.38 -73.26 - 57.24 25.86 - 125.73 -71.15 - 67.37 23.89 - 117.19 -58.23 - 68.86
#> QT Duration
#> BASELINE
#> n 134 134 132
#> Mean (SD) 336.834 (117.958) 351.004 (98.436) 352.598 (105.114)
#> Median 344.414 351.480 347.956
#> Min - Max 86.98 - 665.40 98.90 - 641.92 105.68 - 628.14
#> WEEK 1 DAY 8
#> n 134 134 134 134 132 132
#> Mean (SD) 342.574 (101.093) 5.741 (159.936) 363.946 (102.338) 12.943 (140.729) 359.424 (105.161) 6.826 (147.129)
#> Median 347.264 -1.779 356.539 13.730 363.838 8.685
#> Min - Max 91.63 - 591.42 -346.44 - 452.75 114.92 - 656.45 -317.53 - 416.35 51.91 - 611.88 -473.19 - 358.00
#> WEEK 2 DAY 15
#> n 134 134 134 134 132 132
#> Mean (SD) 353.244 (93.926) 16.410 (162.103) 345.926 (96.783) -5.078 (152.509) 335.689 (98.605) -16.909 (138.448)
#> Median 351.099 16.722 346.831 -9.681 320.957 -22.267
#> Min - Max 138.01 - 587.30 -414.07 - 389.16 146.42 - 556.07 -440.28 - 364.76 104.91 - 562.34 -326.55 - 325.27
#> WEEK 3 DAY 22
#> n 134 134 134 134 132 132
#> Mean (SD) 370.115 (101.568) 33.282 (152.780) 343.412 (102.585) -7.592 (138.803) 346.947 (94.965) -5.652 (144.651)
#> Median 378.209 39.586 335.119 -15.888 352.154 9.113
#> Min - Max 118.14 - 615.18 -391.72 - 520.09 63.37 - 566.51 -311.28 - 293.76 126.09 - 580.81 -412.11 - 410.01
#> WEEK 4 DAY 29
#> n 134 134 134 134 132 132
#> Mean (SD) 345.774 (95.970) 8.941 (145.647) 354.377 (108.286) 3.374 (142.390) 341.358 (106.745) -11.240 (145.648)
#> Median 340.134 5.576 346.699 -17.129 352.295 -11.868
#> Min - Max 110.12 - 616.58 -393.34 - 456.04 80.82 - 687.69 -439.90 - 364.80 4.95 - 570.61 -480.94 - 330.67
#> WEEK 5 DAY 36
#> n 134 134 134 134 132 132
#> Mean (SD) 358.903 (97.693) 22.069 (155.681) 338.648 (99.260) -12.356 (130.457) 349.303 (95.769) -3.296 (135.997)
#> Median 351.959 5.886 344.167 0.405 350.319 12.680
#> Min - Max 88.38 - 661.12 -353.30 - 539.84 31.25 - 563.90 -338.85 - 352.75 119.02 - 581.83 -311.45 - 295.53
#> RR Duration
#> BASELINE
#> n 134 134 132
#> Mean (SD) 1028.419 (286.385) 1027.484 (324.000) 1074.623 (277.328)
#> Median 1041.860 1047.268 1080.866
#> Min - Max 34.33 - 1783.71 5.29 - 1877.19 289.60 - 1617.06
#> WEEK 1 DAY 8
#> n 134 134 134 134 132 132
#> Mean (SD) 990.155 (318.736) -38.264 (446.403) 1061.587 (269.138) 34.103 (401.759) 1039.642 (284.389) -34.981 (406.037)
#> Median 963.881 -86.501 1061.504 66.914 1014.780 -97.826
#> Min - Max 110.82 - 2014.56 -1014.82 - 1389.40 276.83 - 1711.99 -942.16 - 993.82 498.21 - 1937.47 -958.61 - 908.90
#> WEEK 2 DAY 15
#> n 134 134 134 134 132 132
#> Mean (SD) 1013.371 (304.135) -15.047 (425.807) 1109.402 (318.227) 81.918 (453.105) 1045.209 (277.506) -29.414 (380.841)
#> Median 1040.693 40.485 1117.764 69.275 1034.637 -15.331
#> Min - Max 164.19 - 1677.10 -1216.10 - 1053.15 160.73 - 2048.73 -1127.10 - 1148.61 252.84 - 1722.33 -859.27 - 871.54
#> WEEK 3 DAY 22
#> n 134 134 134 134 132 132
#> Mean (SD) 1013.987 (304.990) -14.431 (406.529) 1118.345 (296.527) 90.861 (409.573) 1036.593 (268.521) -38.030 (421.484)
#> Median 1027.232 -50.543 1134.596 52.029 1030.717 -60.720
#> Min - Max 357.04 - 1798.65 -882.94 - 1080.26 97.14 - 1825.43 -887.06 - 1166.15 446.02 - 1713.38 -984.79 - 902.37
#> WEEK 4 DAY 29
#> n 134 134 134 134 132 132
#> Mean (SD) 1033.309 (313.919) 4.890 (483.153) 1079.762 (298.940) 52.278 (429.253) 1027.549 (295.856) -47.074 (378.235)
#> Median 1050.399 5.601 1051.613 69.554 1023.360 -49.519
#> Min - Max 54.33 - 1979.43 -1345.93 - 1195.41 347.94 - 1762.04 -826.43 - 1191.83 341.62 - 2144.86 -1002.03 - 1048.66
#> WEEK 5 DAY 36
#> n 134 134 134 134 132 132
#> Mean (SD) 1072.335 (282.901) 43.916 (379.048) 1058.452 (271.012) 30.968 (436.030) 1029.043 (271.211) -45.580 (405.528)
#> Median 1067.330 55.872 1068.950 33.615 1065.256 -34.395
#> Min - Max 352.97 - 2000.56 -1028.79 - 1418.57 208.83 - 1794.73 -978.97 - 1365.13 436.28 - 1794.07 -962.18 - 1329.88
ECG Abnormalities (Regardless of Abnormality at Baseline)
(EGT02_1)
1. ECG Abnormalities (Regardless of Abnormality at Baseline)
The egt02_1 template produces the
standard ECG abnormalities summary where the abnormalities are
summarized regardless of the abnormality at baseline.
run(egt02_1, syn_data)
#>   Assessment       A: Drug X        B: Placebo     C: Combination
#>    Abnormality      (N=134)          (N=134)          (N=132)
#>   ———————————————————————————————————————————————————————————————
#>   Heart Rate
#>     Low          49/134 (36.6%)   57/134 (42.5%)   55/132 (41.7%)
#>     High         48/134 (35.8%)   51/134 (38.1%)   48/132 (36.4%)
#>   QT Duration
#>     Low          53/134 (39.6%)   56/134 (41.8%)   54/132 (40.9%)
#>     High         45/134 (33.6%)   51/134 (38.1%)   45/132 (34.1%)
#>   RR Duration
#>     Low          56/134 (41.8%)   41/134 (30.6%)   50/132 (37.9%)
#>     High         39/134 (29.1%)   62/134 (46.3%)   41/132 (31.1%)
ECG Abnormalities (Among Subject Without Abnormality at
Baseline) (EGT02_2)
1. ECG Abnormalities (Among Subject Without Abnormality at Baseline)
The egt02_2 template produces the
standard ECG abnormalities summary where the abnormalities are
summarized among subject without abnormality at baseline.
run(egt02_2, syn_data)
#>   Assessment       A: Drug X        B: Placebo     C: Combination
#>    Abnormality      (N=134)          (N=134)          (N=132)
#>   ———————————————————————————————————————————————————————————————
#>   Heart Rate
#>     Low          43/128 (33.6%)   47/124 (37.9%)   40/117 (34.2%)
#>     High         41/127 (32.3%)   46/129 (35.7%)   38/122 (31.1%)
#>   QT Duration
#>     Low          32/113 (28.3%)   48/126 (38.1%)   46/124 (37.1%)
#>     High         36/125 (28.8%)   47/130 (36.2%)   33/119 (27.7%)
#>   RR Duration
#>     Low          51/129 (39.5%)   30/123 (24.4%)   44/126 (34.9%)
#>     High         32/127 (25.2%)    50/122 (41%)    34/125 (27.2%)
Shift Table of ECG Interval Data - Baseline versus
Minimum/Maximum Post-Baseline (EGT03)
1. Shift Table of ECG Interval Data - Baseline versus Minimum Post-Baseline
The egt03 template produces the
standard shift table of ECG interval data - baseline versus minimum
post-baseline summary.
proc_data <- log_filter(syn_data, PARAMCD == "HR", "adeg")
run(egt03, proc_data)
#>   Actual Arm Code                            Minimum Post-Baseline Assessment
#>     Baseline Reference Range Indicator       LOW         NORMAL     HIGH   Missing
#>   ————————————————————————————————————————————————————————————————————————————————
#>   Heart Rate
#>     ARM A (N=134)
#>       LOW                                 1 (0.7%)      5 (3.7%)     0        0
#>       NORMAL                             36 (26.9%)    85 (63.4%)    0        0
#>       HIGH                                3 (2.2%)      4 (3.0%)     0        0
#>       Missing                                 0            0         0        0
#>     ARM B (N=134)
#>       LOW                                 1 (0.7%)      9 (6.7%)     0        0
#>       NORMAL                             41 (30.6%)    78 (58.2%)    0        0
#>       HIGH                                1 (0.7%)      4 (3.0%)     0        0
#>       Missing                                 0            0         0        0
#>     ARM C (N=132)
#>       LOW                                 4 (3.0%)     11 (8.3%)     0        0
#>       NORMAL                             32 (24.2%)    75 (56.8%)    0        0
#>       HIGH                                1 (0.8%)      9 (6.8%)     0        0
#>       Missing                                 0            0         0        0
ECG Actual Values and Changes from Baseline by Visit
(EGT05_QTCAT)
1. ECG Actual Values and Changes from Baseline by Visit
The egt05_qtcat template produces the
standard ECG actual values and changes from baseline by visit
summary.
run(egt05_qtcat, syn_data)
#>   Parameter
#>     Analysis Visit            A: Drug X    B: Placebo    C: Combination
#>       Category                 (N=134)       (N=134)        (N=132)
#>   —————————————————————————————————————————————————————————————————————
#>   QT Duration
#>     BASELINE
#>       Value at Visit
#>         n                        134           134            132
#>         <=450 msec           115 (85.8%)   117 (87.3%)    104 (78.8%)
#>         >450 to <=480 msec    6 (4.5%)      10 (7.5%)       9 (6.8%)
#>         >480 to <=500 msec    4 (3.0%)      3 (2.2%)        6 (4.5%)
#>         >500 msec             9 (6.7%)      4 (3.0%)       13 (9.8%)
#>     WEEK 1 DAY 8
#>       Value at Visit
#>         n                        134           134            132
#>         <=450 msec           113 (84.3%)   106 (79.1%)    106 (80.3%)
#>         >450 to <=480 msec    10 (7.5%)     10 (7.5%)      11 (8.3%)
#>         >480 to <=500 msec    4 (3.0%)      4 (3.0%)        3 (2.3%)
#>         >500 msec             7 (5.2%)     14 (10.4%)      12 (9.1%)
#>       Change from Baseline
#>         n                        134           134            132
#>         <=30 msec            76 (56.7%)    75 (56.0%)      75 (56.8%)
#>         >30 to <=60 msec      7 (5.2%)      13 (9.7%)      11 (8.3%)
#>         >60 msec             51 (38.1%)    46 (34.3%)      46 (34.8%)
#>     WEEK 2 DAY 15
#>       Value at Visit
#>         n                        134           134            132
#>         <=450 msec           111 (82.8%)   114 (85.1%)    112 (84.8%)
#>         >450 to <=480 msec    10 (7.5%)     9 (6.7%)        9 (6.8%)
#>         >480 to <=500 msec    7 (5.2%)      2 (1.5%)        5 (3.8%)
#>         >500 msec             6 (4.5%)      9 (6.7%)        6 (4.5%)
#>       Change from Baseline
#>         n                        134           134            132
#>         <=30 msec            71 (53.0%)    87 (64.9%)      89 (67.4%)
#>         >30 to <=60 msec      11 (8.2%)     9 (6.7%)        9 (6.8%)
#>         >60 msec             52 (38.8%)    38 (28.4%)      34 (25.8%)
#>     WEEK 3 DAY 22
#>       Value at Visit
#>         n                        134           134            132
#>         <=450 msec           106 (79.1%)   112 (83.6%)    118 (89.4%)
#>         >450 to <=480 msec    13 (9.7%)     7 (5.2%)        3 (2.3%)
#>         >480 to <=500 msec    4 (3.0%)      5 (3.7%)        2 (1.5%)
#>         >500 msec             11 (8.2%)     10 (7.5%)       9 (6.8%)
#>       Change from Baseline
#>         n                        134           134            132
#>         <=30 msec            63 (47.0%)    80 (59.7%)      81 (61.4%)
#>         >30 to <=60 msec     14 (10.4%)     8 (6.0%)       11 (8.3%)
#>         >60 msec             57 (42.5%)    46 (34.3%)      40 (30.3%)
#>     WEEK 4 DAY 29
#>       Value at Visit
#>         n                        134           134            132
#>         <=450 msec           117 (87.3%)   103 (76.9%)    114 (86.4%)
#>         >450 to <=480 msec    7 (5.2%)     14 (10.4%)       6 (4.5%)
#>         >480 to <=500 msec    4 (3.0%)      7 (5.2%)        3 (2.3%)
#>         >500 msec             6 (4.5%)      10 (7.5%)       9 (6.8%)
#>       Change from Baseline
#>         n                        134           134            132
#>         <=30 msec            79 (59.0%)    80 (59.7%)      79 (59.8%)
#>         >30 to <=60 msec      11 (8.2%)     7 (5.2%)       10 (7.6%)
#>         >60 msec             44 (32.8%)    47 (35.1%)      43 (32.6%)
#>     WEEK 5 DAY 36
#>       Value at Visit
#>         n                        134           134            132
#>         <=450 msec           107 (79.9%)   117 (87.3%)    112 (84.8%)
#>         >450 to <=480 msec   16 (11.9%)     5 (3.7%)       13 (9.8%)
#>         >480 to <=500 msec    5 (3.7%)      9 (6.7%)        3 (2.3%)
#>         >500 msec             6 (4.5%)      3 (2.2%)        4 (3.0%)
#>       Change from Baseline
#>         n                        134           134            132
#>         <=30 msec            72 (53.7%)    82 (61.2%)      73 (55.3%)
#>         >30 to <=60 msec      10 (7.5%)     11 (8.2%)      11 (8.3%)
#>         >60 msec             52 (38.8%)    41 (30.6%)      48 (36.4%)
2. ECG Actual Values and Changes from Baseline by Visit (removing default analyses)
The template have two default analyses of ADEG.AVALCAT1
and ADEG.CHGCAT1. To keep only the analyses needed, this
can be achieved by modifying the parameter summaryvars.
run(egt05_qtcat, syn_data, summaryvars = c("AVALCAT1"))
#>   Parameter
#>     Analysis Visit          A: Drug X    B: Placebo    C: Combination
#>       Category               (N=134)       (N=134)        (N=132)
#>   ———————————————————————————————————————————————————————————————————
#>   QT Duration
#>     BASELINE
#>       n                        134           134            132
#>       <=450 msec           115 (85.8%)   117 (87.3%)    104 (78.8%)
#>       >450 to <=480 msec    6 (4.5%)      10 (7.5%)       9 (6.8%)
#>       >480 to <=500 msec    4 (3.0%)      3 (2.2%)        6 (4.5%)
#>       >500 msec             9 (6.7%)      4 (3.0%)       13 (9.8%)
#>     WEEK 1 DAY 8
#>       n                        134           134            132
#>       <=450 msec           113 (84.3%)   106 (79.1%)    106 (80.3%)
#>       >450 to <=480 msec    10 (7.5%)     10 (7.5%)      11 (8.3%)
#>       >480 to <=500 msec    4 (3.0%)      4 (3.0%)        3 (2.3%)
#>       >500 msec             7 (5.2%)     14 (10.4%)      12 (9.1%)
#>     WEEK 2 DAY 15
#>       n                        134           134            132
#>       <=450 msec           111 (82.8%)   114 (85.1%)    112 (84.8%)
#>       >450 to <=480 msec    10 (7.5%)     9 (6.7%)        9 (6.8%)
#>       >480 to <=500 msec    7 (5.2%)      2 (1.5%)        5 (3.8%)
#>       >500 msec             6 (4.5%)      9 (6.7%)        6 (4.5%)
#>     WEEK 3 DAY 22
#>       n                        134           134            132
#>       <=450 msec           106 (79.1%)   112 (83.6%)    118 (89.4%)
#>       >450 to <=480 msec    13 (9.7%)     7 (5.2%)        3 (2.3%)
#>       >480 to <=500 msec    4 (3.0%)      5 (3.7%)        2 (1.5%)
#>       >500 msec             11 (8.2%)     10 (7.5%)       9 (6.8%)
#>     WEEK 4 DAY 29
#>       n                        134           134            132
#>       <=450 msec           117 (87.3%)   103 (76.9%)    114 (86.4%)
#>       >450 to <=480 msec    7 (5.2%)     14 (10.4%)       6 (4.5%)
#>       >480 to <=500 msec    4 (3.0%)      7 (5.2%)        3 (2.3%)
#>       >500 msec             6 (4.5%)      10 (7.5%)       9 (6.8%)
#>     WEEK 5 DAY 36
#>       n                        134           134            132
#>       <=450 msec           107 (79.9%)   117 (87.3%)    112 (84.8%)
#>       >450 to <=480 msec   16 (11.9%)     5 (3.7%)       13 (9.8%)
#>       >480 to <=500 msec    5 (3.7%)      9 (6.7%)        3 (2.3%)
#>       >500 msec             6 (4.5%)      3 (2.2%)        4 (3.0%)
Study Drug Exposure (EXT01)
1. Study Drug Exposure
- The
ext01template displays total number of doses administered and total dose administered by default - The template does not include the column of total by default
run(ext01, syn_data)
#>                                  A: Drug X        B: Placebo      C: Combination
#>   PARCAT2                         (N=134)           (N=134)           (N=132)
#>   ———————————————————————————————————————————————————————————————————————————————
#>   Drug A
#>     Overall duration (days)
#>       n                             75                67                75
#>       Mean (SD)                121.5 (70.7)      131.2 (78.5)      130.5 (73.1)
#>       Median                       116.0             127.0             126.0
#>       Min - Max                15.0 - 249.0       1.0 - 250.0       1.0 - 246.0
#>     Total dose administered
#>       n                             75                67                75
#>       Mean (SD)               6675.2 (1110.9)   6505.1 (1249.3)   6982.4 (1272.5)
#>       Median                      6720.0            6480.0            7200.0
#>       Min - Max               4800.0 - 9360.0   4080.0 - 9360.0   4320.0 - 9360.0
#>   Drug B
#>     Overall duration (days)
#>       n                             59                67                57
#>       Mean (SD)                111.0 (69.4)      113.7 (68.9)      137.5 (74.4)
#>       Median                       98.0              104.0             144.0
#>       Min - Max                 9.0 - 245.0       2.0 - 247.0      15.0 - 250.0
#>     Total dose administered
#>       n                             59                67                57
#>       Mean (SD)               6630.5 (1334.0)   6297.3 (1291.1)   6505.3 (1080.7)
#>       Median                      6720.0            6240.0            6480.0
#>       Min - Max               4320.0 - 8880.0   4080.0 - 9120.0   4320.0 - 8640.0
Laboratory Test Results and Change from Baseline by Visit
(LBT01)
1. Laboratory Test Results and Change from Baseline by Visit
- The
lbt01template produces the standard laboratory test results and change from baseline by visit. - To select the SI/CV/LS results and the panel (chemistry/hematology/urinalysis/coagulation etc.) to display, user defines individual filters and apply to input datasets prior to running CHEVRON.
t_lb_chg <- run(lbt01, syn_data)
head(t_lb_chg, 20)
#>                                                     A: Drug X                        B: Placebo                      C: Combination
#>                                                            Change from                       Change from                       Change from
#>                                          Value at Visit      Baseline      Value at Visit      Baseline      Value at Visit      Baseline
#>                                             (N=134)          (N=134)          (N=134)          (N=134)          (N=132)          (N=132)
#>   ——————————————————————————————————————————————————————————————————————————————————————————————————————————————————————————————————————————
#>   Alanine Aminotransferase Measurement
#>     BASELINE
#>       n                                       134                               134                               132
#>       Mean (SD)                          19.786 (4.161)                    20.153 (4.171)                    20.451 (3.911)
#>       Median                                 19.786                            20.077                            20.387
#>       Min - Max                           6.99 - 30.43                      8.11 - 34.56                      8.82 - 28.72
#>     WEEK 1 DAY 8
#>       n                                       134              134              134              134              132              132
#>       Mean (SD)                          19.301 (3.981)   -0.485 (5.850)   20.221 (3.974)   0.068 (6.036)    20.553 (3.895)   0.102 (5.461)
#>       Median                                 19.209           -0.511           20.090           -0.725           20.402           0.025
#>       Min - Max                           8.86 - 27.32    -12.52 - 19.70    5.84 - 28.75    -12.29 - 17.41    9.87 - 30.70    -13.69 - 15.54
#>     WEEK 2 DAY 15
#>       n                                       134              134              134              134              132              132
#>       Mean (SD)                          19.704 (4.233)   -0.082 (6.003)   20.123 (4.265)   -0.030 (6.263)   19.247 (3.592)   -1.204 (5.485)
#>       Median                                 19.168           0.038            19.986           -0.371           19.608           -0.482
#>       Min - Max                           7.17 - 30.53    -13.15 - 17.17    7.19 - 30.54    -18.37 - 14.39    8.11 - 26.68    -14.28 - 15.65
#>     WEEK 3 DAY 22
#>       n                                       134              134              134              134              132              132
#>       Mean (SD)                          20.130 (3.757)   0.344 (5.761)    19.837 (3.871)   -0.316 (5.604)   19.428 (3.944)   -1.023 (5.550)
#>       Median                                 20.044           0.451            19.873           -0.178           18.838           -1.065
Laboratory Abnormalities (LBT04)
1. Laboratory Abnormalities
- The
lbt04template produces the standard laboratory abnormalities summary. - The template subsets to SI results by default.
- The laboratory tests and directions of abnormality in this template is data-driven. Table entries provide the number of patients with a during treatment laboratory value abnormality in the direction specified among patients without this abnormality at baseline.
run(lbt04, syn_data)
#>   Laboratory Test                           A: Drug X      B: Placebo    C: Combination
#>       Direction of Abnormality               (N=134)        (N=134)         (N=132)
#>   —————————————————————————————————————————————————————————————————————————————————————
#>   CHEMISTRY
#>     Alanine Aminotransferase Measurement
#>       Low                                  7/45 (15.6%)   6/51 (11.8%)    4/61 (6.6%)
#>       High                                 4/45 (8.9%)    6/45 (13.3%)    4/62 (6.5%)
#>     C-Reactive Protein Measurement
#>       Low                                  6/55 (10.9%)   5/61 (8.2%)     6/51 (11.8%)
#>       High                                 6/53 (11.3%)   7/55 (12.7%)    2/48 (4.2%)
#>     Immunoglobulin A Measurement
#>       Low                                  4/43 (9.3%)    9/51 (17.6%)    8/52 (15.4%)
#>       High                                 7/42 (16.7%)   7/49 (14.3%)    5/52 (9.6%)
#>   COAGULATION
#>     Alanine Aminotransferase Measurement
#>       Low                                  4/54 (7.4%)    5/53 (9.4%)     4/48 (8.3%)
#>       High                                 9/53 (17.0%)   7/50 (14.0%)    6/48 (12.5%)
#>     C-Reactive Protein Measurement
#>       Low                                  7/56 (12.5%)   5/48 (10.4%)    5/50 (10.0%)
#>       High                                 8/52 (15.4%)   3/46 (6.5%)     5/46 (10.9%)
#>     Immunoglobulin A Measurement
#>       Low                                  8/50 (16.0%)   8/57 (14.0%)    2/54 (3.7%)
#>       High                                 6/48 (12.5%)   8/65 (12.3%)    2/52 (3.8%)
#>   HEMATOLOGY
#>     Alanine Aminotransferase Measurement
#>       Low                                  3/48 (6.2%)    4/46 (8.7%)     6/59 (10.2%)
#>       High                                 5/47 (10.6%)   7/45 (15.6%)    8/55 (14.5%)
#>     C-Reactive Protein Measurement
#>       Low                                  6/49 (12.2%)   6/45 (13.3%)   11/57 (19.3%)
#>       High                                 3/44 (6.8%)    3/46 (6.5%)     6/53 (11.3%)
#>     Immunoglobulin A Measurement
#>       Low                                  5/56 (8.9%)    8/53 (15.1%)    9/50 (18.0%)
#>       High                                 7/57 (12.3%)   4/56 (7.1%)    10/52 (19.2%)
Laboratory Abnormalities with Single and Replicated Marked
(LBT05)
1. Laboratory Abnormalities with Single and Replicated Marked
- The
lbt05template produces the standard laboratory abnormalities summary for marked abnormalities. - The laboratory tests and directions of abnormality in this template is currently data-driven. The standard metadata for Safety Lab Standardization will be incorporated in future release.
run(lbt05, syn_data)
#>   Laboratory Test                            A: Drug X   B: Placebo   C: Combination
#>       Direction of Abnormality                (N=134)     (N=134)        (N=132)
#>   ——————————————————————————————————————————————————————————————————————————————————
#>   Alanine Aminotransferase Measurement (n)      119         122            111
#>     Low
#>       Single, not last                       1 (0.8%)     2 (1.6%)       2 (1.8%)
#>       Last or replicated                     2 (1.7%)     7 (5.7%)          0
#>       Any Abnormality                        3 (2.5%)     9 (7.4%)       2 (1.8%)
#>     High
#>       Single, not last                       4 (3.4%)     4 (3.3%)       1 (0.9%)
#>       Last or replicated                     2 (1.7%)     5 (4.1%)       4 (3.6%)
#>       Any Abnormality                        6 (5.0%)     9 (7.4%)       5 (4.5%)
#>   C-Reactive Protein Measurement (n)            124         114            114
#>     Low
#>       Single, not last                       1 (0.8%)        0           3 (2.6%)
#>       Last or replicated                     5 (4.0%)     6 (5.3%)       2 (1.8%)
#>       Any Abnormality                        6 (4.8%)     6 (5.3%)       5 (4.4%)
#>     High
#>       Single, not last                       2 (1.6%)     1 (0.9%)       2 (1.8%)
#>       Last or replicated                     5 (4.0%)     5 (4.4%)       5 (4.4%)
#>       Any Abnormality                        7 (5.6%)     6 (5.3%)       7 (6.1%)
#>   Immunoglobulin A Measurement (n)              112         116            113
#>     Low
#>       Single, not last                       1 (0.9%)     3 (2.6%)       4 (3.5%)
#>       Last or replicated                     4 (3.6%)     3 (2.6%)       2 (1.8%)
#>       Any Abnormality                        5 (4.5%)     6 (5.2%)       6 (5.3%)
#>     High
#>       Single, not last                       1 (0.9%)     1 (0.9%)       2 (1.8%)
#>       Last or replicated                     1 (0.9%)     5 (4.3%)       3 (2.7%)
#>       Any Abnormality                        2 (1.8%)     6 (5.2%)       5 (4.4%)
Laboratory Abnormalities by Visit and Baseline Status
(LBT06)
1. Laboratory Abnormalities by Visit and Baseline Status
- The
lbt06template produces the standard laboratory abnormalities by visit and baseline status summary.
run(lbt06, syn_data)
#>   Visit
#>     Abnormality at Visit                  A: Drug X      B: Placebo    C: Combination
#>               Baseline Status              (N=134)        (N=134)         (N=132)
#>   ———————————————————————————————————————————————————————————————————————————————————
#>   Alanine Aminotransferase Measurement
#>     WEEK 1 DAY 8
#>       Low
#>                 Not low                  3/39 (7.7%)     2/40 (5%)      1/37 (2.7%)
#>                 Low                       1/4 (25%)         0/2             0/7
#>                 Total                    4/43 (9.3%)    2/42 (4.8%)     1/44 (2.3%)
#>       High
#>                 Not high                 3/42 (7.1%)    3/35 (8.6%)     4/41 (9.8%)
#>                 High                         0/1            0/7             0/3
#>                 Total                     3/43 (7%)     3/42 (7.1%)     4/44 (9.1%)
#>     WEEK 2 DAY 15
#>       Low
#>                 Not low                  5/29 (17.2%)   2/30 (6.7%)     7/45 (15.6%)
#>                 Low                       1/2 (50%)         0/5             0/7
#>                 Total                    6/31 (19.4%)   2/35 (5.7%)     7/52 (13.5%)
#>       High
#>                 Not high                 1/26 (3.8%)    4/33 (12.1%)    4/45 (8.9%)
#>                 High                         0/5            0/2         1/7 (14.3%)
#>                 Total                    1/31 (3.2%)    4/35 (11.4%)    5/52 (9.6%)
#>     WEEK 3 DAY 22
#>       Low
#>                 Not low                  2/34 (5.9%)    3/34 (8.8%)     1/35 (2.9%)
#>                 Low                      1/3 (33.3%)        0/0          1/4 (25%)
#>                 Total                    3/37 (8.1%)    3/34 (8.8%)     2/39 (5.1%)
#>       High
#>                 Not high                 5/33 (15.2%)   5/29 (17.2%)    3/34 (8.8%)
#>                 High                      1/4 (25%)         0/5             0/5
#>                 Total                    6/37 (16.2%)   5/34 (14.7%)    3/39 (7.7%)
#>     WEEK 4 DAY 29
#>       Low
#>                 Not low                   2/40 (5%)     2/39 (5.1%)     1/38 (2.6%)
#>                 Low                          0/2         1/4 (25%)          0/5
#>                 Total                    2/42 (4.8%)     3/43 (7%)      1/43 (2.3%)
#>       High
#>                 Not high                 5/36 (13.9%)   1/34 (2.9%)     6/39 (15.4%)
#>                 High                     1/6 (16.7%)    1/9 (11.1%)         0/4
#>                 Total                    6/42 (14.3%)   2/43 (4.7%)      6/43 (14%)
#>     WEEK 5 DAY 36
#>       Low
#>                 Not low                  2/35 (5.7%)    6/35 (17.1%)    4/44 (9.1%)
#>                 Low                      1/3 (33.3%)     2/8 (25%)          0/3
#>                 Total                    3/38 (7.9%)    8/43 (18.6%)    4/47 (8.5%)
#>       High
#>                 Not high                 4/38 (10.5%)   7/38 (18.4%)    1/41 (2.4%)
#>                 High                         0/0            0/5             0/6
#>                 Total                    4/38 (10.5%)   7/43 (16.3%)    1/47 (2.1%)
#>   C-Reactive Protein Measurement
#>     WEEK 1 DAY 8
#>       Low
#>                 Not low                  4/46 (8.7%)     2/40 (5%)      4/42 (9.5%)
#>                 Low                          0/5            0/2             0/2
#>                 Total                    4/51 (7.8%)    2/42 (4.8%)     4/44 (9.1%)
#>       High
#>                 Not high                 6/44 (13.6%)   4/37 (10.8%)    1/35 (2.9%)
#>                 High                         0/7         1/5 (20%)          0/9
#>                 Total                    6/51 (11.8%)   5/42 (11.9%)    1/44 (2.3%)
#>     WEEK 2 DAY 15
#>       Low
#>                 Not low                  4/39 (10.3%)   3/29 (10.3%)    2/33 (6.1%)
#>                 Low                      1/3 (33.3%)        0/2             0/3
#>                 Total                    5/42 (11.9%)   3/31 (9.7%)     2/36 (5.6%)
#>       High
#>                 Not high                 2/36 (5.6%)    3/27 (11.1%)    3/27 (11.1%)
#>                 High                         0/6         1/4 (25%)          0/9
#>                 Total                    2/42 (4.8%)    4/31 (12.9%)    3/36 (8.3%)
#>     WEEK 3 DAY 22
#>       Low
#>                 Not low                  3/37 (8.1%)     6/46 (13%)     8/44 (18.2%)
#>                 Low                          0/3            0/5             0/6
#>                 Total                    3/40 (7.5%)    6/51 (11.8%)     8/50 (16%)
#>       High
#>                 Not high                 2/34 (5.9%)    2/44 (4.5%)     1/43 (2.3%)
#>                 High                         0/6            0/7             0/7
#>                 Total                     2/40 (5%)     2/51 (3.9%)      1/50 (2%)
#>     WEEK 4 DAY 29
#>       Low
#>                 Not low                  3/42 (7.1%)    1/36 (2.8%)     4/34 (11.8%)
#>                 Low                          0/4         1/2 (50%)          0/5
#>                 Total                    3/46 (6.5%)    2/38 (5.3%)     4/39 (10.3%)
#>       High
#>                 Not high                 3/40 (7.5%)    1/35 (2.9%)     5/34 (14.7%)
#>                 High                     1/6 (16.7%)    1/3 (33.3%)         0/5
#>                 Total                    4/46 (8.7%)    2/38 (5.3%)     5/39 (12.8%)
#>     WEEK 5 DAY 36
#>       Low
#>                 Not low                  5/34 (14.7%)   4/38 (10.5%)    5/41 (12.2%)
#>                 Low                      1/6 (16.7%)        0/4          1/5 (20%)
#>                 Total                     6/40 (15%)    4/42 (9.5%)      6/46 (13%)
#>       High
#>                 Not high                 4/35 (11.4%)   4/35 (11.4%)    3/39 (7.7%)
#>                 High                         0/5            0/7         1/7 (14.3%)
#>                 Total                     4/40 (10%)    4/42 (9.5%)     4/46 (8.7%)
#>   Immunoglobulin A Measurement
#>     WEEK 1 DAY 8
#>       Low
#>                 Not low                  2/38 (5.3%)    3/38 (7.9%)      3/30 (10%)
#>                 Low                      1/7 (14.3%)     1/4 (25%)       1/4 (25%)
#>                 Total                    3/45 (6.7%)    4/42 (9.5%)     4/34 (11.8%)
#>       High
#>                 Not high                 2/38 (5.3%)    3/37 (8.1%)     1/30 (3.3%)
#>                 High                     2/7 (28.6%)     1/5 (20%)       1/4 (25%)
#>                 Total                    4/45 (8.9%)    4/42 (9.5%)     2/34 (5.9%)
#>     WEEK 2 DAY 15
#>       Low
#>                 Not low                  2/36 (5.6%)    5/45 (11.1%)    5/43 (11.6%)
#>                 Low                       1/4 (25%)         0/4         1/6 (16.7%)
#>                 Total                    3/40 (7.5%)    5/49 (10.2%)    6/49 (12.2%)
#>       High
#>                 Not high                 7/39 (17.9%)   4/44 (9.1%)     5/46 (10.9%)
#>                 High                         0/1            0/5             0/3
#>                 Total                    7/40 (17.5%)   4/49 (8.2%)     5/49 (10.2%)
#>     WEEK 3 DAY 22
#>       Low
#>                 Not low                  7/43 (16.3%)    4/40 (10%)     2/38 (5.3%)
#>                 Low                          0/5            0/10         2/4 (50%)
#>                 Total                    7/48 (14.6%)    4/50 (8%)      4/42 (9.5%)
#>       High
#>                 Not high                 2/41 (4.9%)    5/48 (10.4%)    5/36 (13.9%)
#>                 High                         0/7            0/2             0/6
#>                 Total                    2/48 (4.2%)     5/50 (10%)     5/42 (11.9%)
#>     WEEK 4 DAY 29
#>       Low
#>                 Not low                  2/29 (6.9%)    7/43 (16.3%)    4/46 (8.7%)
#>                 Low                          0/5            0/10            0/2
#>                 Total                    2/34 (5.9%)    7/53 (13.2%)    4/48 (8.3%)
#>       High
#>                 Not high                 6/29 (20.7%)   4/49 (8.2%)     3/44 (6.8%)
#>                 High                         0/5         1/4 (25%)       1/4 (25%)
#>                 Total                    6/34 (17.6%)   5/53 (9.4%)     4/48 (8.3%)
#>     WEEK 5 DAY 36
#>       Low
#>                 Not low                  4/41 (9.8%)    6/39 (15.4%)    5/38 (13.2%)
#>                 Low                          0/2            0/5             0/2
#>                 Total                    4/43 (9.3%)    6/44 (13.6%)    5/40 (12.5%)
#>       High
#>                 Not high                 3/37 (8.1%)    5/39 (12.8%)    4/38 (10.5%)
#>                 High                         0/6            0/5          1/2 (50%)
#>                 Total                     3/43 (7%)     5/44 (11.4%)    5/40 (12.5%)
Laboratory Test Results with Highest NCI CTCAE
Grade Post-Baseline (LBT07)
1. Laboratory Test Results with Highest
NCI CTCAE Grade Post-Baseline
- The
lbt07template produces the standard laboratory test results with highestNCI CTCAEgrade post-baseline summary. - The laboratory tests and grades in this template is currently
data-driven. The standard metadata for possible lab tests and
corresponding
NCI CTCAEgrade will be incorporated in future release.
run(lbt07, syn_data)
#>   Parameter
#>     Direction of Abnormality                 A: Drug X    B: Placebo   C: Combination
#>               Highest NCI CTCAE Grade         (N=134)      (N=134)        (N=132)
#>   ———————————————————————————————————————————————————————————————————————————————————
#>   Alanine Aminotransferase Measurement (n)      134          134            132
#>     LOW
#>               1                              14 (10.4%)   15 (11.2%)     10 (7.6%)
#>               2                              13 (9.7%)    18 (13.4%)     11 (8.3%)
#>               3                              20 (14.9%)   12 (9.0%)      10 (7.6%)
#>               4                               7 (5.2%)     8 (6.0%)      10 (7.6%)
#>               Any                            54 (40.3%)   53 (39.6%)     41 (31.1%)
#>     HIGH
#>               1                              18 (13.4%)   16 (11.9%)     18 (13.6%)
#>               2                              15 (11.2%)   13 (9.7%)      18 (13.6%)
#>               3                              10 (7.5%)    16 (11.9%)     13 (9.8%)
#>               4                              12 (9.0%)    11 (8.2%)      13 (9.8%)
#>               Any                            55 (41.0%)   56 (41.8%)     62 (47.0%)
#>   C-Reactive Protein Measurement (n)            134          134            132
#>     LOW
#>               1                              16 (11.9%)   19 (14.2%)     15 (11.4%)
#>               2                              21 (15.7%)   13 (9.7%)      16 (12.1%)
#>               3                              12 (9.0%)     9 (6.7%)      18 (13.6%)
#>               4                              11 (8.2%)     7 (5.2%)       5 (3.8%)
#>               Any                            60 (44.8%)   48 (35.8%)     54 (40.9%)
#>     HIGH
#>               1                              17 (12.7%)   15 (11.2%)      9 (6.8%)
#>               2                              15 (11.2%)   16 (11.9%)     13 (9.8%)
#>               3                              16 (11.9%)   12 (9.0%)      14 (10.6%)
#>               4                              12 (9.0%)    12 (9.0%)      10 (7.6%)
#>               Any                            60 (44.8%)   55 (41.0%)     46 (34.8%)
#>   Immunoglobulin A Measurement (n)              134          134            132
#>     LOW
#>               1                              17 (12.7%)   23 (17.2%)     17 (12.9%)
#>               2                              12 (9.0%)    15 (11.2%)     14 (10.6%)
#>               3                              15 (11.2%)   11 (8.2%)      14 (10.6%)
#>               4                              10 (7.5%)    16 (11.9%)     10 (7.6%)
#>               Any                            54 (40.3%)   65 (48.5%)     55 (41.7%)
#>     HIGH
#>               1                              25 (18.7%)   14 (10.4%)     13 (9.8%)
#>               2                              14 (10.4%)   20 (14.9%)     16 (12.1%)
#>               3                              12 (9.0%)    13 (9.7%)      17 (12.9%)
#>               4                              11 (8.2%)    13 (9.7%)       4 (3.0%)
#>               Any                            62 (46.3%)   60 (44.8%)     50 (37.9%)
Laboratory Test Results Shift Table - Highest
NCI-CTCAE Grade Post-Baseline by Baseline
NCI-CTCAE Grade (LBT14)
1. Laboratory Test Results Shift Table - Highest
NCI-CTCAE Grade Post-Baseline by Baseline
NCI-CTCAE Grade (High)
To produce the standard laboratory test results shift table - highest
NCI-CTCAE grade post-baseline by baseline
NCI-CTCAE grade summary for high abnormalities, use the
lbt14 template and set the parameter
direction to high.
run(lbt14, syn_data, direction = "high")
#>   Baseline Toxicity Grade                 A: Drug X    B: Placebo   C: Combination
#>           Post-baseline NCI-CTCAE Grade    (N=134)      (N=134)        (N=132)
#>   ————————————————————————————————————————————————————————————————————————————————
#>   Alanine Aminotransferase Measurement
#>     Not High                                 121          118            118
#>             Not High                      72 (53.7%)   70 (52.2%)     59 (44.7%)
#>             1                             16 (11.9%)   13 (9.7%)      17 (12.9%)
#>             2                             13 (9.7%)    12 (9.0%)      18 (13.6%)
#>             3                              9 (6.7%)    14 (10.4%)     12 (9.1%)
#>             4                             11 (8.2%)     9 (6.7%)      12 (9.1%)
#>     1                                         4            4              3
#>             Not High                       1 (0.7%)     1 (0.7%)       2 (1.5%)
#>             1                              1 (0.7%)        0              0
#>             2                              1 (0.7%)        0              0
#>             3                                 0         1 (0.7%)       1 (0.8%)
#>             4                              1 (0.7%)     2 (1.5%)          0
#>     2                                         4            4              4
#>             Not High                       3 (2.2%)     3 (2.2%)       3 (2.3%)
#>             1                                 0         1 (0.7%)       1 (0.8%)
#>             2                              1 (0.7%)        0              0
#>     3                                         2            5              5
#>             Not High                       2 (1.5%)     2 (1.5%)       4 (3.0%)
#>             1                                 0         2 (1.5%)          0
#>             2                                 0         1 (0.7%)          0
#>             4                                 0            0           1 (0.8%)
#>     4                                         3            3              2
#>             Not High                       1 (0.7%)     2 (1.5%)       2 (1.5%)
#>             1                              1 (0.7%)        0              0
#>             3                              1 (0.7%)     1 (0.7%)          0
#>   C-Reactive Protein Measurement
#>     Not High                                 115          115            114
#>             Not High                      60 (44.8%)   68 (50.7%)     70 (53.0%)
#>             1                             17 (12.7%)   13 (9.7%)       9 (6.8%)
#>             2                             12 (9.0%)    14 (10.4%)     13 (9.8%)
#>             3                             16 (11.9%)   10 (7.5%)      13 (9.8%)
#>             4                             10 (7.5%)    10 (7.5%)       9 (6.8%)
#>     1                                         5            5              5
#>             Not High                       4 (3.0%)     3 (2.2%)       5 (3.8%)
#>             2                                 0         2 (1.5%)          0
#>             4                              1 (0.7%)        0              0
#>     2                                         6            5              5
#>             Not High                       3 (2.2%)     3 (2.2%)       4 (3.0%)
#>             1                                 0         1 (0.7%)          0
#>             2                              2 (1.5%)        0              0
#>             4                              1 (0.7%)     1 (0.7%)       1 (0.8%)
#>     3                                         2            3              5
#>             Not High                       2 (1.5%)     1 (0.7%)       4 (3.0%)
#>             3                                 0         1 (0.7%)       1 (0.8%)
#>             4                                 0         1 (0.7%)          0
#>     4                                         6            6              3
#>             Not High                       5 (3.7%)     4 (3.0%)       3 (2.3%)
#>             1                                 0         1 (0.7%)          0
#>             2                              1 (0.7%)        0              0
#>             3                                 0         1 (0.7%)          0
#>   Immunoglobulin A Measurement
#>     Not High                                 119          123            119
#>             Not High                      61 (45.5%)   69 (51.5%)     74 (56.1%)
#>             1                             24 (17.9%)   12 (9.0%)      13 (9.8%)
#>             2                             13 (9.7%)    20 (14.9%)     12 (9.1%)
#>             3                             11 (8.2%)    11 (8.2%)      16 (12.1%)
#>             4                             10 (7.5%)    11 (8.2%)       4 (3.0%)
#>     1                                         2            4              6
#>             Not High                       2 (1.5%)     2 (1.5%)       5 (3.8%)
#>             2                                 0            0           1 (0.8%)
#>             4                                 0         2 (1.5%)          0
#>     2                                         4            4              3
#>             Not High                       3 (2.2%)     2 (1.5%)       1 (0.8%)
#>             1                                 0         2 (1.5%)          0
#>             2                                 0            0           1 (0.8%)
#>             3                                 0            0           1 (0.8%)
#>             4                              1 (0.7%)        0              0
#>     3                                         5            2              2
#>             Not High                       3 (2.2%)        0           1 (0.8%)
#>             1                              1 (0.7%)        0              0
#>             2                                 0            0           1 (0.8%)
#>             3                              1 (0.7%)     2 (1.5%)          0
#>     4                                         4            1              2
#>             Not High                       3 (2.2%)     1 (0.7%)       1 (0.8%)
#>             2                              1 (0.7%)        0           1 (0.8%)
2. Laboratory Test Results Shift Table - Highest
NCI-CTCAE Grade Post-Baseline by Baseline
NCI-CTCAE Grade (Low)
To produce the standard laboratory test results shift table - highest
NCI-CTCAE grade post-baseline by baseline
NCI-CTCAE grade summary for high abnormalities, use the
lbt14 template and the argument
direction is low by default.
run(lbt14, syn_data)
#>   Baseline Toxicity Grade                 A: Drug X    B: Placebo   C: Combination
#>           Post-baseline NCI-CTCAE Grade    (N=134)      (N=134)        (N=132)
#>   ————————————————————————————————————————————————————————————————————————————————
#>   Alanine Aminotransferase Measurement
#>     Not Low                                  124          122            117
#>             Not Low                       74 (55.2%)   76 (56.7%)     80 (60.6%)
#>             1                             13 (9.7%)    12 (9.0%)       9 (6.8%)
#>             2                             13 (9.7%)    16 (11.9%)     11 (8.3%)
#>             3                             17 (12.7%)   11 (8.2%)       9 (6.8%)
#>             4                              7 (5.2%)     7 (5.2%)       8 (6.1%)
#>     1                                         3            6              7
#>             Not Low                           0         2 (1.5%)       5 (3.8%)
#>             1                              1 (0.7%)     2 (1.5%)          0
#>             2                                 0         1 (0.7%)          0
#>             3                              2 (1.5%)     1 (0.7%)          0
#>             4                                 0            0           2 (1.5%)
#>     2                                         2            1              4
#>             Not Low                        2 (1.5%)        0           3 (2.3%)
#>             2                                 0         1 (0.7%)          0
#>             3                                 0            0           1 (0.8%)
#>     3                                         2            3              4
#>             Not Low                        2 (1.5%)     2 (1.5%)       3 (2.3%)
#>             1                                 0         1 (0.7%)       1 (0.8%)
#>     4                                         3            2              0
#>             Not Low                        2 (1.5%)     1 (0.7%)          0
#>             3                              1 (0.7%)        0              0
#>             4                                 0         1 (0.7%)          0
#>   C-Reactive Protein Measurement
#>     Not Low                                  122          125            120
#>             Not Low                       67 (50.0%)   81 (60.4%)     70 (53.0%)
#>             1                             14 (10.4%)   17 (12.7%)     13 (9.8%)
#>             2                             20 (14.9%)   11 (8.2%)      16 (12.1%)
#>             3                             12 (9.0%)     9 (6.7%)      17 (12.9%)
#>             4                              9 (6.7%)     7 (5.2%)       4 (3.0%)
#>     1                                         2            5              5
#>             Not Low                           0         3 (2.2%)       4 (3.0%)
#>             1                                 0         1 (0.7%)       1 (0.8%)
#>             2                              1 (0.7%)     1 (0.7%)          0
#>             4                              1 (0.7%)        0              0
#>     2                                         5            1              1
#>             Not Low                        3 (2.2%)        0           1 (0.8%)
#>             1                              2 (1.5%)        0              0
#>             2                                 0         1 (0.7%)          0
#>     3                                         2            2              1
#>             Not Low                        2 (1.5%)     1 (0.7%)          0
#>             1                                 0         1 (0.7%)          0
#>             3                                 0            0           1 (0.8%)
#>     4                                         3            1              5
#>             Not Low                        2 (1.5%)     1 (0.7%)       3 (2.3%)
#>             1                                 0            0           1 (0.8%)
#>             4                              1 (0.7%)        0           1 (0.8%)
#>   Immunoglobulin A Measurement
#>     Not Low                                  120          119            120
#>             Not Low                       69 (51.5%)   58 (43.3%)     70 (53.0%)
#>             1                             16 (11.9%)   20 (14.9%)     16 (12.1%)
#>             2                             12 (9.0%)    14 (10.4%)     14 (10.6%)
#>             3                             14 (10.4%)   11 (8.2%)      13 (9.8%)
#>             4                              9 (6.7%)    16 (11.9%)      7 (5.3%)
#>     1                                         8            8              3
#>             Not Low                        7 (5.2%)     4 (3.0%)       2 (1.5%)
#>             1                              1 (0.7%)     3 (2.2%)          0
#>             2                                 0         1 (0.7%)          0
#>             4                                 0            0           1 (0.8%)
#>     2                                         2            1              2
#>             Not Low                        2 (1.5%)     1 (0.7%)       2 (1.5%)
#>     3                                         3            3              4
#>             Not Low                        1 (0.7%)     3 (2.2%)       2 (1.5%)
#>             1                                 0            0           1 (0.8%)
#>             3                              1 (0.7%)        0              0
#>             4                              1 (0.7%)        0           1 (0.8%)
#>     4                                         1            3              3
#>             Not Low                        1 (0.7%)     3 (2.2%)       1 (0.8%)
#>             3                                 0            0           1 (0.8%)
#>             4                                 0            0           1 (0.8%)
3. Laboratory Test Results Shift Table - Highest
NCI-CTCAE Grade Post-Baseline by Baseline
NCI-CTCAE Grade (High) Without Patients with Missing
Baseline
To exclude patients with missing baseline grade, set the argument
gr_missing to excl.
run(lbt14, syn_data, direction = "high", gr_missing = "excl")
#>   Baseline Toxicity Grade                 A: Drug X    B: Placebo   C: Combination
#>           Post-baseline NCI-CTCAE Grade    (N=134)      (N=134)        (N=132)
#>   ————————————————————————————————————————————————————————————————————————————————
#>   Alanine Aminotransferase Measurement
#>     Not High                                 121          118            118
#>             Not High                      72 (53.7%)   70 (52.2%)     59 (44.7%)
#>             1                             16 (11.9%)   13 (9.7%)      17 (12.9%)
#>             2                             13 (9.7%)    12 (9.0%)      18 (13.6%)
#>             3                              9 (6.7%)    14 (10.4%)     12 (9.1%)
#>             4                             11 (8.2%)     9 (6.7%)      12 (9.1%)
#>     1                                         4            4              3
#>             Not High                       1 (0.7%)     1 (0.7%)       2 (1.5%)
#>             1                              1 (0.7%)        0              0
#>             2                              1 (0.7%)        0              0
#>             3                                 0         1 (0.7%)       1 (0.8%)
#>             4                              1 (0.7%)     2 (1.5%)          0
#>     2                                         4            4              4
#>             Not High                       3 (2.2%)     3 (2.2%)       3 (2.3%)
#>             1                                 0         1 (0.7%)       1 (0.8%)
#>             2                              1 (0.7%)        0              0
#>     3                                         2            5              5
#>             Not High                       2 (1.5%)     2 (1.5%)       4 (3.0%)
#>             1                                 0         2 (1.5%)          0
#>             2                                 0         1 (0.7%)          0
#>             4                                 0            0           1 (0.8%)
#>     4                                         3            3              2
#>             Not High                       1 (0.7%)     2 (1.5%)       2 (1.5%)
#>             1                              1 (0.7%)        0              0
#>             3                              1 (0.7%)     1 (0.7%)          0
#>   C-Reactive Protein Measurement
#>     Not High                                 115          115            114
#>             Not High                      60 (44.8%)   68 (50.7%)     70 (53.0%)
#>             1                             17 (12.7%)   13 (9.7%)       9 (6.8%)
#>             2                             12 (9.0%)    14 (10.4%)     13 (9.8%)
#>             3                             16 (11.9%)   10 (7.5%)      13 (9.8%)
#>             4                             10 (7.5%)    10 (7.5%)       9 (6.8%)
#>     1                                         5            5              5
#>             Not High                       4 (3.0%)     3 (2.2%)       5 (3.8%)
#>             2                                 0         2 (1.5%)          0
#>             4                              1 (0.7%)        0              0
#>     2                                         6            5              5
#>             Not High                       3 (2.2%)     3 (2.2%)       4 (3.0%)
#>             1                                 0         1 (0.7%)          0
#>             2                              2 (1.5%)        0              0
#>             4                              1 (0.7%)     1 (0.7%)       1 (0.8%)
#>     3                                         2            3              5
#>             Not High                       2 (1.5%)     1 (0.7%)       4 (3.0%)
#>             3                                 0         1 (0.7%)       1 (0.8%)
#>             4                                 0         1 (0.7%)          0
#>     4                                         6            6              3
#>             Not High                       5 (3.7%)     4 (3.0%)       3 (2.3%)
#>             1                                 0         1 (0.7%)          0
#>             2                              1 (0.7%)        0              0
#>             3                                 0         1 (0.7%)          0
#>   Immunoglobulin A Measurement
#>     Not High                                 119          123            119
#>             Not High                      61 (45.5%)   69 (51.5%)     74 (56.1%)
#>             1                             24 (17.9%)   12 (9.0%)      13 (9.8%)
#>             2                             13 (9.7%)    20 (14.9%)     12 (9.1%)
#>             3                             11 (8.2%)    11 (8.2%)      16 (12.1%)
#>             4                             10 (7.5%)    11 (8.2%)       4 (3.0%)
#>     1                                         2            4              6
#>             Not High                       2 (1.5%)     2 (1.5%)       5 (3.8%)
#>             2                                 0            0           1 (0.8%)
#>             4                                 0         2 (1.5%)          0
#>     2                                         4            4              3
#>             Not High                       3 (2.2%)     2 (1.5%)       1 (0.8%)
#>             1                                 0         2 (1.5%)          0
#>             2                                 0            0           1 (0.8%)
#>             3                                 0            0           1 (0.8%)
#>             4                              1 (0.7%)        0              0
#>     3                                         5            2              2
#>             Not High                       3 (2.2%)        0           1 (0.8%)
#>             1                              1 (0.7%)        0              0
#>             2                                 0            0           1 (0.8%)
#>             3                              1 (0.7%)     2 (1.5%)          0
#>     4                                         4            1              2
#>             Not High                       3 (2.2%)     1 (0.7%)       1 (0.8%)
#>             2                              1 (0.7%)        0           1 (0.8%)
4. Laboratory Test Results Shift Table - Highest
NCI-CTCAE Grade Post-Baseline by Baseline
NCI-CTCAE Grade (Low) with Missing Baseline Considered as
Grade 0
To count patients with missing baseline grade as grade 0, set the
argument gr_missing to gr_0.
run(lbt14, syn_data, gr_missing = "gr_0")
#>   Baseline Toxicity Grade                 A: Drug X    B: Placebo   C: Combination
#>           Post-baseline NCI-CTCAE Grade    (N=134)      (N=134)        (N=132)
#>   ————————————————————————————————————————————————————————————————————————————————
#>   Alanine Aminotransferase Measurement
#>     1                                         3            6              7
#>             Not Low                           0         2 (1.5%)       5 (3.8%)
#>             1                              1 (0.7%)     2 (1.5%)          0
#>             2                                 0         1 (0.7%)          0
#>             3                              2 (1.5%)     1 (0.7%)          0
#>             4                                 0            0           2 (1.5%)
#>     2                                         2            1              4
#>             Not Low                        2 (1.5%)        0           3 (2.3%)
#>             2                                 0         1 (0.7%)          0
#>             3                                 0            0           1 (0.8%)
#>     3                                         2            3              4
#>             Not Low                        2 (1.5%)     2 (1.5%)       3 (2.3%)
#>             1                                 0         1 (0.7%)       1 (0.8%)
#>     4                                         3            2              0
#>             Not Low                        2 (1.5%)     1 (0.7%)          0
#>             3                              1 (0.7%)        0              0
#>             4                                 0         1 (0.7%)          0
#>     Not Low                                  124          122            117
#>             Not Low                       74 (55.2%)   76 (56.7%)     80 (60.6%)
#>             1                             13 (9.7%)    12 (9.0%)       9 (6.8%)
#>             2                             13 (9.7%)    16 (11.9%)     11 (8.3%)
#>             3                             17 (12.7%)   11 (8.2%)       9 (6.8%)
#>             4                              7 (5.2%)     7 (5.2%)       8 (6.1%)
#>   C-Reactive Protein Measurement
#>     1                                         2            5              5
#>             Not Low                           0         3 (2.2%)       4 (3.0%)
#>             1                                 0         1 (0.7%)       1 (0.8%)
#>             2                              1 (0.7%)     1 (0.7%)          0
#>             4                              1 (0.7%)        0              0
#>     2                                         5            1              1
#>             Not Low                        3 (2.2%)        0           1 (0.8%)
#>             1                              2 (1.5%)        0              0
#>             2                                 0         1 (0.7%)          0
#>     3                                         2            2              1
#>             Not Low                        2 (1.5%)     1 (0.7%)          0
#>             1                                 0         1 (0.7%)          0
#>             3                                 0            0           1 (0.8%)
#>     4                                         3            1              5
#>             Not Low                        2 (1.5%)     1 (0.7%)       3 (2.3%)
#>             1                                 0            0           1 (0.8%)
#>             4                              1 (0.7%)        0           1 (0.8%)
#>     Not Low                                  122          125            120
#>             Not Low                       67 (50.0%)   81 (60.4%)     70 (53.0%)
#>             1                             14 (10.4%)   17 (12.7%)     13 (9.8%)
#>             2                             20 (14.9%)   11 (8.2%)      16 (12.1%)
#>             3                             12 (9.0%)     9 (6.7%)      17 (12.9%)
#>             4                              9 (6.7%)     7 (5.2%)       4 (3.0%)
#>   Immunoglobulin A Measurement
#>     1                                         8            8              3
#>             Not Low                        7 (5.2%)     4 (3.0%)       2 (1.5%)
#>             1                              1 (0.7%)     3 (2.2%)          0
#>             2                                 0         1 (0.7%)          0
#>             4                                 0            0           1 (0.8%)
#>     2                                         2            1              2
#>             Not Low                        2 (1.5%)     1 (0.7%)       2 (1.5%)
#>     3                                         3            3              4
#>             Not Low                        1 (0.7%)     3 (2.2%)       2 (1.5%)
#>             1                                 0            0           1 (0.8%)
#>             3                              1 (0.7%)        0              0
#>             4                              1 (0.7%)        0           1 (0.8%)
#>     4                                         1            3              3
#>             Not Low                        1 (0.7%)     3 (2.2%)       1 (0.8%)
#>             3                                 0            0           1 (0.8%)
#>             4                                 0            0           1 (0.8%)
#>     Not Low                                  120          119            120
#>             Not Low                       69 (51.5%)   58 (43.3%)     70 (53.0%)
#>             1                             16 (11.9%)   20 (14.9%)     16 (12.1%)
#>             2                             12 (9.0%)    14 (10.4%)     14 (10.6%)
#>             3                             14 (10.4%)   11 (8.2%)      13 (9.8%)
#>             4                              9 (6.7%)    16 (11.9%)      7 (5.3%)
4. Laboratory Test Results Shift Table - Highest
NCI-CTCAE Grade Post-Baseline by Baseline
NCI-CTCAE Grade (with fill in of grades)
To display all possible grades even if they do not occur in the data,
set the argument prune_0 to FALSE.
run(lbt14, syn_data, direction = "high", prune_0 = FALSE)
#> Baseline Toxicity Grade A: Drug X B: Placebo C: Combination
#> Post-baseline NCI-CTCAE Grade (N=134) (N=134) (N=132)
#> ————————————————————————————————————————————————————————————————————————————————
#> Alanine Aminotransferase Measurement
#> Not High 121 118 118
#> Not High 72 (53.7%) 70 (52.2%) 59 (44.7%)
#> 1 16 (11.9%) 13 (9.7%) 17 (12.9%)
#> 2 13 (9.7%) 12 (9.0%) 18 (13.6%)
#> 3 9 (6.7%) 14 (10.4%) 12 (9.1%)
#> 4 11 (8.2%) 9 (6.7%) 12 (9.1%)
#> Missing 0 0 0
#> 1 4 4 3
#> Not High 1 (0.7%) 1 (0.7%) 2 (1.5%)
#> 1 1 (0.7%) 0 0
#> 2 1 (0.7%) 0 0
#> 3 0 1 (0.7%) 1 (0.8%)
#> 4 1 (0.7%) 2 (1.5%) 0
#> Missing 0 0 0
#> 2 4 4 4
#> Not High 3 (2.2%) 3 (2.2%) 3 (2.3%)
#> 1 0 1 (0.7%) 1 (0.8%)
#> 2 1 (0.7%) 0 0
#> 3 0 0 0
#> 4 0 0 0
#> Missing 0 0 0
#> 3 2 5 5
#> Not High 2 (1.5%) 2 (1.5%) 4 (3.0%)
#> 1 0 2 (1.5%) 0
#> 2 0 1 (0.7%) 0
#> 3 0 0 0
#> 4 0 0 1 (0.8%)
#> Missing 0 0 0
#> 4 3 3 2
#> Not High 1 (0.7%) 2 (1.5%) 2 (1.5%)
#> 1 1 (0.7%) 0 0
#> 2 0 0 0
#> 3 1 (0.7%) 1 (0.7%) 0
#> 4 0 0 0
#> Missing 0 0 0
#> Missing 0 0 0
#> Not High 0 0 0
#> 1 0 0 0
#> 2 0 0 0
#> 3 0 0 0
#> 4 0 0 0
#> Missing 0 0 0
#> C-Reactive Protein Measurement
#> Not High 115 115 114
#> Not High 60 (44.8%) 68 (50.7%) 70 (53.0%)
#> 1 17 (12.7%) 13 (9.7%) 9 (6.8%)
#> 2 12 (9.0%) 14 (10.4%) 13 (9.8%)
#> 3 16 (11.9%) 10 (7.5%) 13 (9.8%)
#> 4 10 (7.5%) 10 (7.5%) 9 (6.8%)
#> Missing 0 0 0
#> 1 5 5 5
#> Not High 4 (3.0%) 3 (2.2%) 5 (3.8%)
#> 1 0 0 0
#> 2 0 2 (1.5%) 0
#> 3 0 0 0
#> 4 1 (0.7%) 0 0
#> Missing 0 0 0
#> 2 6 5 5
#> Not High 3 (2.2%) 3 (2.2%) 4 (3.0%)
#> 1 0 1 (0.7%) 0
#> 2 2 (1.5%) 0 0
#> 3 0 0 0
#> 4 1 (0.7%) 1 (0.7%) 1 (0.8%)
#> Missing 0 0 0
#> 3 2 3 5
#> Not High 2 (1.5%) 1 (0.7%) 4 (3.0%)
#> 1 0 0 0
#> 2 0 0 0
#> 3 0 1 (0.7%) 1 (0.8%)
#> 4 0 1 (0.7%) 0
#> Missing 0 0 0
#> 4 6 6 3
#> Not High 5 (3.7%) 4 (3.0%) 3 (2.3%)
#> 1 0 1 (0.7%) 0
#> 2 1 (0.7%) 0 0
#> 3 0 1 (0.7%) 0
#> 4 0 0 0
#> Missing 0 0 0
#> Missing 0 0 0
#> Not High 0 0 0
#> 1 0 0 0
#> 2 0 0 0
#> 3 0 0 0
#> 4 0 0 0
#> Missing 0 0 0
#> Immunoglobulin A Measurement
#> Not High 119 123 119
#> Not High 61 (45.5%) 69 (51.5%) 74 (56.1%)
#> 1 24 (17.9%) 12 (9.0%) 13 (9.8%)
#> 2 13 (9.7%) 20 (14.9%) 12 (9.1%)
#> 3 11 (8.2%) 11 (8.2%) 16 (12.1%)
#> 4 10 (7.5%) 11 (8.2%) 4 (3.0%)
#> Missing 0 0 0
#> 1 2 4 6
#> Not High 2 (1.5%) 2 (1.5%) 5 (3.8%)
#> 1 0 0 0
#> 2 0 0 1 (0.8%)
#> 3 0 0 0
#> 4 0 2 (1.5%) 0
#> Missing 0 0 0
#> 2 4 4 3
#> Not High 3 (2.2%) 2 (1.5%) 1 (0.8%)
#> 1 0 2 (1.5%) 0
#> 2 0 0 1 (0.8%)
#> 3 0 0 1 (0.8%)
#> 4 1 (0.7%) 0 0
#> Missing 0 0 0
#> 3 5 2 2
#> Not High 3 (2.2%) 0 1 (0.8%)
#> 1 1 (0.7%) 0 0
#> 2 0 0 1 (0.8%)
#> 3 1 (0.7%) 2 (1.5%) 0
#> 4 0 0 0
#> Missing 0 0 0
#> 4 4 1 2
#> Not High 3 (2.2%) 1 (0.7%) 1 (0.8%)
#> 1 0 0 0
#> 2 1 (0.7%) 0 1 (0.8%)
#> 3 0 0 0
#> 4 0 0 0
#> Missing 0 0 0
#> Missing 0 0 0
#> Not High 0 0 0
#> 1 0 0 0
#> 2 0 0 0
#> 3 0 0 0
#> 4 0 0 0
#> Missing 0 0 0
Medical History (MHT01)
1. Medical History
- The
mht01template displays medical conditions by MedDRA system organ class and Preferred Name by default. - The default treatment variable is
"ADSL.ARM". - The user is expected to use filter to subset medical conditions prior to or on entering study.
- By default, the template produces the overall ‘total number of conditions’ as well as the ‘total number of conditions’ per body system after the summary of patients. 5)This template currently does not support sorting MedDRA system organ class and preferred names by order of frequency.
run(mht01, syn_data)
#>   MedDRA System Organ Class                                 A: Drug X    B: Placebo    C: Combination
#>     MedDRA Preferred Term                                    (N=134)       (N=134)        (N=132)
#>   ———————————————————————————————————————————————————————————————————————————————————————————————————
#>   Total number of patients with at least one condition     122 (91.0%)   123 (91.8%)    120 (90.9%)
#>   Total number of conditions                                   609           622            703
#>   cl A
#>     Total number of patients with at least one condition   78 (58.2%)    75 (56.0%)      89 (67.4%)
#>     Total number of conditions                                 132           130            160
#>     trm A_1/2                                              50 (37.3%)    45 (33.6%)      63 (47.7%)
#>     trm A_2/2                                              48 (35.8%)    48 (35.8%)      50 (37.9%)
#>   cl B
#>     Total number of patients with at least one condition   96 (71.6%)    89 (66.4%)      97 (73.5%)
#>     Total number of conditions                                 185           198            205
#>     trm B_3/3                                              48 (35.8%)    54 (40.3%)      51 (38.6%)
#>     trm B_2/3                                              49 (36.6%)    44 (32.8%)      52 (39.4%)
#>     trm B_1/3                                              47 (35.1%)    49 (36.6%)      43 (32.6%)
#>   cl C
#>     Total number of patients with at least one condition   67 (50.0%)    75 (56.0%)      79 (59.8%)
#>     Total number of conditions                                 103           116            129
#>     trm C_2/2                                              35 (26.1%)    48 (35.8%)      55 (41.7%)
#>     trm C_1/2                                              43 (32.1%)    46 (34.3%)      43 (32.6%)
#>   cl D
#>     Total number of patients with at least one condition   96 (71.6%)    90 (67.2%)      98 (74.2%)
#>     Total number of conditions                                 189           178            209
#>     trm D_3/3                                              47 (35.1%)    58 (43.3%)      57 (43.2%)
#>     trm D_1/3                                              50 (37.3%)    42 (31.3%)      51 (38.6%)
#>     trm D_2/3                                              48 (35.8%)    42 (31.3%)      50 (37.9%)
2. Medical History showing additional column ‘All Patients’
run(mht01, syn_data, lbl_overall = "All Patients")
#>   MedDRA System Organ Class                                 A: Drug X    B: Placebo    C: Combination   All Patients
#>     MedDRA Preferred Term                                    (N=134)       (N=134)        (N=132)         (N=400)
#>   ——————————————————————————————————————————————————————————————————————————————————————————————————————————————————
#>   Total number of patients with at least one condition     122 (91.0%)   123 (91.8%)    120 (90.9%)     365 (91.2%)
#>   Total number of conditions                                   609           622            703             1934
#>   cl A
#>     Total number of patients with at least one condition   78 (58.2%)    75 (56.0%)      89 (67.4%)     242 (60.5%)
#>     Total number of conditions                                 132           130            160             422
#>     trm A_1/2                                              50 (37.3%)    45 (33.6%)      63 (47.7%)     158 (39.5%)
#>     trm A_2/2                                              48 (35.8%)    48 (35.8%)      50 (37.9%)     146 (36.5%)
#>   cl B
#>     Total number of patients with at least one condition   96 (71.6%)    89 (66.4%)      97 (73.5%)     282 (70.5%)
#>     Total number of conditions                                 185           198            205             588
#>     trm B_3/3                                              48 (35.8%)    54 (40.3%)      51 (38.6%)     153 (38.2%)
#>     trm B_2/3                                              49 (36.6%)    44 (32.8%)      52 (39.4%)     145 (36.2%)
#>     trm B_1/3                                              47 (35.1%)    49 (36.6%)      43 (32.6%)     139 (34.8%)
#>   cl C
#>     Total number of patients with at least one condition   67 (50.0%)    75 (56.0%)      79 (59.8%)     221 (55.2%)
#>     Total number of conditions                                 103           116            129             348
#>     trm C_2/2                                              35 (26.1%)    48 (35.8%)      55 (41.7%)     138 (34.5%)
#>     trm C_1/2                                              43 (32.1%)    46 (34.3%)      43 (32.6%)     132 (33.0%)
#>   cl D
#>     Total number of patients with at least one condition   96 (71.6%)    90 (67.2%)      98 (74.2%)     284 (71.0%)
#>     Total number of conditions                                 189           178            209             576
#>     trm D_3/3                                              47 (35.1%)    58 (43.3%)      57 (43.2%)     162 (40.5%)
#>     trm D_1/3                                              50 (37.3%)    42 (31.3%)      51 (38.6%)     143 (35.8%)
#>     trm D_2/3                                              48 (35.8%)    42 (31.3%)      50 (37.9%)     140 (35.0%)
Major Protocol Deviations (PDT01)
1. Major Protocol Deviations
- The
pdt01template produces the standard major protocol deviations output. - Users are expected to filter
addvto only include records whereDVCAT == "MAJOR"in pre-processing.
proc_data <- syn_data
proc_data$addv <- proc_data$addv %>%
  filter(DVCAT == "MAJOR")

run(pdt01, proc_data)
#>   Category                                                              A: Drug X    B: Placebo   C: Combination
#>     Description                                                          (N=134)      (N=134)        (N=132)
#>   ——————————————————————————————————————————————————————————————————————————————————————————————————————————————
#>   Total number of patients with at least one major protocol deviation   22 (16.4%)   23 (17.2%)     13 (9.8%)
#>   Total number of major protocol deviations                                 40           42             21
#>   EXCLUSION CRITERIA
#>     Active or untreated or other excluded cns metastases                 5 (3.7%)     3 (2.2%)          0
#>     Pregnancy criteria                                                   2 (1.5%)     4 (3.0%)          0
#>     History of other malignancies within the last 5 years                3 (2.2%)     2 (1.5%)          0
#>     Uncontrolled concurrent condition                                    3 (2.2%)     1 (0.7%)          0
#>     Other exclusion criteria                                                0            0           3 (2.3%)
#>     Received prior prohibited therapy or medication                         0         2 (1.5%)       1 (0.8%)
#>   INCLUSION CRITERIA
#>     No signed ICF at study entry                                         6 (4.5%)     4 (3.0%)          0
#>     Ineligible cancer type or current cancer stage                       6 (4.5%)     1 (0.7%)       1 (0.8%)
#>     Inclusion lab values outside allowed limits                             0         3 (2.2%)          0
#>     Does not meet prior therapy requirements                             1 (0.7%)        0              0
#>     Inclusion-related test not done/out of window                           0            0           1 (0.8%)
#>   MEDICATION
#>     Significant deviation from planned dose                              3 (2.2%)     1 (0.7%)       2 (1.5%)
#>     Received incorrect study medication                                  1 (0.7%)     2 (1.5%)       1 (0.8%)
#>     Discontinued study drug for unspecified reason                       1 (0.7%)     1 (0.7%)       1 (0.8%)
#>     Dose missed or significantly out of window                           2 (1.5%)        0           1 (0.8%)
#>     Received prohibited concomitant medication                              0         2 (1.5%)          0
#>   PROCEDURAL
#>     Eligibility-related test not done/out of window                      1 (0.7%)     6 (4.5%)       1 (0.8%)
#>     Omission of screening tumor assessment                                  0         4 (3.0%)       3 (2.3%)
#>     Missed assessment affecting safety/study outcomes                    1 (0.7%)     2 (1.5%)       2 (1.5%)
#>     Failure to sign updated ICF within two visits                        2 (1.5%)     1 (0.7%)       1 (0.8%)
#>     Missed 2 or more efficacy assessments                                2 (1.5%)        0           1 (0.8%)
#>     Omission of complete lab panel required by protocol                     0         1 (0.7%)       1 (0.8%)
Reasons for Major Protocol Deviations Related to
Epidemic/Pandemic (PDT02)
1. Reasons for Major Protocol Deviations Related to Epidemic/Pandemic
- The
pdt02template produces the reasons for major protocol deviations related to epidemic/pandemic summary. - By default,
ADDV.DVREASprovides the reason andADDV.DVTERMprovides the description. - By default,
addvhas been filtered to include only records that meet the conditionAEPRELFL == "Y" & DVCAT == "MAJOR".
run(pdt02, syn_data)
#>   Primary Reason                                                                                     A: Drug X   B: Placebo   C: Combination
#>     Description                                                                                       (N=134)     (N=134)        (N=132)
#>   ——————————————————————————————————————————————————————————————————————————————————————————————————————————————————————————————————————————
#>   Total number of patients with at least one major protocol deviation related to epidemic/pandemic   9 (6.7%)     2 (1.5%)       5 (3.8%)
#>   Total number of major protocol deviations related to epidemic/pandemic                                 9           2              6
#>   Site action due to epidemic/pandemic                                                               9 (6.7%)     2 (1.5%)       5 (3.8%)
#>     Significant deviation from planned dose                                                          3 (2.2%)     1 (0.7%)       2 (1.5%)
#>     Failure to sign updated ICF within two visits                                                    2 (1.5%)     1 (0.7%)       1 (0.8%)
#>     Dose missed or significantly out of window                                                       2 (1.5%)        0           1 (0.8%)
#>     Missed 2 or more efficacy assessments                                                            2 (1.5%)        0           1 (0.8%)
Duration of Exposure for Risk Management Plan
(RMPT01)
1. Duration of Exposure for Risk Management Plan
The rmpt01 template produces the
standard duration of exposure output for the Risk Management Plan
(RMP).
Person time is the sum of exposure across all patients in days.
run(rmpt01, syn_data)
#>                                         Patients     Person time
#>   Duration of exposure                  (N=400)        (N=400)
#>   ——————————————————————————————————————————————————————————————
#>   < 1 month                            39 (9.8%)         728
#>   1 to <3 months                      111 (27.8%)       6418
#>   3 to <6 months                      136 (34.0%)       17645
#>   >=6 months                          114 (28.5%)       24909
#>   Total patients number/person time   400 (100.0%)      49700
Extent of Exposure by Age Group and Gender for Risk
Management Plan (RMPT03)
1. Extent of Exposure by Age Group and Gender for Risk Management Plan
The rmpt03 template produces the
standard extent of exposure by age group and gender output for the Risk
Management Plan (RMP).
By default, the AGEGR1 variable is used as the age
group. If AGEGR1 is available in ADSL only but
not in ADEX, it needs to be added to ADEX
first.
proc_data <- syn_data
proc_data <- propagate(proc_data, "adsl", "AGEGR1", "USUBJID")
#>
#> Updating: adae with: AGEGR1
#> Updating: adsaftte with: AGEGR1
#> Updating: adcm with: AGEGR1
#> Updating: addv with: AGEGR1
#> Updating: adeg with: AGEGR1
#> Updating: adex with: AGEGR1
#> Updating: adlb with: AGEGR1
#> Updating: admh with: AGEGR1
#> Skipping: adrs
#> Updating: adsub with: AGEGR1
#> Skipping: adtte
#> Updating: advs with: AGEGR1
run(rmpt03, proc_data)
#>                                                   F                            M                       All Genders
#>                                         Patients     Person time     Patients     Person time     Patients     Person time
#>   Age Group                             (N=231)        (N=231)       (N=169)        (N=169)       (N=400)        (N=400)
#>   ————————————————————————————————————————————————————————————————————————————————————————————————————————————————————————
#>   <65                                 231 (100.0%)      27364      168 (99.4%)       22124      399 (99.8%)       49488
#>   >=65                                  0 (0.0%)          0          1 (0.6%)         212         1 (0.2%)         212
#>   Total patients number/person time   231 (100.0%)      27364      169 (100.0%)      22336      400 (100.0%)      49700
Any other study specific age group can be used by editing the
parameter summaryvars. For all RMP tables, if
the variable specified per summaryvars is unavailable in
ADEX, it needs to be added to ADEX first.
proc_data <- syn_data
proc_data$adsl <- proc_data$adsl %>%
  mutate(
    AGEGR2 = with_label(
      factor(case_when(
        AAGE < 18 ~ "<18",
        AAGE >= 18 & AAGE <= 65 ~ "18 - 65",
        AAGE > 65 ~ ">65",
      ), levels = c("<18", "18 - 65", ">65")),
      "Age Group 2"
    )
  )
proc_data <- propagate(proc_data, "adsl", "AGEGR2", "USUBJID")
#>
#> Updating: adae with: AGEGR2
#> Updating: adsaftte with: AGEGR2
#> Updating: adcm with: AGEGR2
#> Updating: addv with: AGEGR2
#> Updating: adeg with: AGEGR2
#> Updating: adex with: AGEGR2
#> Updating: adlb with: AGEGR2
#> Updating: admh with: AGEGR2
#> Updating: adrs with: AGEGR2
#> Updating: adsub with: AGEGR2
#> Updating: adtte with: AGEGR2
#> Updating: advs with: AGEGR2
run(rmpt03, proc_data, summaryvars = "AGEGR2")
#>                                                   F                            M                       All Genders
#>                                         Patients     Person time     Patients     Person time     Patients     Person time
#>   Age Group 2                           (N=231)        (N=231)       (N=169)        (N=169)       (N=400)        (N=400)
#>   ————————————————————————————————————————————————————————————————————————————————————————————————————————————————————————
#>   18 - 65                             231 (100.0%)      27364      168 (99.4%)       22124      399 (99.8%)       49488
#>   >65                                   0 (0.0%)          0          1 (0.6%)         212         1 (0.2%)         212
#>   Total patients number/person time   231 (100.0%)      27364      169 (100.0%)      22336      400 (100.0%)      49700
Extent of Exposure by Ethnic Origin for Risk Management Plan
(RMPT04)
1. Extent of Exposure by Ethnic Origin for Risk Management Plan
The rmpt04 template produces the
standard extent of exposure by ethnic origin output for the Risk
Management Plan (RMP).
run(rmpt04, syn_data)
#>                                         Patients     Person time
#>   Ethnicity                             (N=400)        (N=400)
#>   ——————————————————————————————————————————————————————————————
#>   NOT REPORTED                         27 (6.8%)        3315
#>   HISPANIC OR LATINO                   48 (12.0%)       4636
#>   NOT HISPANIC OR LATINO              308 (77.0%)       39229
#>   UNKNOWN                              17 (4.2%)        2520
#>   Total patients number/person time   400 (100.0%)      49700
Extent of Exposure by Race for Risk Management Plan
(RMPT05)
1. Extent of Exposure by Race for Risk Management Plan
The rmpt05 template produces the
standard extent of exposure by race output for the Risk Management Plan
(RMP).
run(rmpt05, syn_data)
#>                                                 Patients     Person time
#>   RACE                                          (N=400)        (N=400)
#>   ——————————————————————————————————————————————————————————————————————
#>   ASIAN                                       208 (52.0%)       25754
#>   BLACK OR AFRICAN AMERICAN                    91 (22.8%)       10718
#>   WHITE                                        74 (18.5%)       9612
#>   AMERICAN INDIAN OR ALASKA NATIVE             25 (6.2%)        3348
#>   MULTIPLE                                      1 (0.2%)         219
#>   NATIVE HAWAIIAN OR OTHER PACIFIC ISLANDER     1 (0.2%)         49
#>   Total patients number/person time           400 (100.0%)      49700
Best Overall Response (RSPT01)
1. Best Overall Response
- The
rspt01template produces the standard best overall response output. - The template syntax is built based on
RECIST 1.1. By default, the subjects with response results of"CR"or"PR"are considered as responders. - Users are expected to pre-process the input analysis data and select
the parameter to be analyzed, i.e., best overall response by
investigator or best overall response by
BICR. - Unstratified analysis is provided by default.
proc_data <- log_filter(syn_data, PARAMCD == "BESRSPI", "adrs")

run(rspt01, proc_data, ref_group = NULL, perform_analysis = "unstrat", strata = NULL)
#> Warning in stats::prop.test(tbl, correct = FALSE): Chi-squared approximation
#> may be incorrect

#> Warning in stats::prop.test(tbl, correct = FALSE): Chi-squared approximation
#> may be incorrect
#>                                          A: Drug X          B: Placebo         C: Combination
#>                                           (N=134)            (N=134)               (N=132)
#>   ——————————————————————————————————————————————————————————————————————————————————————————————
#>   Responders                            133 (99.3%)        127 (94.8%)           131 (99.2%)
#>   95% CI (Wald, with correction)       (97.4, 100.0)       (90.6, 98.9)         (97.4, 100.0)
#>   Unstratified Analysis
#>     Difference in Response rate (%)                            -4.5                 -0.0
#>       95% CI (Wald, with correction)                       (-9.3, 0.3)           (-2.8, 2.8)
#>     p-value (Chi-Squared Test)                                0.0313               0.9915
#>   Odds Ratio (95% CI)                                   0.14 (0.02 - 1.12)   0.98 (0.06 - 15.91)
#>   Complete Response (CR)                119 (88.8%)         97 (72.4%)           120 (90.9%)
#>     95% CI (Wald, with correction)     (83.09, 94.52)     (64.45, 80.33)       (85.63, 96.19)
#>   Partial Response (PR)                  14 (10.4%)         30 (22.4%)            11 (8.3%)
#>     95% CI (Wald, with correction)     (4.90, 16.00)      (14.96, 29.82)        (3.24, 13.43)
#>   Stable Disease (SD)                     1 (0.7%)           7 (5.2%)             1 (0.8%)
#>     95% CI (Wald, with correction)      (0.00, 2.58)       (1.08, 9.36)         (0.00, 2.62)
2. Best Overall Response (Ordering of treatment groups)
- By default, the first level or value of
arm_var(default to"ADSL.ARM"unless specified) is treated as the reference group without specification. - To apply user-defined reference group, please provide the value from
the treatment variable to the argument
ref_group, e.g.,ref_group = "PLACEBO". - Since
rtablesdisplays the reference group at the very left column, the order of displayed treatment groups may not be exactly the same as the order factorized, depending on which group is selected as the reference group. See below for examples:
Factorized trt order |
ref_group |
Displayed trt order |
Reference group used in analysis |
|---|---|---|---|
| ARM C, ARM B, ARM A | NULL | ARM C, ARM B, ARM A | ARM C |
| NULL | ARM B | ARM B, ARM A, ARM C | ARM B |
| ARM C, ARM B, ARM A | ARM B | ARM B, ARM C, ARM A | ARM B |
3. Best Overall Response (selecting sections to display)
- The section of
Odds Ratiocan be suppressed with the argumentodds_ratio = FALSE. - The section of
Difference in response ratecan be suppressed with the argumentperform_analysis = NULL.
proc_data <- log_filter(syn_data, PARAMCD == "BESRSPI", "adrs")

run(rspt01, proc_data, odds_ratio = FALSE, perform_analysis = NULL)
#>                                        A: Drug X        B: Placebo     C: Combination
#>                                         (N=134)          (N=134)          (N=132)
#>   ———————————————————————————————————————————————————————————————————————————————————
#>   Responders                          133 (99.3%)      127 (94.8%)      131 (99.2%)
#>   95% CI (Wald, with correction)     (97.4, 100.0)     (90.6, 98.9)    (97.4, 100.0)
#>   Complete Response (CR)              119 (88.8%)       97 (72.4%)      120 (90.9%)
#>     95% CI (Wald, with correction)   (83.09, 94.52)   (64.45, 80.33)   (85.63, 96.19)
#>   Partial Response (PR)                14 (10.4%)       30 (22.4%)       11 (8.3%)
#>     95% CI (Wald, with correction)   (4.90, 16.00)    (14.96, 29.82)   (3.24, 13.43)
#>   Stable Disease (SD)                   1 (0.7%)         7 (5.2%)         1 (0.8%)
#>     95% CI (Wald, with correction)    (0.00, 2.58)     (1.08, 9.36)     (0.00, 2.62)
4. Best Overall Response (with stratified analysis)
- A stratified analysis can be added by specifying the argument
perform_analysis = "strat"and providing the stratification variable to the argumentstrata. The argumentstratais expected ifperform_analysisis set to include stratified analysis. - The stratification variables are expected to be available in
adrs. - If both unstratified and stratified analysis are required, use
perform_analysis = c("unstrat", "strat")
proc_data <- log_filter(syn_data, PARAMCD == "BESRSPI", "adrs")

run(rspt01, proc_data, perform_analysis = "strat", strata = c("STRATA1", "STRATA2"))
#>                                                A: Drug X          B: Placebo         C: Combination
#>                                                 (N=134)            (N=134)               (N=132)
#>   ————————————————————————————————————————————————————————————————————————————————————————————————————
#>   Responders                                  133 (99.3%)        127 (94.8%)           131 (99.2%)
#>   95% CI (Wald, with correction)             (97.4, 100.0)       (90.6, 98.9)         (97.4, 100.0)
#>   Stratified Analysis
#>     Difference in Response rate (%)                                  -4.4                  0.1
#>       95% CI (CMH, without correction)                           (-8.5, -0.3)          (-2.2, 2.3)
#>     p-value (Cochran-Mantel-Haenszel Test)                          0.0344               0.9560
#>   Odds Ratio (95% CI)                                         0.14 (0.02 - 1.12)   0.98 (0.06 - 15.91)
#>   Complete Response (CR)                      119 (88.8%)         97 (72.4%)           120 (90.9%)
#>     95% CI (Wald, with correction)           (83.09, 94.52)     (64.45, 80.33)       (85.63, 96.19)
#>   Partial Response (PR)                        14 (10.4%)         30 (22.4%)            11 (8.3%)
#>     95% CI (Wald, with correction)           (4.90, 16.00)      (14.96, 29.82)        (3.24, 13.43)
#>   Stable Disease (SD)                           1 (0.7%)           7 (5.2%)             1 (0.8%)
#>     95% CI (Wald, with correction)            (0.00, 2.58)       (1.08, 9.36)         (0.00, 2.62)
5. Best Overall Response (modifying analysis details like type of confidence interval, alpha level, test for p-value)
- The level of the confidence intervals is defined by the argument
conf_level. - The methods to construct confidence interval and p-value are
controlled by the argument
methods. It is a named list with five optional sub-arguments. For example,methods = list(prop_conf_method = "wald", diff_conf_method = "wald", strat_diff_conf_method = "ha", diff_pval_method = "fisher", strat_diff_pval_method = "schouten")
See table below for what each argument controls and the available method options:
| Arguments | Methods Controlled | Methods Options |
|---|---|---|
prop_conf_method |
proportion confidence interval |
"waldcc" (default), "wald",
etc. |
diff_conf_method |
unstratified difference confidence interval |
"waldcc" (default), "wald",
etc. |
diff_pval_method |
unstratified p-value for odds ratio |
"chisq" (default),
"fisher"
|
strat_diff_conf_method |
stratified difference confidence interval |
"cmh" (default), "ha"
|
strat_diff_pval_method |
stratified p-value for odds ratio |
"cmh" (default),
"schouten"
|
See in the table below the method options for estimates of proportions and the associated statistical methods:
| Method Options | Statistical Methods |
|---|---|
"clopper-pearson" |
Clopper-Pearson |
"wald" |
Wald, without correction |
"waldcc" |
Wald, with correction |
"wilson" |
Wilson, without correction |
"strat_wilson" |
Stratified Wilson, without correction |
"wilsonc" |
Wilson, with correction |
"strat_wilsonc" |
Stratified Wilson, with correction |
"agresti-coull" |
Agresti-Coull |
"jeffreys" |
Jeffreys |
See in the table below the method options for estimates of proportion difference and the associated statistical methods:
| Method Options | Statistical Methods |
|---|---|
"cmh" |
CMH, without correction |
"wald" |
Wald, with correction |
"waldcc" |
Wald, without correction |
"ha" |
Anderson-Hauck |
"newcombe" |
Newcombe, without correction |
"newcombecc" |
Newcombe, with correction |
"strat_wilsonc" |
Stratified Wilson, with correction |
"strat_newcombe" |
Stratified Newcombe, without correction |
"strat_newcombecc" |
Stratified Newcombe, with correction |
See in the table below the method options for testing proportion difference and the associated statistical methods:
| Method Options | Statistical Methods |
|---|---|
"chisq" |
Chi-Squared test |
"fisher" |
the Fisher’s exact test |
"cmh" |
stratified Cochran-Mantel-Haenszel test |
"shouten" |
Chi-Squared test with Schouten correction |
An example:
proc_data <- log_filter(syn_data, PARAMCD == "BESRSPI", "adrs")

run(rspt01, proc_data,
  conf_level = 0.90,
  methods = list(
    prop_conf_method = "wald",
    diff_conf_method = "wald",
    diff_pval_method = "fisher"
  )
)
#>                                             A: Drug X          B: Placebo         C: Combination
#>                                              (N=134)            (N=134)               (N=132)
#>   —————————————————————————————————————————————————————————————————————————————————————————————————
#>   Responders                               133 (99.3%)        127 (94.8%)           131 (99.2%)
#>   90% CI (Wald, without correction)       (98.0, 100.0)       (91.6, 97.9)         (98.0, 100.0)
#>   Unstratified Analysis
#>     Difference in Response rate (%)                               -4.5                 -0.0
#>       90% CI (Wald, without correction)                       (-7.9, -1.1)          (-1.8, 1.7)
#>     p-value (Fisher's Exact Test)                                0.0662               1.0000
#>   Odds Ratio (95% CI)                                      0.14 (0.02 - 1.12)   0.98 (0.06 - 15.91)
#>   Complete Response (CR)                   119 (88.8%)         97 (72.4%)           120 (90.9%)
#>     90% CI (Wald, without correction)     (84.33, 93.29)     (66.04, 78.74)       (86.79, 95.02)
#>   Partial Response (PR)                     14 (10.4%)         30 (22.4%)            11 (8.3%)
#>     90% CI (Wald, without correction)     (6.10, 14.79)      (16.46, 28.31)        (4.38, 12.29)
#>   Stable Disease (SD)                        1 (0.7%)           7 (5.2%)             1 (0.8%)
#>     90% CI (Wald, without correction)      (0.00, 1.97)       (2.06, 8.39)         (0.00, 2.00)
6. Best Overall Response (modifying the definition of overall response)
The following example shows how to customize the definition of responder, e.g, consider only complete response as response.
proc_data <- log_filter(syn_data, PARAMCD == "BESRSPI", "adrs")

preprocess(rspt01) <- function(adam_db, ...) {
  adam_db$adrs <- adam_db$adrs %>%
    mutate(RSP_LAB = tern::d_onco_rsp_label(.data$AVALC)) %>%
    mutate(IS_RSP = .data$AVALC %in% c("CR"))
  adam_db
}

run(rspt01, proc_data)
#>                                          A: Drug X          B: Placebo         C: Combination
#>                                           (N=134)            (N=134)              (N=132)
#>   —————————————————————————————————————————————————————————————————————————————————————————————
#>   Responders                            119 (88.8%)         97 (72.4%)          120 (90.9%)
#>   95% CI (Wald, with correction)        (83.1, 94.5)       (64.4, 80.3)         (85.6, 96.2)
#>   Unstratified Analysis
#>     Difference in Response rate (%)                           -16.4                 2.1
#>       95% CI (Wald, with correction)                      (-26.4, -6.4)         (-5.9, 10.1)
#>     p-value (Chi-Squared Test)                                0.0007               0.5701
#>   Odds Ratio (95% CI)                                   0.33 (0.17 - 0.64)   1.26 (0.57 - 2.81)
#>   Complete Response (CR)                119 (88.8%)         97 (72.4%)          120 (90.9%)
#>     95% CI (Wald, with correction)     (83.09, 94.52)     (64.45, 80.33)       (85.63, 96.19)
#>   Partial Response (PR)                  14 (10.4%)         30 (22.4%)           11 (8.3%)
#>     95% CI (Wald, with correction)     (4.90, 16.00)      (14.96, 29.82)       (3.24, 13.43)
#>   Stable Disease (SD)                     1 (0.7%)           7 (5.2%)             1 (0.8%)
#>     95% CI (Wald, with correction)      (0.00, 2.58)       (1.08, 9.36)         (0.00, 2.62)
Time-to-event Summary (TTET01)
1. Time-to-event Summary
- The
ttet01template produces the standard time-to-event summary. - Users are expected to subset the parameter of interest
(e.g.
PARAMCD == "PFS") in pre-processing. - Please see the section of Best Overall Response (Ordering of treatment groups) to find out more about the ordering of treatment groups and reference group.
- Unstratified analysis is provided by default.
- Survival estimations and difference in survival are both provided by default.
proc_data <- log_filter(syn_data, PARAMCD == "PFS", "adtte")

run(ttet01, proc_data)
#>                                        A: Drug X        B: Placebo      C: Combination
#>                                         (N=134)           (N=134)           (N=132)
#>   —————————————————————————————————————————————————————————————————————————————————————
#>   Patients with event (%)             86 (64.2%)        90 (67.2%)        92 (69.7%)
#>     Earliest contributing event
#>       Death                               38                48                41
#>       Disease Progression                 48                42                51
#>   Patients without event (%)          48 (35.8%)        44 (32.8%)        40 (30.3%)
#>   Time to Event (MONTHS)
#>     Median                               16.9              19.7              12.3
#>       95% CI                         (12.8, 19.0)      (13.3, 25.2)       (8.4, 14.9)
#>     25% and 75%-ile                    7.7, 30.0         7.2, 34.1         4.5, 25.3
#>     Range                           0.3 to 85.8 {1}   0.1 to 83.0 {2}   0.2 to 81.8 {2}
#>   Unstratified Analysis
#>     p-value (log-rank)                                    0.4808            0.0429
#>     Hazard Ratio                                           0.90              1.36
#>     95% CI                                             (0.67, 1.21)      (1.01, 1.82)
#>   6 MONTHS
#>     Patients remaining at risk            87                92                77
#>     Event Free Rate (%)                  77.27             77.85             67.70
#>     95% CI                          (69.83, 84.71)    (70.59, 85.10)    (59.42, 75.99)
#>     Difference in Event Free Rate                          0.57              -9.57
#>       95% CI                                          (-9.82, 10.97)    (-20.70, 1.57)
#>       p-value (Z-test)                                    0.9137            0.0921
#>   12 MONTHS
#>     Patients remaining at risk            65                68                51
#>     Event Free Rate (%)                  62.83             62.69             50.16
#>     95% CI                          (54.04, 71.63)    (53.97, 71.42)    (41.00, 59.32)
#>     Difference in Event Free Rate                          -0.14            -12.68
#>       95% CI                                          (-12.53, 12.25)   (-25.38, 0.03)
#>       p-value (Z-test)                                    0.9822            0.0505
#>   —————————————————————————————————————————————————————————————————————————————————————
#>
#>   {1} - Censored observation: range minimum
#>   {2} - Censored observation: range maximum
#>   —————————————————————————————————————————————————————————————————————————————————————
2. Time-to-event Summary (selecting sections to display)
To suspend the section of earliest contributing events, use
summarize_event = FALSE.
proc_data <- log_filter(syn_data, PARAMCD == "PFS", "adtte")

run(ttet01, proc_data, summarize_event = FALSE)
#>                                        A: Drug X        B: Placebo      C: Combination
#>                                         (N=134)           (N=134)           (N=132)
#>   —————————————————————————————————————————————————————————————————————————————————————
#>   Patients with event (%)             86 (64.2%)        90 (67.2%)        92 (69.7%)
#>   Patients without event (%)          48 (35.8%)        44 (32.8%)        40 (30.3%)
#>   Time to Event (MONTHS)
#>     Median                               16.9              19.7              12.3
#>       95% CI                         (12.8, 19.0)      (13.3, 25.2)       (8.4, 14.9)
#>     25% and 75%-ile                    7.7, 30.0         7.2, 34.1         4.5, 25.3
#>     Range                           0.3 to 85.8 {1}   0.1 to 83.0 {2}   0.2 to 81.8 {2}
#>   Unstratified Analysis
#>     p-value (log-rank)                                    0.4808            0.0429
#>     Hazard Ratio                                           0.90              1.36
#>     95% CI                                             (0.67, 1.21)      (1.01, 1.82)
#>   6 MONTHS
#>     Patients remaining at risk            87                92                77
#>     Event Free Rate (%)                  77.27             77.85             67.70
#>     95% CI                          (69.83, 84.71)    (70.59, 85.10)    (59.42, 75.99)
#>     Difference in Event Free Rate                          0.57              -9.57
#>       95% CI                                          (-9.82, 10.97)    (-20.70, 1.57)
#>       p-value (Z-test)                                    0.9137            0.0921
#>   12 MONTHS
#>     Patients remaining at risk            65                68                51
#>     Event Free Rate (%)                  62.83             62.69             50.16
#>     95% CI                          (54.04, 71.63)    (53.97, 71.42)    (41.00, 59.32)
#>     Difference in Event Free Rate                          -0.14            -12.68
#>       95% CI                                          (-12.53, 12.25)   (-25.38, 0.03)
#>       p-value (Z-test)                                    0.9822            0.0505
#>   —————————————————————————————————————————————————————————————————————————————————————
#>
#>   {1} - Censored observation: range minimum
#>   {2} - Censored observation: range maximum
#>   —————————————————————————————————————————————————————————————————————————————————————
To select either survival estimations or difference in survival or
both, please specify in the argument method. -
surv calls out the analysis of patients remaining at risk,
event free rate and corresponding 95% confidence interval of the rates.
- surv_diff calls out the analysis of difference in event
free rate, the 95% confidence interval of the difference and its
corresponding p-value. - both calls out both.
proc_data <- log_filter(syn_data, PARAMCD == "PFS", "adtte")

run(ttet01, proc_data, method = "surv")
#>                                      A: Drug X        B: Placebo      C: Combination
#>                                       (N=134)           (N=134)           (N=132)
#>   ———————————————————————————————————————————————————————————————————————————————————
#>   Patients with event (%)           86 (64.2%)        90 (67.2%)        92 (69.7%)
#>     Earliest contributing event
#>       Death                             38                48                41
#>       Disease Progression               48                42                51
#>   Patients without event (%)        48 (35.8%)        44 (32.8%)        40 (30.3%)
#>   Time to Event (MONTHS)
#>     Median                             16.9              19.7              12.3
#>       95% CI                       (12.8, 19.0)      (13.3, 25.2)       (8.4, 14.9)
#>     25% and 75%-ile                  7.7, 30.0         7.2, 34.1         4.5, 25.3
#>     Range                         0.3 to 85.8 {1}   0.1 to 83.0 {2}   0.2 to 81.8 {2}
#>   Unstratified Analysis
#>     p-value (log-rank)                                  0.4808            0.0429
#>     Hazard Ratio                                         0.90              1.36
#>     95% CI                                           (0.67, 1.21)      (1.01, 1.82)
#>   6 MONTHS
#>     Patients remaining at risk          87                92                77
#>     Event Free Rate (%)                77.27             77.85             67.70
#>     95% CI                        (69.83, 84.71)    (70.59, 85.10)    (59.42, 75.99)
#>   12 MONTHS
#>     Patients remaining at risk          65                68                51
#>     Event Free Rate (%)                62.83             62.69             50.16
#>     95% CI                        (54.04, 71.63)    (53.97, 71.42)    (41.00, 59.32)
#>   ———————————————————————————————————————————————————————————————————————————————————
#>
#>   {1} - Censored observation: range minimum
#>   {2} - Censored observation: range maximum
#>   ———————————————————————————————————————————————————————————————————————————————————
3. Time-to-event Summary (modifying analysis details like confidence interval type, ties, and alpha level)
- The level of the confidence intervals is defined by the argument
conf_level. - The type of confidence interval is defined in the argument
conf_type. Options are"plain"(default),"log"and"log-log". - Handling of ties is specified in the argument
ties. Options are"efron"(default),"breslow"or"exact".
proc_data <- log_filter(syn_data, PARAMCD == "PFS", "adtte")

run(ttet01, proc_data, conf_level = 0.90, conf_type = "log-log", ties = "efron")
#>                                        A: Drug X        B: Placebo      C: Combination
#>                                         (N=134)           (N=134)           (N=132)
#>   —————————————————————————————————————————————————————————————————————————————————————
#>   Patients with event (%)             86 (64.2%)        90 (67.2%)        92 (69.7%)
#>     Earliest contributing event
#>       Death                               38                48                41
#>       Disease Progression                 48                42                51
#>   Patients without event (%)          48 (35.8%)        44 (32.8%)        40 (30.3%)
#>   Time to Event (MONTHS)
#>     Median                               16.9              19.7              12.3
#>       90% CI                         (13.0, 18.1)      (14.5, 25.0)       (8.7, 14.2)
#>     25% and 75%-ile                    7.7, 30.0         7.2, 34.1         4.5, 25.3
#>     Range                           0.3 to 85.8 {1}   0.1 to 83.0 {2}   0.2 to 81.8 {2}
#>   Unstratified Analysis
#>     p-value (log-rank)                                    0.4808            0.0429
#>     Hazard Ratio                                           0.90              1.36
#>     90% CI                                             (0.70, 1.15)      (1.06, 1.74)
#>   6 MONTHS
#>     Patients remaining at risk            87                92                77
#>     Event Free Rate (%)                  77.27             77.85             67.70
#>     90% CI                          (70.28, 82.82)    (71.02, 83.26)    (60.20, 74.10)
#>     Difference in Event Free Rate                          0.57              -9.57
#>       90% CI                                           (-8.15, 9.30)    (-18.91, -0.22)
#>       p-value (Z-test)                                    0.9137            0.0921
#>   12 MONTHS
#>     Patients remaining at risk            65                68                51
#>     Event Free Rate (%)                  62.83             62.69             50.16
#>     90% CI                          (54.97, 69.71)    (54.90, 69.52)    (42.25, 57.55)
#>     Difference in Event Free Rate                          -0.14            -12.68
#>       90% CI                                          (-10.54, 10.26)   (-23.33, -2.02)
#>       p-value (Z-test)                                    0.9822            0.0505
#>   —————————————————————————————————————————————————————————————————————————————————————
#>
#>   {1} - Censored observation: range minimum
#>   {2} - Censored observation: range maximum
#>   —————————————————————————————————————————————————————————————————————————————————————
4. Time-to-event Summary (with stratified analysis)
- A stratified analysis can be added by specifying the argument
perform_analysis = "strat"and providing the stratification variable to the argumentstrata. The argumentstratais expected ifperform_analysisis set to include stratified analysis. - The stratification variables are expected to be available in
adrs. - If unstratified and stratified analysis are both required, users can
use
perform_analysis = c("unstrat", "strat").
proc_data <- log_filter(syn_data, PARAMCD == "PFS", "adtte")

run(ttet01, proc_data, perform_analysis = "strat", strata = "STRATA1")
#>                                        A: Drug X        B: Placebo      C: Combination
#>                                         (N=134)           (N=134)           (N=132)
#>   —————————————————————————————————————————————————————————————————————————————————————
#>   Patients with event (%)             86 (64.2%)        90 (67.2%)        92 (69.7%)
#>     Earliest contributing event
#>       Death                               38                48                41
#>       Disease Progression                 48                42                51
#>   Patients without event (%)          48 (35.8%)        44 (32.8%)        40 (30.3%)
#>   Time to Event (MONTHS)
#>     Median                               16.9              19.7              12.3
#>       95% CI                         (12.8, 19.0)      (13.3, 25.2)       (8.4, 14.9)
#>     25% and 75%-ile                    7.7, 30.0         7.2, 34.1         4.5, 25.3
#>     Range                           0.3 to 85.8 {1}   0.1 to 83.0 {2}   0.2 to 81.8 {2}
#>   Stratified Analysis
#>     p-value (log-rank)                                    0.7030            0.0228
#>     Hazard Ratio                                           0.94              1.42
#>     95% CI                                             (0.70, 1.27)      (1.05, 1.91)
#>   6 MONTHS
#>     Patients remaining at risk            87                92                77
#>     Event Free Rate (%)                  77.27             77.85             67.70
#>     95% CI                          (69.83, 84.71)    (70.59, 85.10)    (59.42, 75.99)
#>     Difference in Event Free Rate                          0.57              -9.57
#>       95% CI                                          (-9.82, 10.97)    (-20.70, 1.57)
#>       p-value (Z-test)                                    0.9137            0.0921
#>   12 MONTHS
#>     Patients remaining at risk            65                68                51
#>     Event Free Rate (%)                  62.83             62.69             50.16
#>     95% CI                          (54.04, 71.63)    (53.97, 71.42)    (41.00, 59.32)
#>     Difference in Event Free Rate                          -0.14            -12.68
#>       95% CI                                          (-12.53, 12.25)   (-25.38, 0.03)
#>       p-value (Z-test)                                    0.9822            0.0505
#>   —————————————————————————————————————————————————————————————————————————————————————
#>
#>   {1} - Censored observation: range minimum
#>   {2} - Censored observation: range maximum
#>   —————————————————————————————————————————————————————————————————————————————————————
5. Time-to-event Summary (modifying time point for the “survival at xx months” analysis)
The time point for the “survival at xx months” analysis can be
modified by specifying the argument time_point. By default,
the function takes AVAL from adtte in days and
converts it to months. The survival estimates are then summarized in
month, and the numeric values should be provided in months to
time_point.
proc_data <- log_filter(syn_data, PARAMCD == "PFS", "adtte")

run(ttet01, proc_data, perform_analysis = "unstrat", time_point = c(3, 6))
#>                                        A: Drug X        B: Placebo      C: Combination
#>                                         (N=134)           (N=134)           (N=132)
#>   —————————————————————————————————————————————————————————————————————————————————————
#>   Patients with event (%)             86 (64.2%)        90 (67.2%)        92 (69.7%)
#>     Earliest contributing event
#>       Death                               38                48                41
#>       Disease Progression                 48                42                51
#>   Patients without event (%)          48 (35.8%)        44 (32.8%)        40 (30.3%)
#>   Time to Event (MONTHS)
#>     Median                               16.9              19.7              12.3
#>       95% CI                         (12.8, 19.0)      (13.3, 25.2)       (8.4, 14.9)
#>     25% and 75%-ile                    7.7, 30.0         7.2, 34.1         4.5, 25.3
#>     Range                           0.3 to 85.8 {1}   0.1 to 83.0 {2}   0.2 to 81.8 {2}
#>   Unstratified Analysis
#>     p-value (log-rank)                                    0.4808            0.0429
#>     Hazard Ratio                                           0.90              1.36
#>     95% CI                                             (0.67, 1.21)      (1.01, 1.82)
#>   3 MONTHS
#>     Patients remaining at risk            109               109               100
#>     Event Free Rate (%)                  86.75             86.79             82.01
#>     95% CI                          (80.88, 92.62)    (80.93, 92.64)    (75.35, 88.68)
#>     Difference in Event Free Rate                          0.03              -4.74
#>       95% CI                                           (-8.26, 8.32)    (-13.62, 4.14)
#>       p-value (Z-test)                                    0.9939            0.2954
#>   6 MONTHS
#>     Patients remaining at risk            87                92                77
#>     Event Free Rate (%)                  77.27             77.85             67.70
#>     95% CI                          (69.83, 84.71)    (70.59, 85.10)    (59.42, 75.99)
#>     Difference in Event Free Rate                          0.57              -9.57
#>       95% CI                                          (-9.82, 10.97)    (-20.70, 1.57)
#>       p-value (Z-test)                                    0.9137            0.0921
#>   —————————————————————————————————————————————————————————————————————————————————————
#>
#>   {1} - Censored observation: range minimum
#>   {2} - Censored observation: range maximum
#>   —————————————————————————————————————————————————————————————————————————————————————
The following example shows how to specify the time point in user-defined unit.
proc_data <- log_filter(syn_data, PARAMCD == "PFS", "adtte")

preprocess(ttet01) <- function(adam_db, dataset = "adtte",
                               ...) {
  adam_db[[dataset]] <- adam_db[[dataset]] %>%
    mutate(
      AVALU = "DAYS",
      IS_EVENT = .data$CNSR == 0,
      IS_NOT_EVENT = .data$CNSR == 1,
      EVNT1 = factor(
        case_when(
          IS_EVENT == TRUE ~ render_safe("{Patient_label} with event (%)"),
          IS_EVENT == FALSE ~ render_safe("{Patient_label} without event (%)")
        ),
        levels = render_safe(c("{Patient_label} with event (%)", "{Patient_label} without event (%)"))
      ),
      EVNTDESC = factor(.data$EVNTDESC)
    )

  adam_db
}

run(ttet01, proc_data, perform_analysis = "unstrat", time_point = c(91, 183))
#>                                         A: Drug X           B: Placebo        C: Combination
#>                                          (N=134)              (N=134)             (N=132)
#>   ————————————————————————————————————————————————————————————————————————————————————————————
#>   Patients with event (%)               86 (64.2%)          90 (67.2%)          92 (69.7%)
#>     Earliest contributing event
#>       Death                                 38                  48                  41
#>       Disease Progression                   48                  42                  51
#>   Patients without event (%)            48 (35.8%)          44 (32.8%)          40 (30.3%)
#>   Time to Event (DAYS)
#>     Median                                513.4                600.4               372.9
#>       95% CI                          (388.3, 576.8)      (404.1, 765.8)      (256.4, 453.2)
#>     25% and 75%-ile                    233.4, 914.1        218.6, 1037.2       136.5, 769.6
#>     Range                           10.3 to 2610.5 {1}   3.1 to 2527.0 {2}   6.5 to 2489.0 {2}
#>   Unstratified Analysis
#>     p-value (log-rank)                                        0.4808              0.0429
#>     Hazard Ratio                                               0.90                1.36
#>     95% CI                                                 (0.67, 1.21)        (1.01, 1.82)
#>   91 DAYS
#>     Patients remaining at risk             109                  109                 100
#>     Event Free Rate (%)                   86.75                86.79               82.01
#>     95% CI                            (80.88, 92.62)      (80.93, 92.64)      (75.35, 88.68)
#>     Difference in Event Free Rate                              0.03                -4.74
#>       95% CI                                               (-8.26, 8.32)      (-13.62, 4.14)
#>       p-value (Z-test)                                        0.9939              0.2954
#>   183 DAYS
#>     Patients remaining at risk              87                  92                  77
#>     Event Free Rate (%)                   77.27                77.85               67.70
#>     95% CI                            (69.83, 84.71)      (70.59, 85.10)      (59.42, 75.99)
#>     Difference in Event Free Rate                              0.57                -9.57
#>       95% CI                                              (-9.82, 10.97)      (-20.70, 1.57)
#>       p-value (Z-test)                                        0.9137              0.0921
#>   ————————————————————————————————————————————————————————————————————————————————————————————
#>
#>   {1} - Censored observation: range minimum
#>   {2} - Censored observation: range maximum
#>   ————————————————————————————————————————————————————————————————————————————————————————————
6. Time-to-event Summary (modifying the p-value method for testing hazard ratio)
The default p-value method for testing hazard ratio is “log-rank”.
Alternative methods can be requested by specifying the argument
pval_method and options include, log-rank
(default), wald or likelihood. The syntax
currently does not allow requesting more than one p-value.
Note that ttet01 has been modified in the previous
example (i.e., preprocess(ttet01) has been overridden); to
access the default template, try chevron::ttet01.
proc_data <- log_filter(syn_data, PARAMCD == "PFS", "adtte")

run(chevron::ttet01, proc_data, pval_method = "wald")
#>                                        A: Drug X        B: Placebo      C: Combination
#>                                         (N=134)           (N=134)           (N=132)
#>   —————————————————————————————————————————————————————————————————————————————————————
#>   Patients with event (%)             86 (64.2%)        90 (67.2%)        92 (69.7%)
#>     Earliest contributing event
#>       Death                               38                48                41
#>       Disease Progression                 48                42                51
#>   Patients without event (%)          48 (35.8%)        44 (32.8%)        40 (30.3%)
#>   Time to Event (MONTHS)
#>     Median                               16.9              19.7              12.3
#>       95% CI                         (12.8, 19.0)      (13.3, 25.2)       (8.4, 14.9)
#>     25% and 75%-ile                    7.7, 30.0         7.2, 34.1         4.5, 25.3
#>     Range                           0.3 to 85.8 {1}   0.1 to 83.0 {2}   0.2 to 81.8 {2}
#>   Unstratified Analysis
#>     p-value (wald)                                        0.4810            0.0437
#>     Hazard Ratio                                           0.90              1.36
#>     95% CI                                             (0.67, 1.21)      (1.01, 1.82)
#>   6 MONTHS
#>     Patients remaining at risk            87                92                77
#>     Event Free Rate (%)                  77.27             77.85             67.70
#>     95% CI                          (69.83, 84.71)    (70.59, 85.10)    (59.42, 75.99)
#>     Difference in Event Free Rate                          0.57              -9.57
#>       95% CI                                          (-9.82, 10.97)    (-20.70, 1.57)
#>       p-value (Z-test)                                    0.9137            0.0921
#>   12 MONTHS
#>     Patients remaining at risk            65                68                51
#>     Event Free Rate (%)                  62.83             62.69             50.16
#>     95% CI                          (54.04, 71.63)    (53.97, 71.42)    (41.00, 59.32)
#>     Difference in Event Free Rate                          -0.14            -12.68
#>       95% CI                                          (-12.53, 12.25)   (-25.38, 0.03)
#>       p-value (Z-test)                                    0.9822            0.0505
#>   —————————————————————————————————————————————————————————————————————————————————————
#>
#>   {1} - Censored observation: range minimum
#>   {2} - Censored observation: range maximum
#>   —————————————————————————————————————————————————————————————————————————————————————
Vital Signs (VST01)
1. Vital Sign Results and Change from Baseline by Visit
t_vs_chg <- run(vst01, syn_data)
head(t_vs_chg, 20)
#>                                         A: Drug X                         B: Placebo                       C: Combination
#>                                                Change from                        Change from                        Change from
#>                              Value at Visit      Baseline      Value at Visit      Baseline       Value at Visit      Baseline
#>                                 (N=134)          (N=134)          (N=134)           (N=134)          (N=132)           (N=132)
#>   ————————————————————————————————————————————————————————————————————————————————————————————————————————————————————————————————
#>   Diastolic Blood Pressure
#>     SCREENING
#>       n                           134               0               134                0               132                0
#>       Mean (SD)              49.968 (7.197)      NE (NE)       50.753 (8.429)       NE (NE)       50.192 (7.627)       NE (NE)
#>       Median                     49.706             NE             50.087             NE              49.641             NE
#>       Min - Max              31.69 - 71.19       NE - NE       29.26 - 69.21        NE - NE       26.89 - 69.98        NE - NE
#>     BASELINE
#>       n                           134                               134                                132
#>       Mean (SD)              48.602 (7.962)                    50.442 (7.948)                     51.107 (7.790)
#>       Median                     48.418                            50.179                             50.804
#>       Min - Max              27.71 - 64.64                     21.68 - 67.51                      29.75 - 71.40
#>     WEEK 1 DAY 8
#>       n                           134              134              134               134              132               132
#>       Mean (SD)              50.260 (7.514)   1.658 (10.774)   49.674 (7.743)   -0.767 (10.947)   48.855 (7.888)   -2.251 (10.380)
#>       Median                     50.088           0.607            49.747           -1.114            47.677           -2.229
#>       Min - Max              33.04 - 68.98    -20.37 - 29.94   33.71 - 66.49    -25.80 - 28.37    30.39 - 66.99    -22.06 - 22.44
#>     WEEK 2 DAY 15
#>       n                           134              134              134               134              132               132
#>       Mean (SD)              50.836 (7.850)   2.234 (11.752)   49.718 (8.445)   -0.724 (12.444)   49.981 (8.338)   -1.126 (11.639)
#>       Median                     51.437           3.126            50.227           -0.709            51.007           -2.271
Vital Signs Abnormalities (Regardless of Abnormality at
Baseline) (VST02_1)
1. Vital Sign Abnormalities (Regardless of Abnormality at Baseline)
run(vst02_1, syn_data)
#>   Assessment                   A: Drug X        B: Placebo     C: Combination
#>    Abnormality                  (N=134)          (N=134)          (N=132)
#>   ———————————————————————————————————————————————————————————————————————————
#>   Diastolic Blood Pressure
#>     Low                      69/134 (51.5%)   73/134 (54.5%)   67/132 (50.8%)
#>     High                     76/134 (56.7%)    67/134 (50%)    65/132 (49.2%)
#>   Pulse Rate
#>     Low                       75/134 (56%)     67/134 (50%)    69/132 (52.3%)
#>     High                      67/134 (50%)    74/134 (55.2%)   53/132 (40.2%)
#>   Respiratory Rate
#>     Low                      70/134 (52.2%)   72/134 (53.7%)   64/132 (48.5%)
#>     High                      75/134 (56%)    65/134 (48.5%)   71/132 (53.8%)
#>   Systolic Blood Pressure
#>     Low                       71/134 (53%)    69/134 (51.5%)    70/132 (53%)
#>     High                     78/134 (58.2%)   62/134 (46.3%)   64/132 (48.5%)
#>   Temperature
#>     Low                      66/134 (49.3%)   68/134 (50.7%)   81/132 (61.4%)
#>     High                      67/134 (50%)    66/134 (49.3%)   69/132 (52.3%)
#>   Weight
#>     Low                      73/134 (54.5%)    71/134 (53%)    76/132 (57.6%)
#>     High                     69/134 (51.5%)   74/134 (55.2%)   74/132 (56.1%)
Vital Signs Abnormalities (Among Subject Without Abnormality
at Baseline) (VST02_2)
1. Vital Sign Abnormalities (Among Subject Without Abnormality at Baseline)
run(vst02_2, syn_data)
#>   Assessment                   A: Drug X        B: Placebo     C: Combination
#>    Abnormality                  (N=134)          (N=134)          (N=132)
#>   ———————————————————————————————————————————————————————————————————————————
#>   Diastolic Blood Pressure
#>     Low                      55/120 (45.8%)   60/121 (49.6%)   53/118 (44.9%)
#>     High                     55/113 (48.7%)   56/123 (45.5%)   52/119 (43.7%)
#>   Pulse Rate
#>     Low                      66/125 (52.8%)   54/121 (44.6%)   55/118 (46.6%)
#>     High                     52/119 (43.7%)   59/119 (49.6%)   38/117 (32.5%)
#>   Respiratory Rate
#>     Low                       59/123 (48%)    56/118 (47.5%)   50/118 (42.4%)
#>     High                     65/124 (52.4%)   58/127 (45.7%)   57/118 (48.3%)
#>   Systolic Blood Pressure
#>     Low                      53/116 (45.7%)   55/120 (45.8%)   58/120 (48.3%)
#>     High                     65/121 (53.7%)   53/125 (42.4%)   56/124 (45.2%)
#>   Temperature
#>     Low                      51/119 (42.9%)   53/119 (44.5%)   64/115 (55.7%)
#>     High                     61/128 (47.7%)   53/121 (43.8%)   59/122 (48.4%)
#>   Weight
#>     Low                      59/120 (49.2%)   54/117 (46.2%)   63/119 (52.9%)
#>     High                     58/123 (47.2%)   61/121 (50.4%)   55/113 (48.7%)
LISTINGS
Glossary of Adverse Event Preferred Terms and
Investigator-Specified Terms (AEL01_NOLLT)
1. Glossary of Adverse Event Preferred Terms and Investigator-Specified Terms
- The
ael01_nollttemplate produces the standard glossary of adverse event preferred terms and investigator-specified terms. - The example below uses
headfunction to print only the first 10 lines of the output.
l_ae_nollt <- run(ael01_nollt, syn_data)
head(l_ae_nollt, 10)
#> MedDRA System Organ Class   MedDRA Preferred Term   Reported Term for the Adverse Event
#> ———————————————————————————————————————————————————————————————————————————————————————
#> cl A.1                      dcd A.1.1.1.1           trm A.1.1.1.1
#>                             dcd A.1.1.1.2           trm A.1.1.1.2
#> cl B.1                      dcd B.1.1.1.1           trm B.1.1.1.1
#> cl B.2                      dcd B.2.1.2.1           trm B.2.1.2.1
#>                             dcd B.2.2.3.1           trm B.2.2.3.1
#> cl C.1                      dcd C.1.1.1.3           trm C.1.1.1.3
#> cl C.2                      dcd C.2.1.2.1           trm C.2.1.2.1
#> cl D.1                      dcd D.1.1.1.1           trm D.1.1.1.1
#>                             dcd D.1.1.4.2           trm D.1.1.4.2
#> cl D.2                      dcd D.2.1.5.3           trm D.2.1.5.3
Graphics
Kaplan-Meier Plot (KMG01)
1. Kaplan-Meier Plot (without comparative statistics)
- The
kmg01template produces the standard Kaplan-Meier Plot. - Users are expected to select a particular parameter for analysis.
- Users are expected to select the treatment groups to compare, otherwise, all treatment groups available in the input datasets will be plotted.
- The comparative statistics are not included by default.
- The estimation of median survival time per treatment group by default.
- By default, the
runfunction will not render the plot. For viewing and testing purpose, the users can include the argumentdraw = TRUEto view the plot in thePlotstab. - More arguments in the
g_kmandcontrol_coxphfunctions can be passed through, please use the Help to find out more information.
proc_data <- log_filter(syn_data, PARAMCD == "OS", "adtte")
run(kmg01, proc_data, dataset = "adtte", draw = TRUE)
#> gTree[GRID.gTree.140]2. Kaplan-Meier Plot (with comparative statistics)
To enable the comparative statistics (hazard ratio and p-value), the
argument annot_coxph needs to be set to TRUE. The compare
group is determined by the levels in the factorized variable of
treatment group and the first level is used as reference group in the
statistics.
proc_data <- log_filter(syn_data, PARAMCD == "OS", "adtte")
run(kmg01, proc_data, dataset = "adtte", draw = TRUE, annot_coxph = TRUE)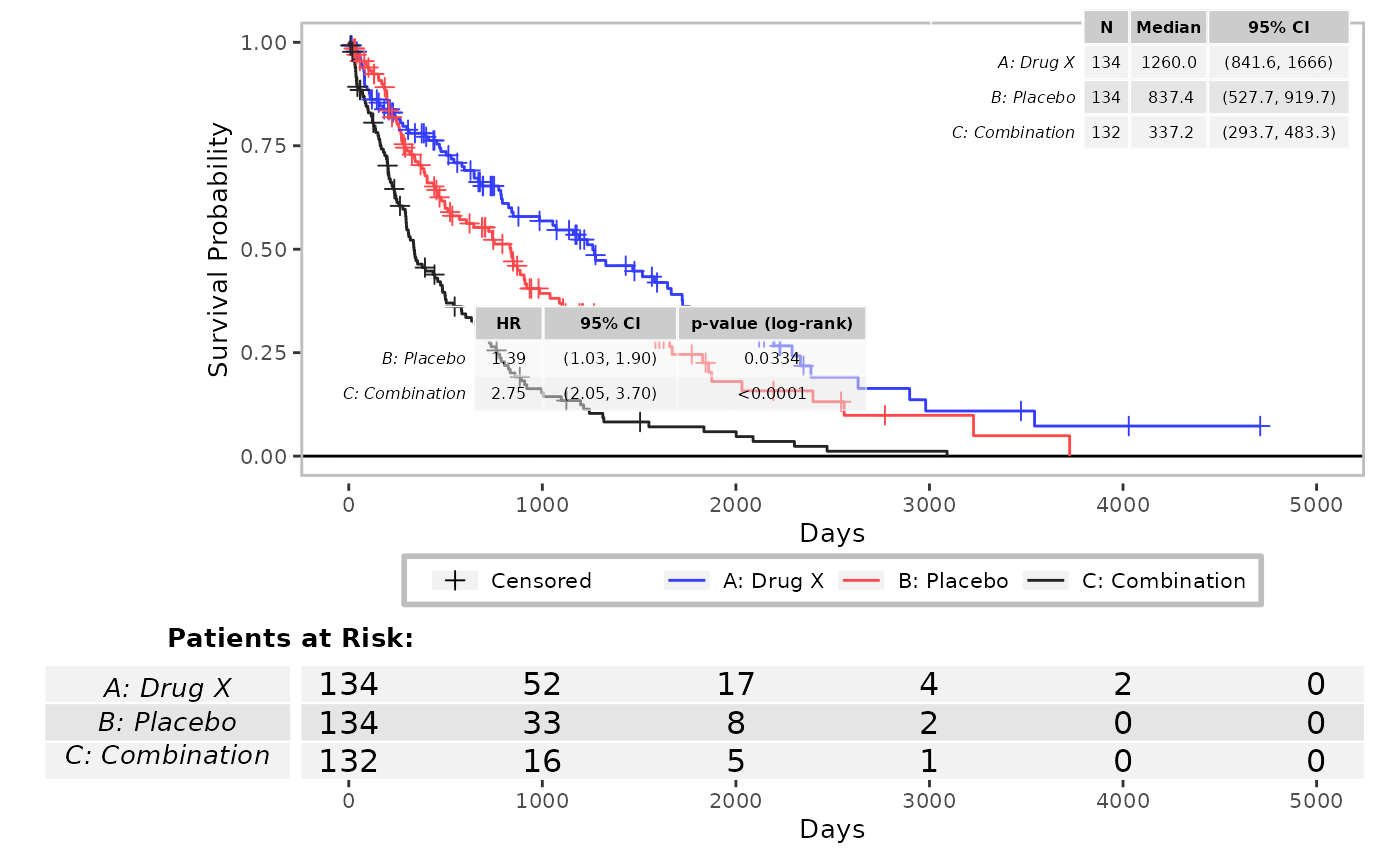
#> gTree[GRID.gTree.294]3. Kaplan-Meier Plot (without censoring marks)
To suppress the censoring marks, set the argument
cencor_show to FALSE.
proc_data <- log_filter(syn_data, PARAMCD == "OS", "adtte")
run(kmg01, proc_data, dataset = "adtte", draw = TRUE, censor_show = FALSE)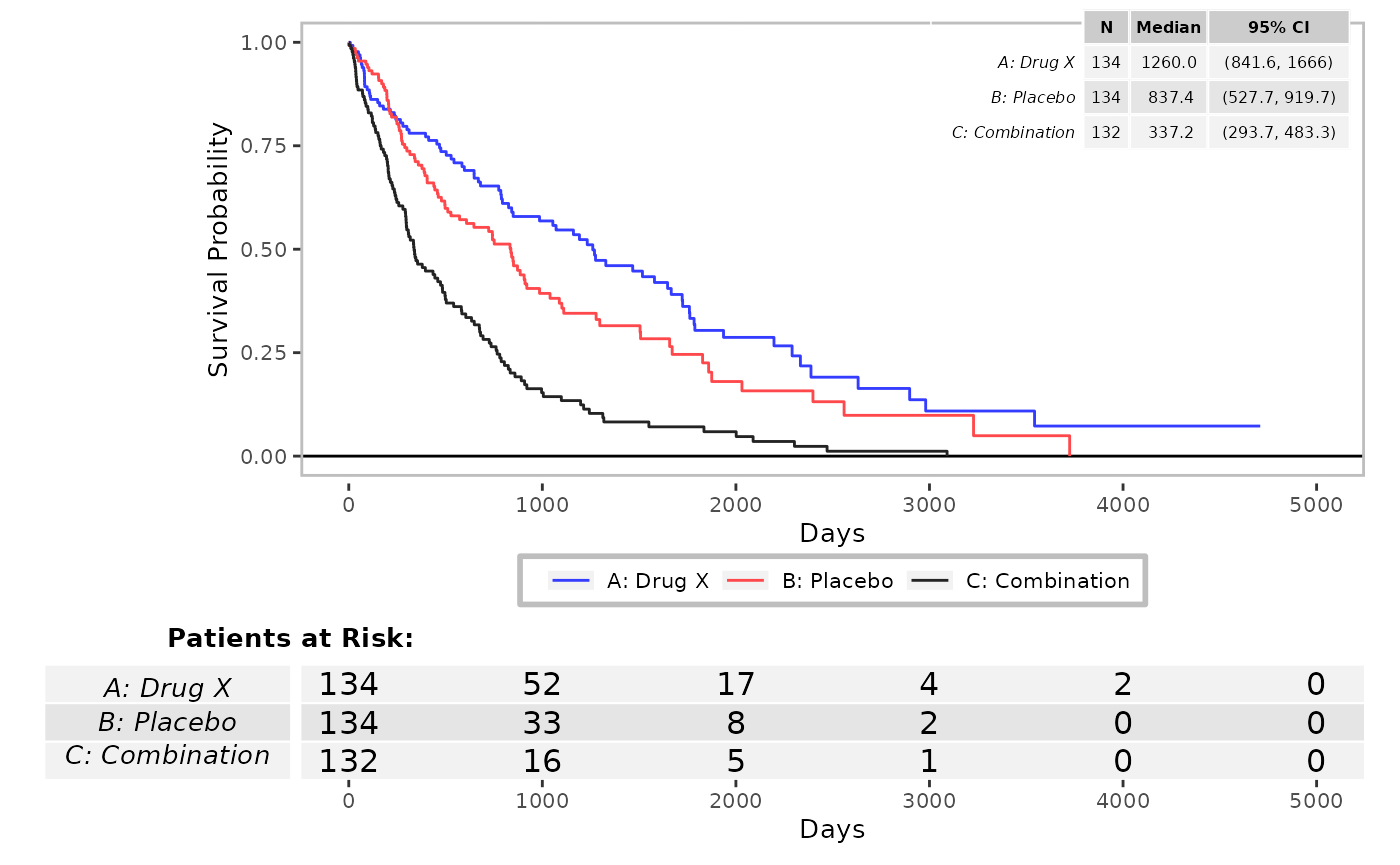
#> gTree[GRID.gTree.408]4. Kaplan-Meier Plot (without estimation of median survival time)
proc_data <- log_filter(syn_data, PARAMCD == "OS", "adtte")
run(kmg01, proc_data, dataset = "adtte", draw = TRUE, annot_surv_method = FALSE)
#> gTree[GRID.gTree.536]5. Kaplan-Meier Plot (with statistical annotation of either median or min of survival time)
To add the statistics annotation, use the function
annot_stats. Options are min or
median.
proc_data <- log_filter(syn_data, PARAMCD == "OS", "adtte")
run(kmg01, proc_data, dataset = "adtte", draw = TRUE, annot_stats = "median")
#> gTree[GRID.gTree.665]
run(kmg01, proc_data, dataset = "adtte", draw = TRUE, annot_stats = c("min", "median"))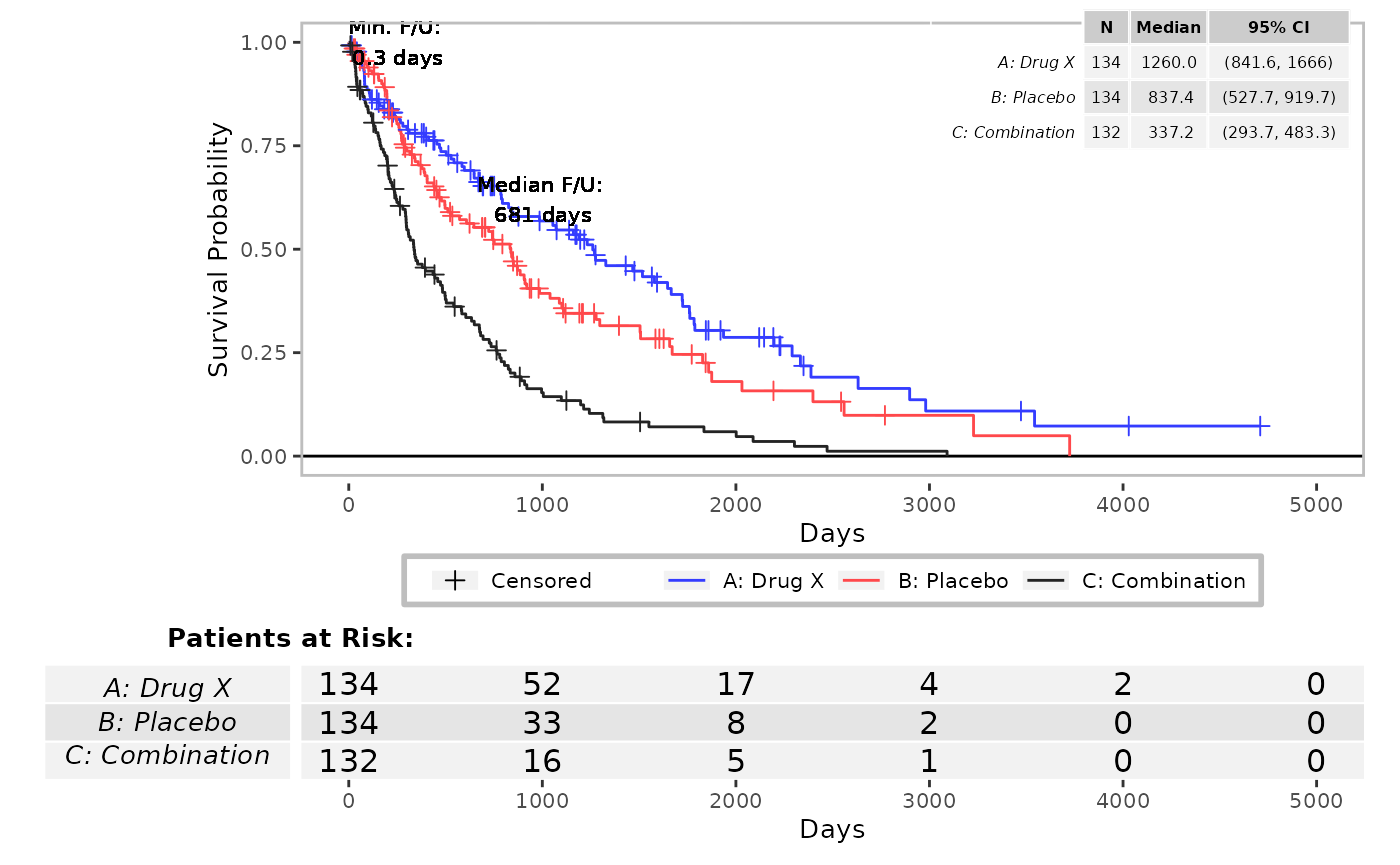
#> gTree[GRID.gTree.795]6. Kaplan-Meier Plot (without the table of patient at risk)
proc_data <- log_filter(syn_data, PARAMCD == "OS", "adtte")
run(kmg01, proc_data, dataset = "adtte", draw = TRUE, annot_at_risk = FALSE)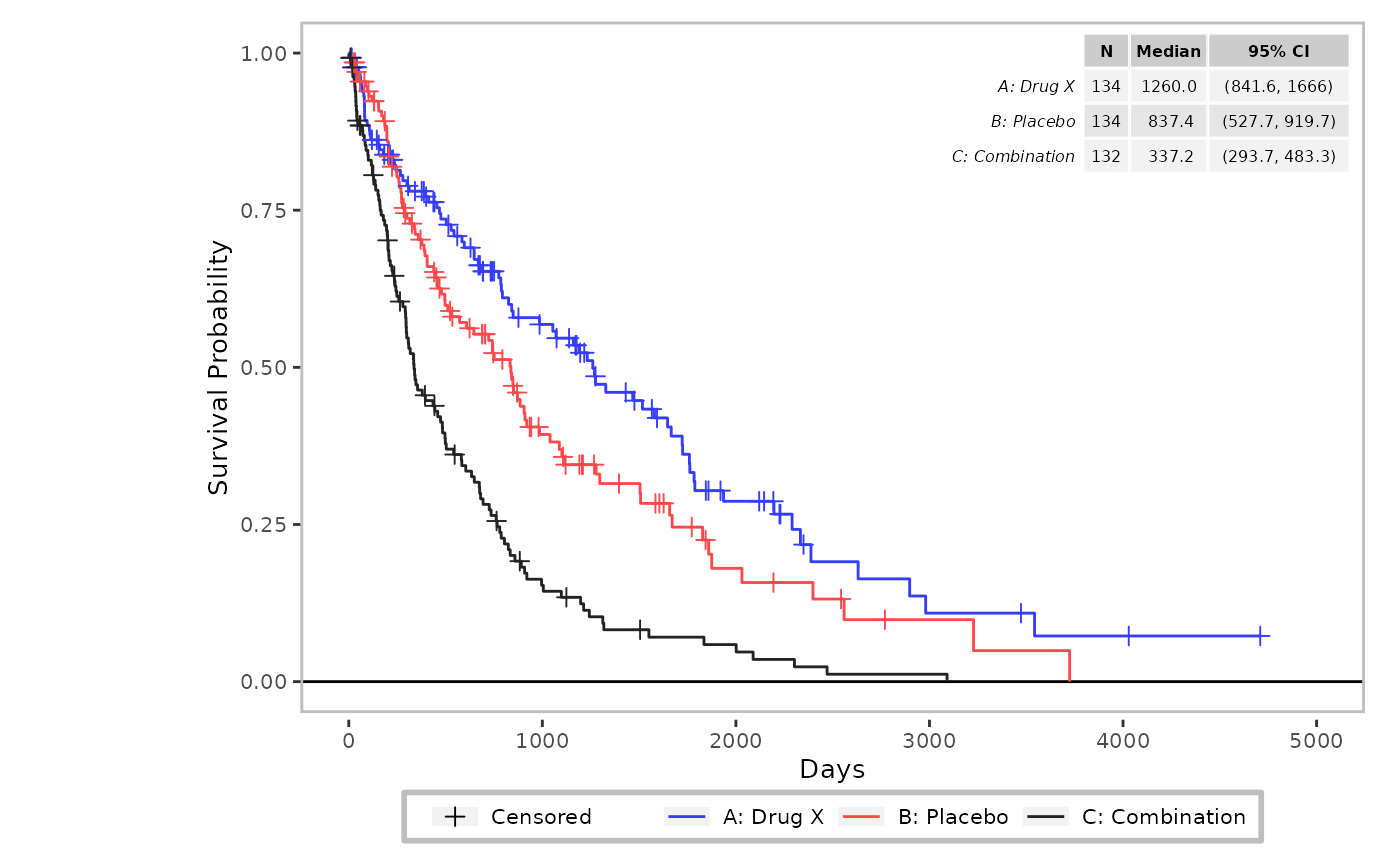
#> gTree[GRID.gTree.908]
Mean Plot (MNG01)
1. Plot of Mean and Confidence Interval (with Table Section)
- The
mng01template produces the standard mean plot. - Note that the template
mng01is quite general. The users are expected to specify the analysis dataset and the visit variable in therunfunction, and select the parameters prior to therunfunction. - The table of summary statistics is included by default.
- The variable Analysis Value
AVALis used for plotting by default. - If the input dataset contains results of the same analyses in
multiple units,(e.g. SI/CV units in
ADLB), please make sure that the parameters in appropriate units are selected in advance.
proc_data <- log_filter(syn_data, PARAMCD == "DIABP", "advs")
run(mng01, proc_data, dataset = "advs", x_var = c("AVISIT", "AVISITN"), draw = TRUE)
#> $`Diastolic Blood Pressure`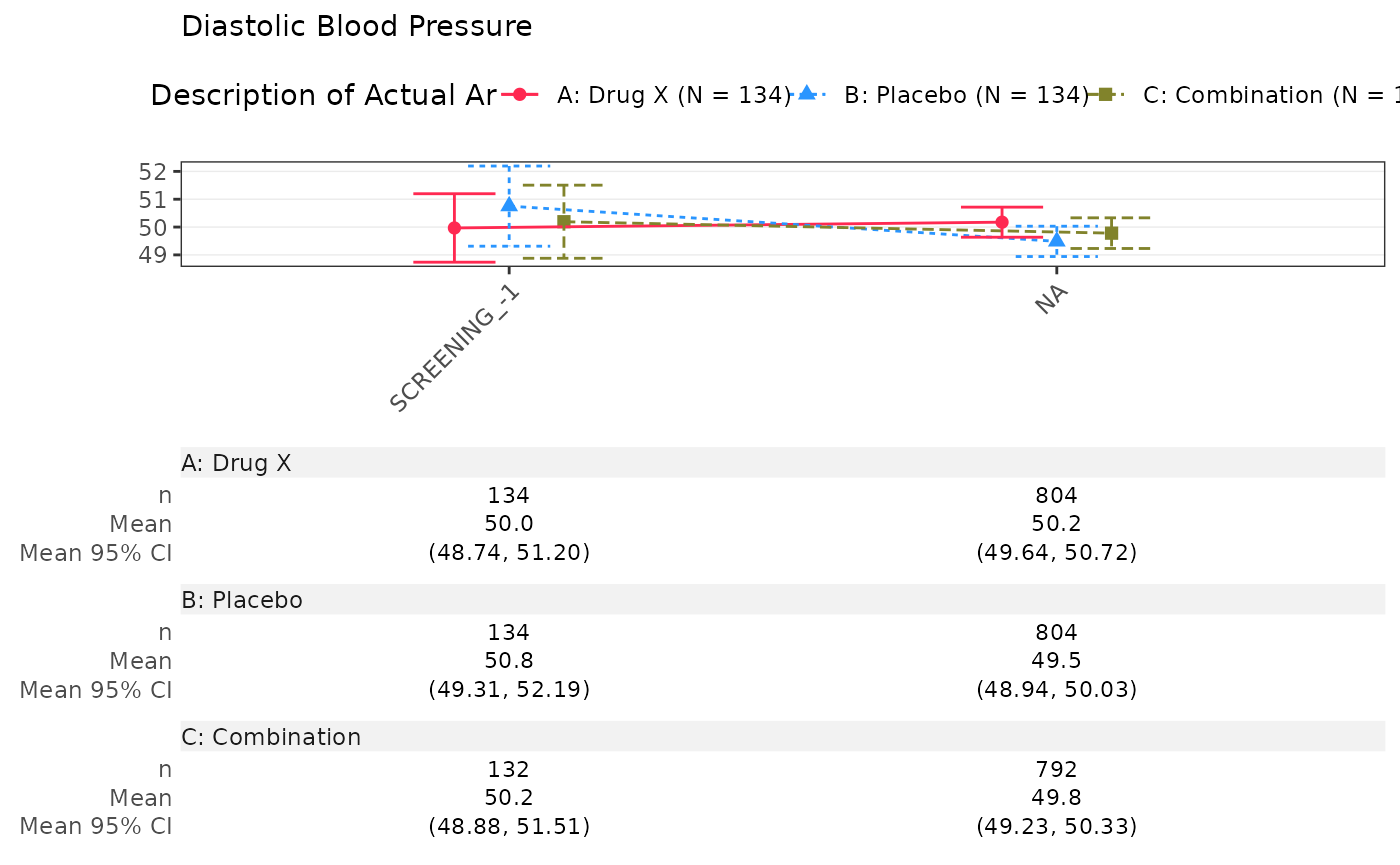
#>
#> attr(,"class")
#> [1] "gg_list" "list"
2. Plot of Mean and Confidence Interval of Change from Baseline of Vital Signs
proc_data <- log_filter(syn_data, PARAMCD == "DIABP", "advs")
run(mng01, proc_data, dataset = "advs", x_var = c("AVISIT", "AVISITN"), y_var = "CHG", draw = TRUE)
#> `geom_line()`: Each group consists of only one observation.
#> ℹ Do you need to adjust the group aesthetic?
#> $`Diastolic Blood Pressure`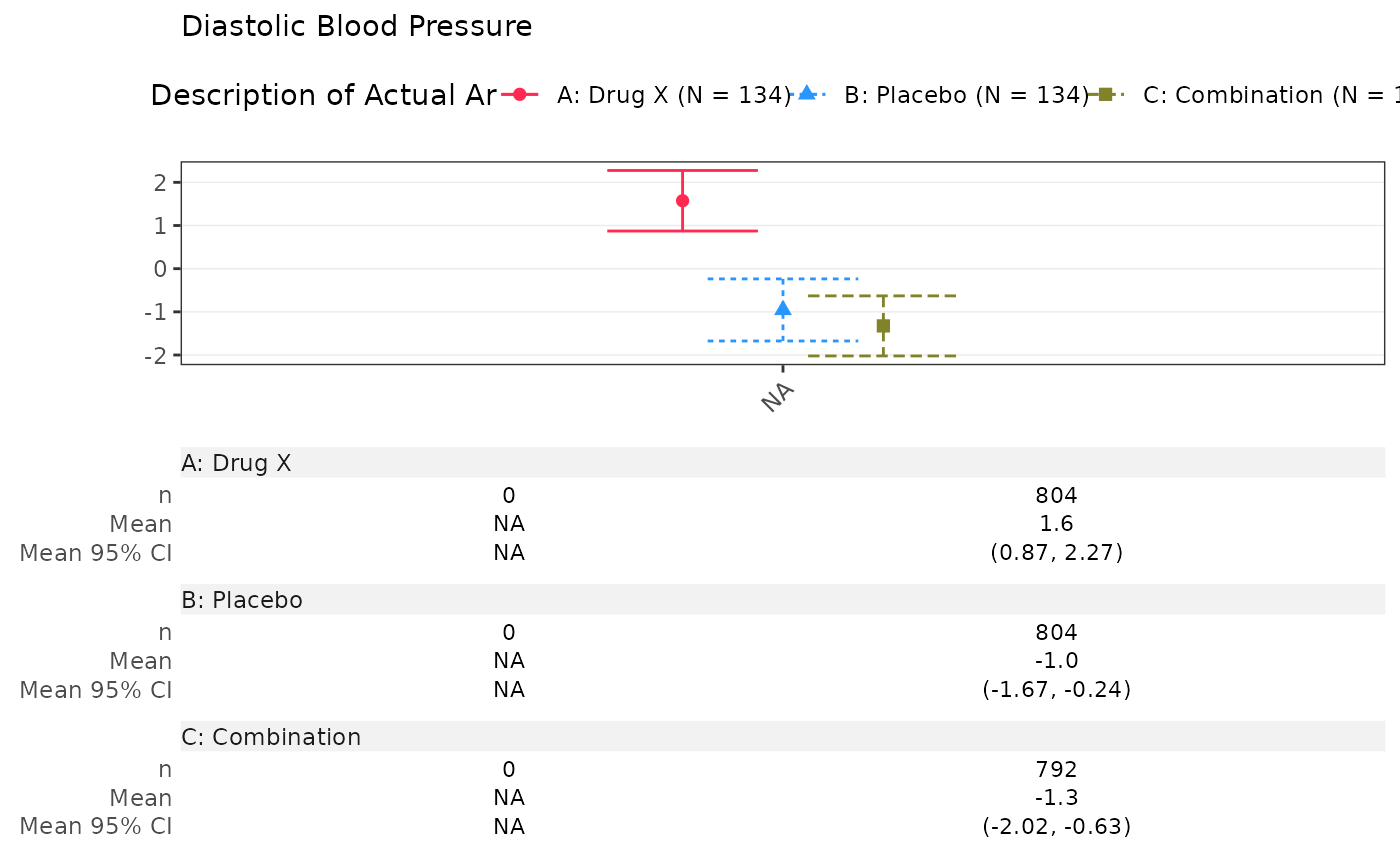
#>
#> attr(,"class")
#> [1] "gg_list" "list"
3. Plot of Mean (+/-SD) (Changing the Statistics)
To change the statistics, use the argument interval_fun.
Options are mean_ci, mean_sei,
mean_sdi, median_ci,
quantiles,range.
proc_data <- log_filter(syn_data, PARAMCD == "DIABP", "advs")
run(mng01, proc_data, dataset = "advs", x_var = c("AVISIT", "AVISITN"), interval_fun = "mean_sdi", draw = TRUE)
#> $`Diastolic Blood Pressure`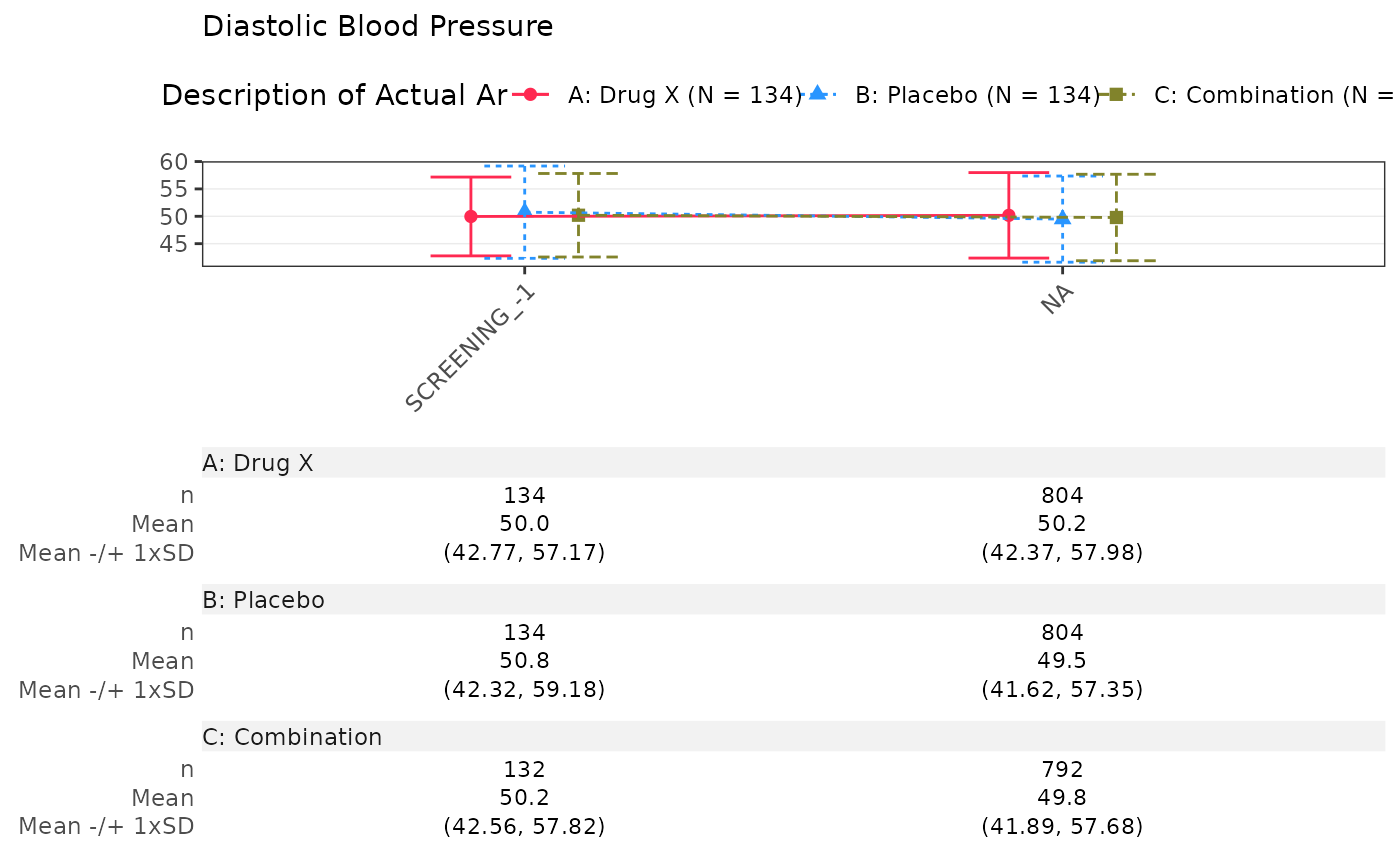
#>
#> attr(,"class")
#> [1] "gg_list" "list"
4. Plot of Mean and Confidence Interval (Modify Alpha Level)
To change the alpha level of the confidence interval, use the
argument
control = control_analyze_vars(conf_level = <0.xx>).
Note that this is only in effect when interval_fun is set
to mean_ci.
proc_data <- log_filter(syn_data, PARAMCD == "DIABP", "advs")
run(
  mng01, proc_data,
  dataset = "advs", x_var = c("AVISIT", "AVISITN"),
  interval_fun = "mean_ci", draw = TRUE, control = tern::control_analyze_vars(conf_level = 0.80)
)
#> $`Diastolic Blood Pressure`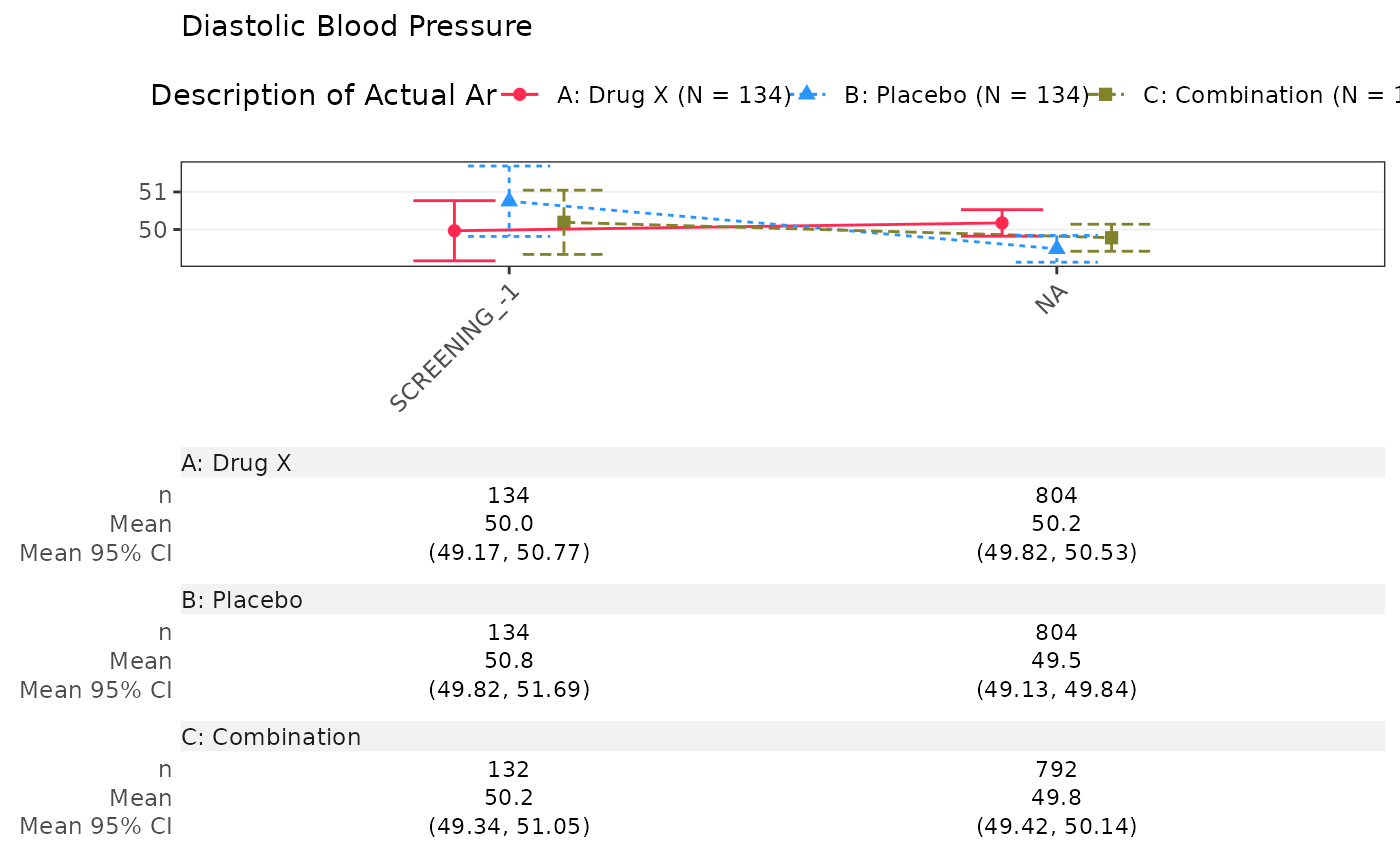
#>
#> attr(,"class")
#> [1] "gg_list" "list"
5. Plot of Mean and Confidence Interval (With Number of Patients Only)
proc_data <- log_filter(syn_data, PARAMCD == "DIABP", "advs")
run(mng01, proc_data, dataset = "advs", x_var = c("AVISIT", "AVISITN"), table = "n", draw = TRUE)
#> $`Diastolic Blood Pressure`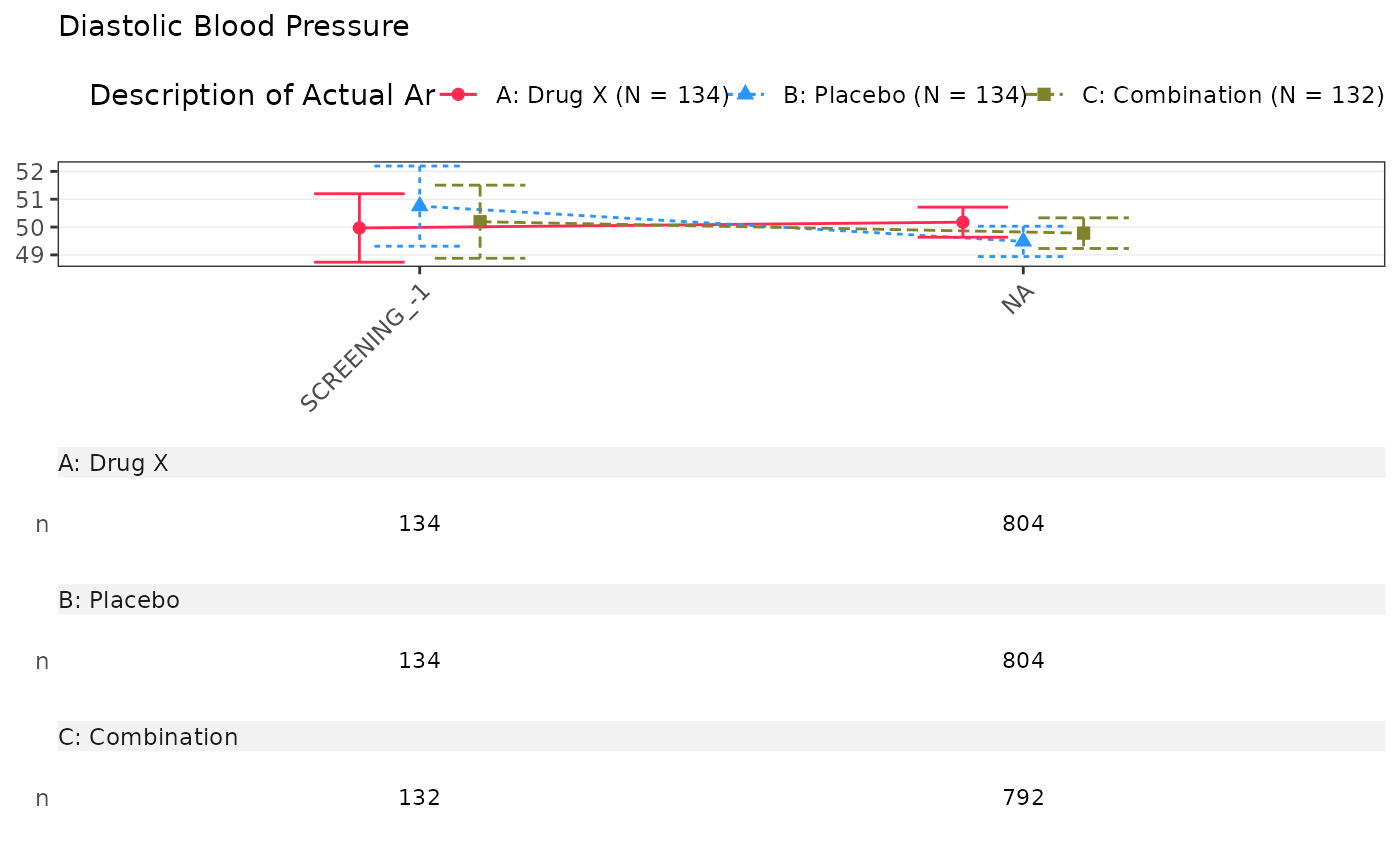
#>
#> attr(,"class")
#> [1] "gg_list" "list"
6. Plot of Mean and Confidence Interval (without Table Section)
proc_data <- log_filter(syn_data, PARAMCD == "DIABP", "advs")
run(mng01, proc_data, dataset = "advs", x_var = c("AVISIT", "AVISITN"), table = NULL, draw = TRUE)
#> $`Diastolic Blood Pressure`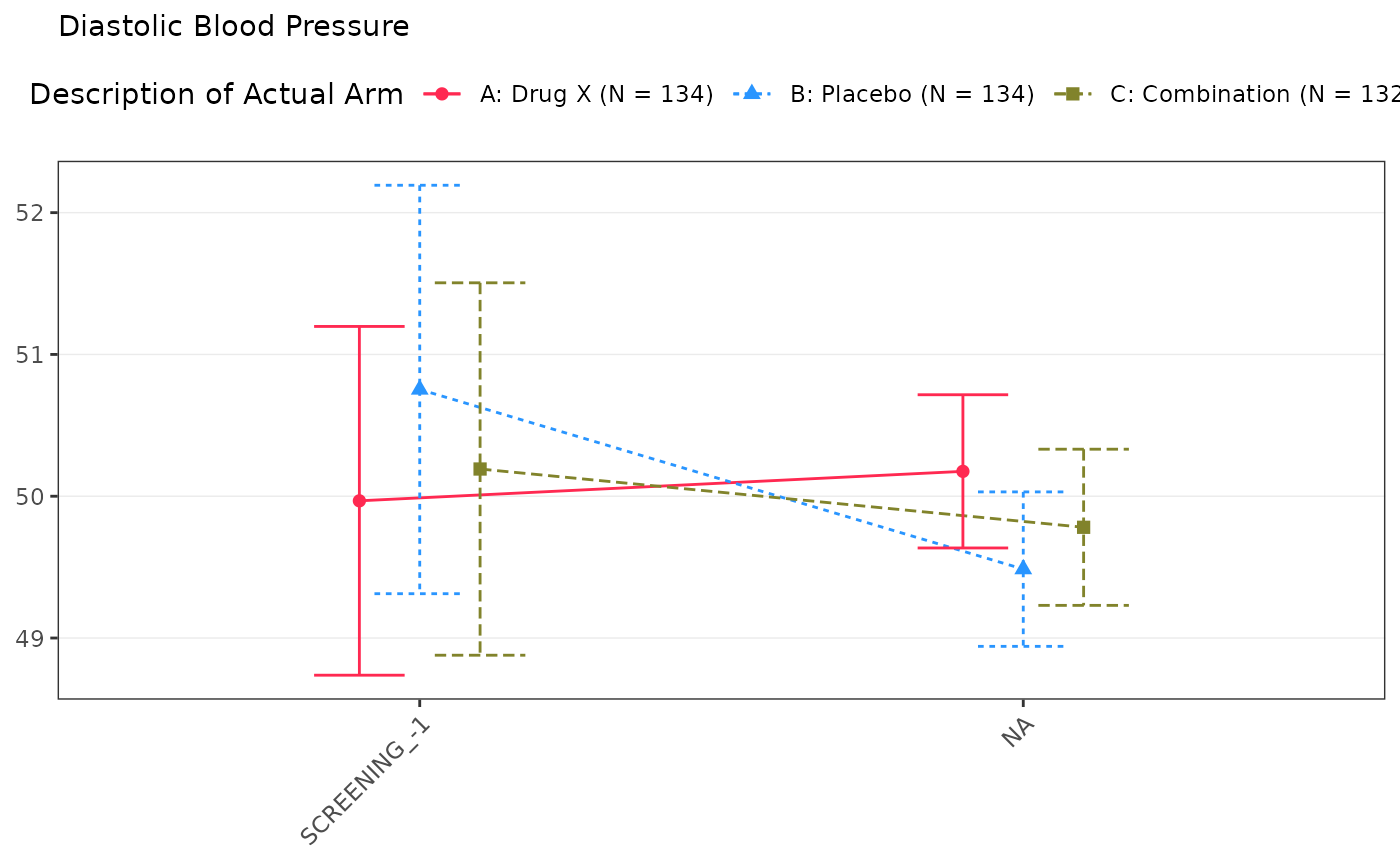
#>
#> attr(,"class")
#> [1] "gg_list" "list"
A new argument has been added to control the theme (e.g. setting the angle of the axis); see an example below:
ggtheme <- ggplot2::theme(
  panel.grid = ggplot2::element_line(colour = "black", linetype = 3),
  panel.background = ggplot2::element_rect(fill = "white"),
  legend.position = "top",
  axis.text.x = ggplot2::element_text(angle = 22, hjust = 1, vjust = 1)
)
run(mng01, syn_data, dataset = "adlb", ggtheme = ggtheme)
#> $`Alanine Aminotransferase Measurement`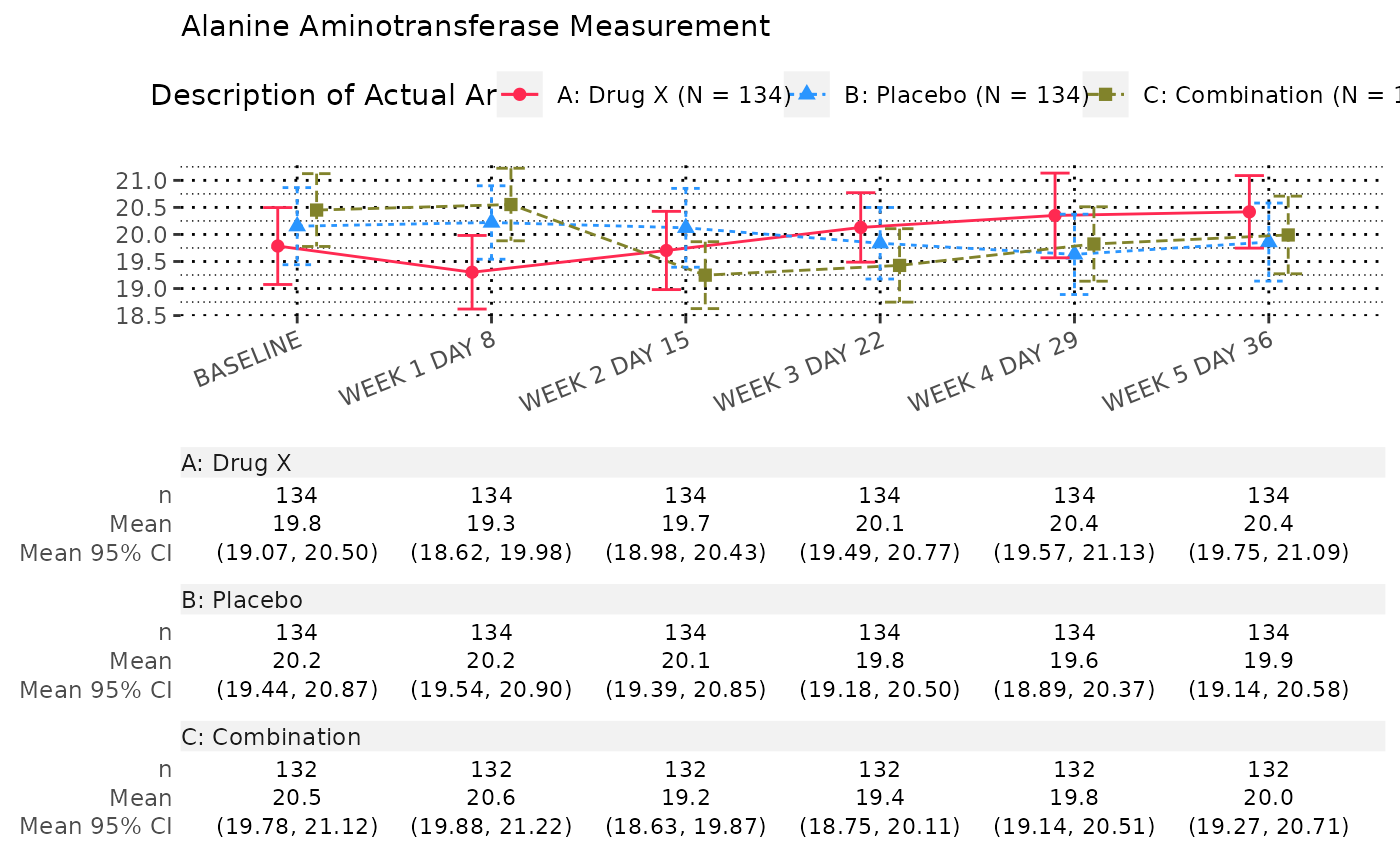
#>
#> $`C-Reactive Protein Measurement`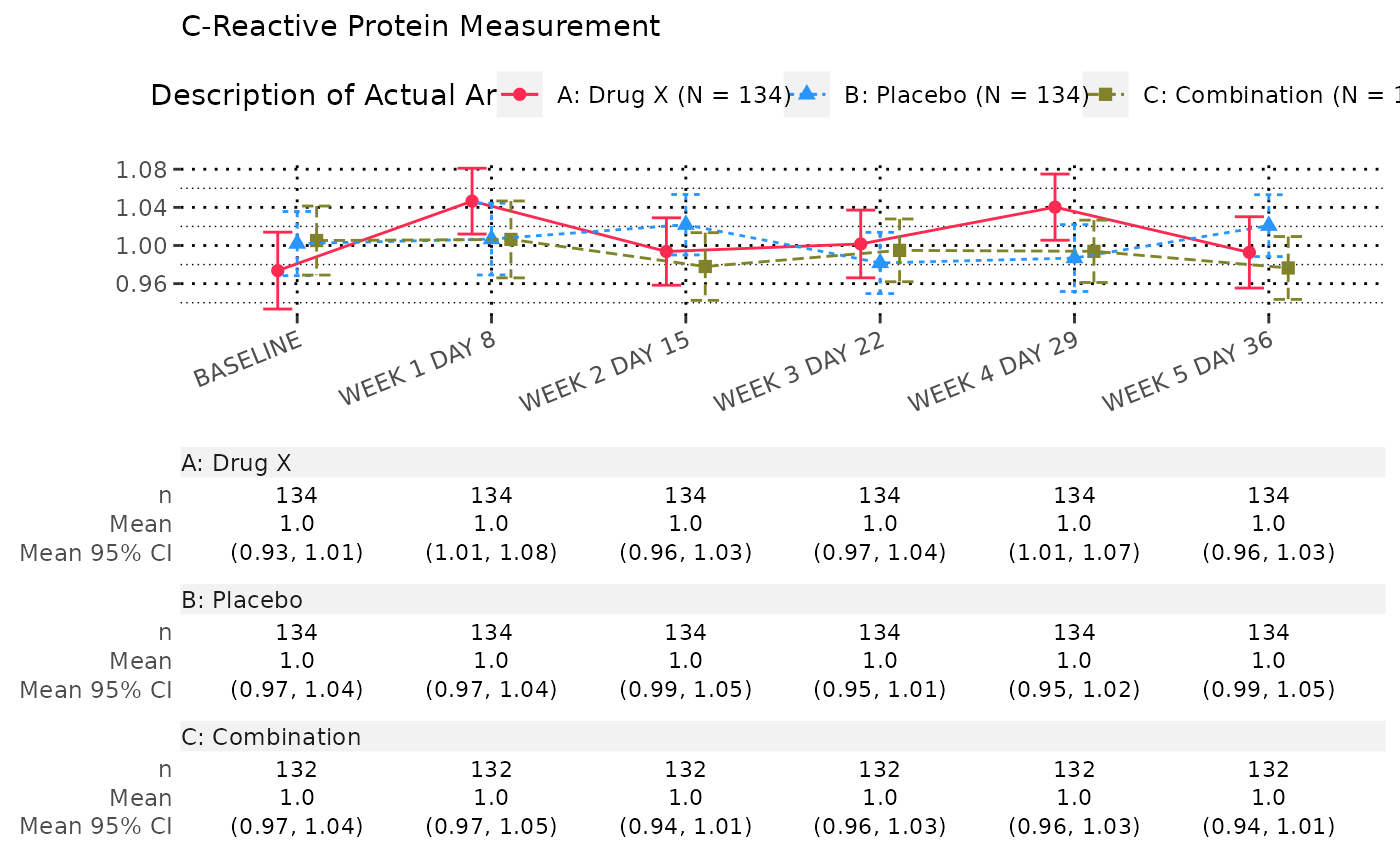
#>
#> $`Immunoglobulin A Measurement`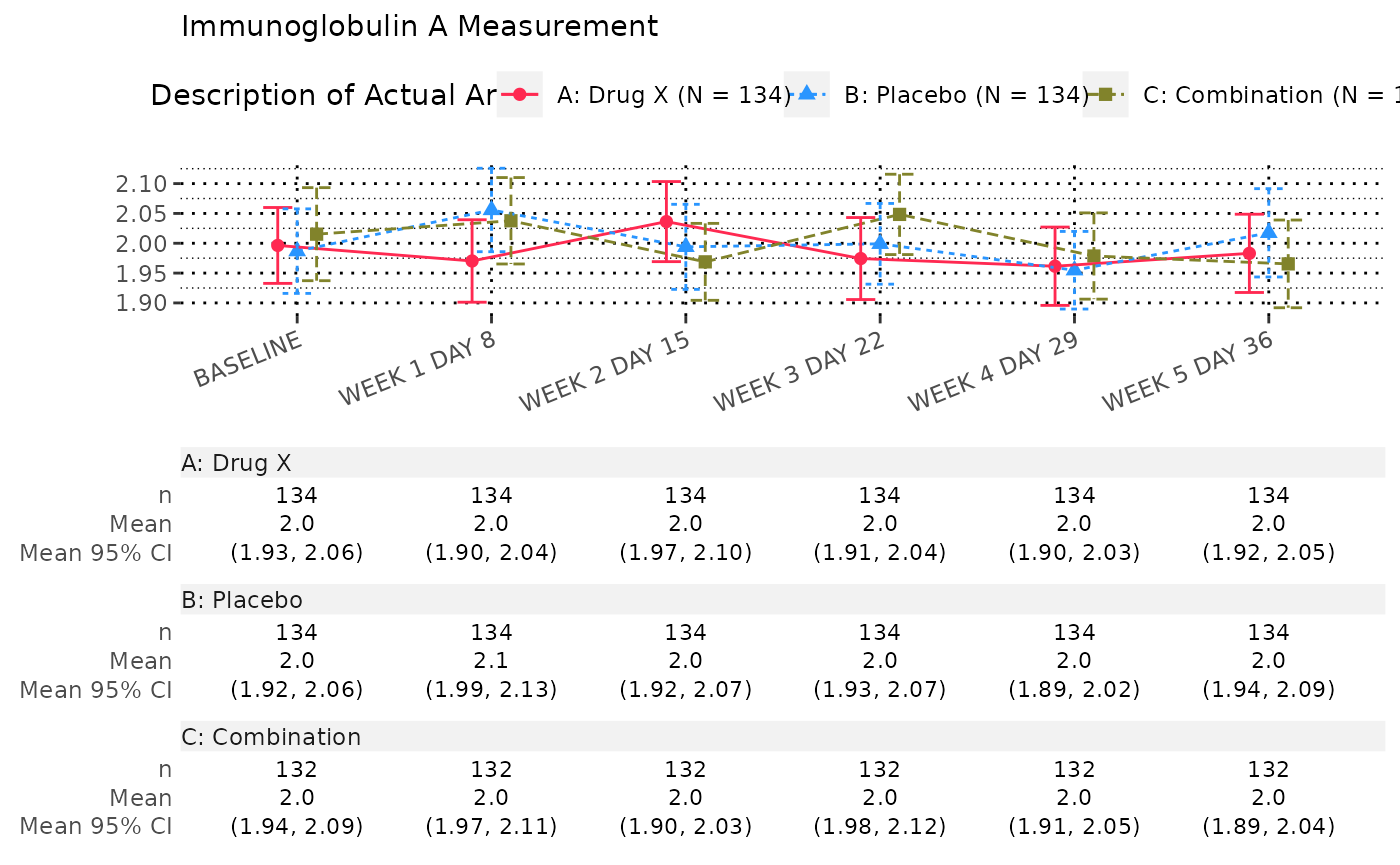
#>
#> attr(,"class")
#> [1] "gg_list" "list"