MNG01 Graph 1 (Default) Mean Plot 1.
mng01_1.RdOverview of a summary statistics across time and arm for a selected data set.
Usage
mng01_1_main(
  adam_db,
  dataset = "adlb",
  x_var = "AVISIT",
  y_var = "AVAL",
  y_name = "PARAM",
  y_unit = NA,
  arm_var = "ACTARM",
  center_fun = c("mean", "median"),
  interval_fun = c("mean_ci", "mean_sei", "mean_sdi", "median_ci", "quantiles", "range"),
  show_table = TRUE,
  jitter = TRUE,
  show_n = TRUE,
  show_h_grid = TRUE,
  show_v_grid = FALSE,
  legend_pos = "top",
  line_col = as.list(nestcolor::color_palette()),
  ...
)

mng01_1_pre(adam_db, dataset, x_var = "AVISIT", ...)

mng01_1_post(tlg, ...)

mng01_1Arguments
- adam_db
(
dm) object containing theADaMdatasets- dataset
(
string) the name of a table in theadam_dbobject.- x_var
(
character) the name of a column in thedatasetto represent on the x-axis.- y_var
(
string) the name of the variable to be represented on the y-axis.- y_name
(
string) the variable name fory. Used for plot's subtitle.- y_unit
(
string) the name of the variable with the units ofy. Used for plot's subtitle. ifNA, onlyy_nameis displayed as subtitle.- arm_var
(
character) variable used for column splitting- center_fun
(
string) the function to compute the estimate value.- interval_fun
(
string) the function defining the crossbar range.- show_table
(
flag) should the summary statistic table be displayed.- jitter
(
flag) should data point be slightly spread on the x-axis.- show_n
(
flag) should the number of observation be displayed int the table.- show_h_grid
(
flag) should horizontal grid be displayed.- show_v_grid
(
flag) should vertical grid be displayed.- legend_pos
(
string) the position of the legend.- line_col
(
list) describing the colors to use for the lines or a namedlistassociating values ofarm_varwith color names.- ...
not used.
- tlg
(
TableTree,Listingorggplot) object typically produced by amainfunction.
Functions
mng01_1_main(): Main TLG Functionmng01_1_pre(): Preprocessingmng01_1_post(): Postprocessing
Note
adam_dbobject must contain the table specified bydatasetwith the columns specified byx_var,y_var,y_name,y_unitandarm_var.
Examples
library(dm)
library(dplyr)
#>
#> Attaching package: ‘dplyr’
#> The following objects are masked from ‘package:stats’:
#>
#> filter, lag
#> The following objects are masked from ‘package:base’:
#>
#> intersect, setdiff, setequal, union
col <- c(
"A: Drug X" = "black",
"B: Placebo" = "blue",
"C: Combination" = "gray"
)
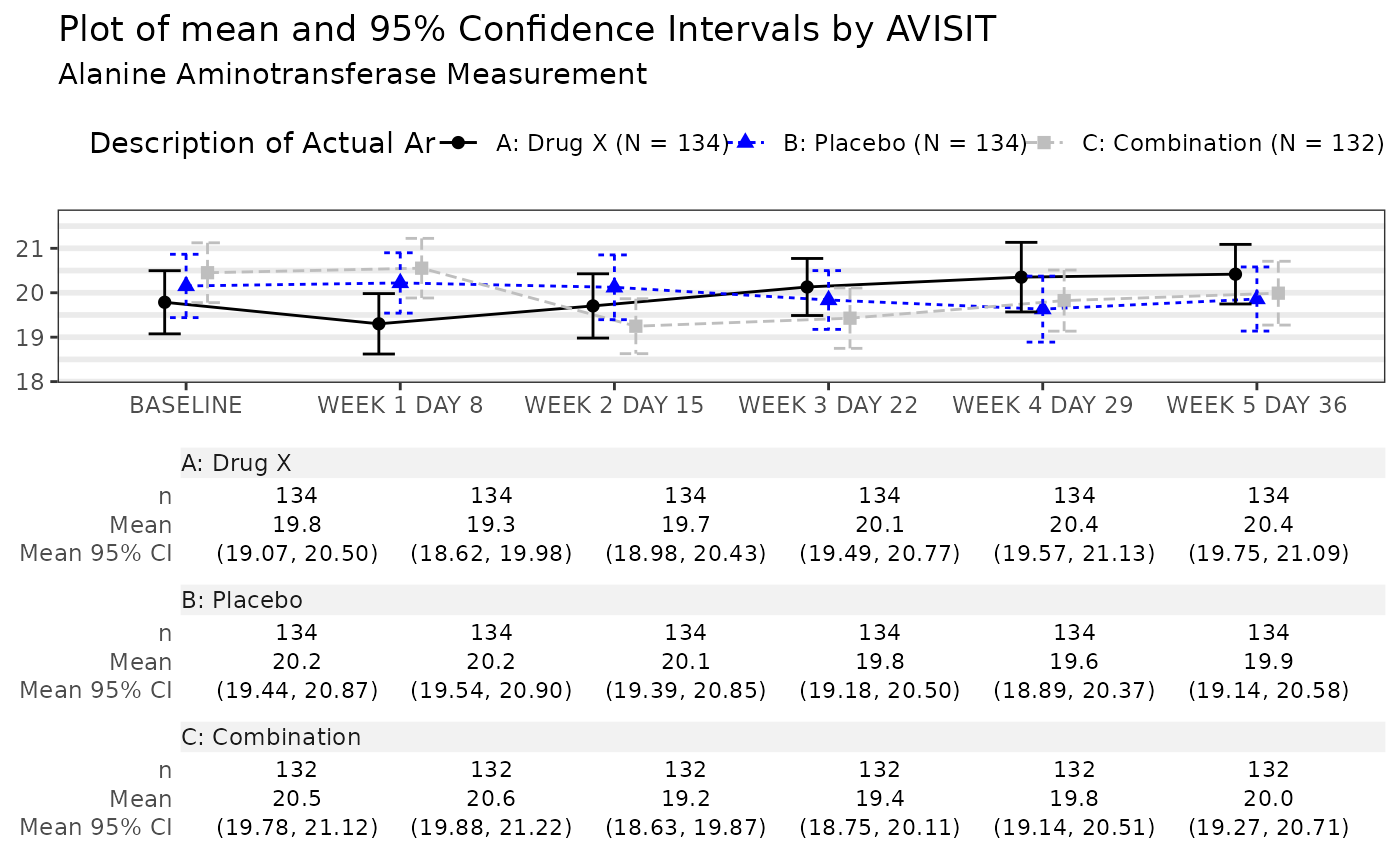
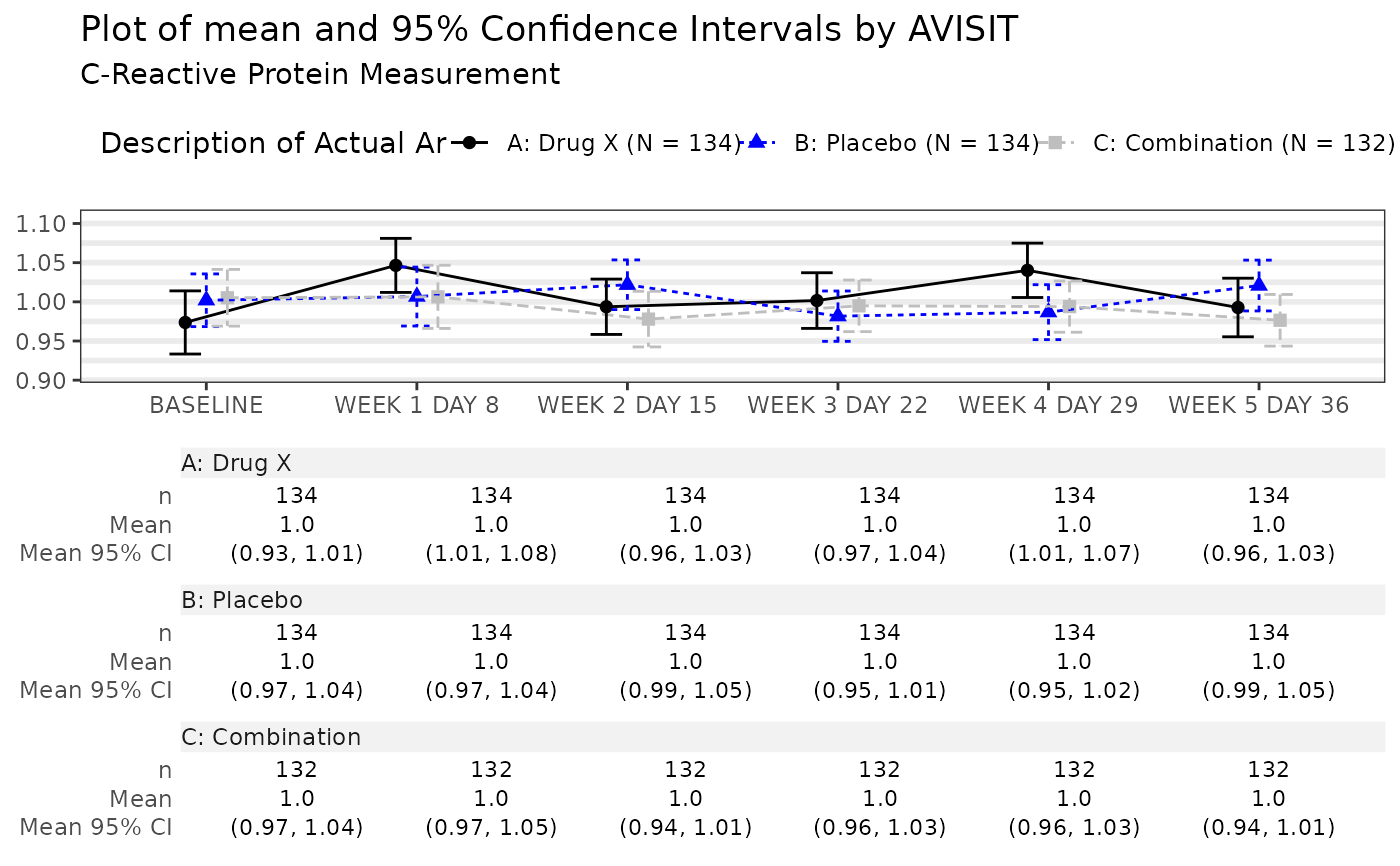
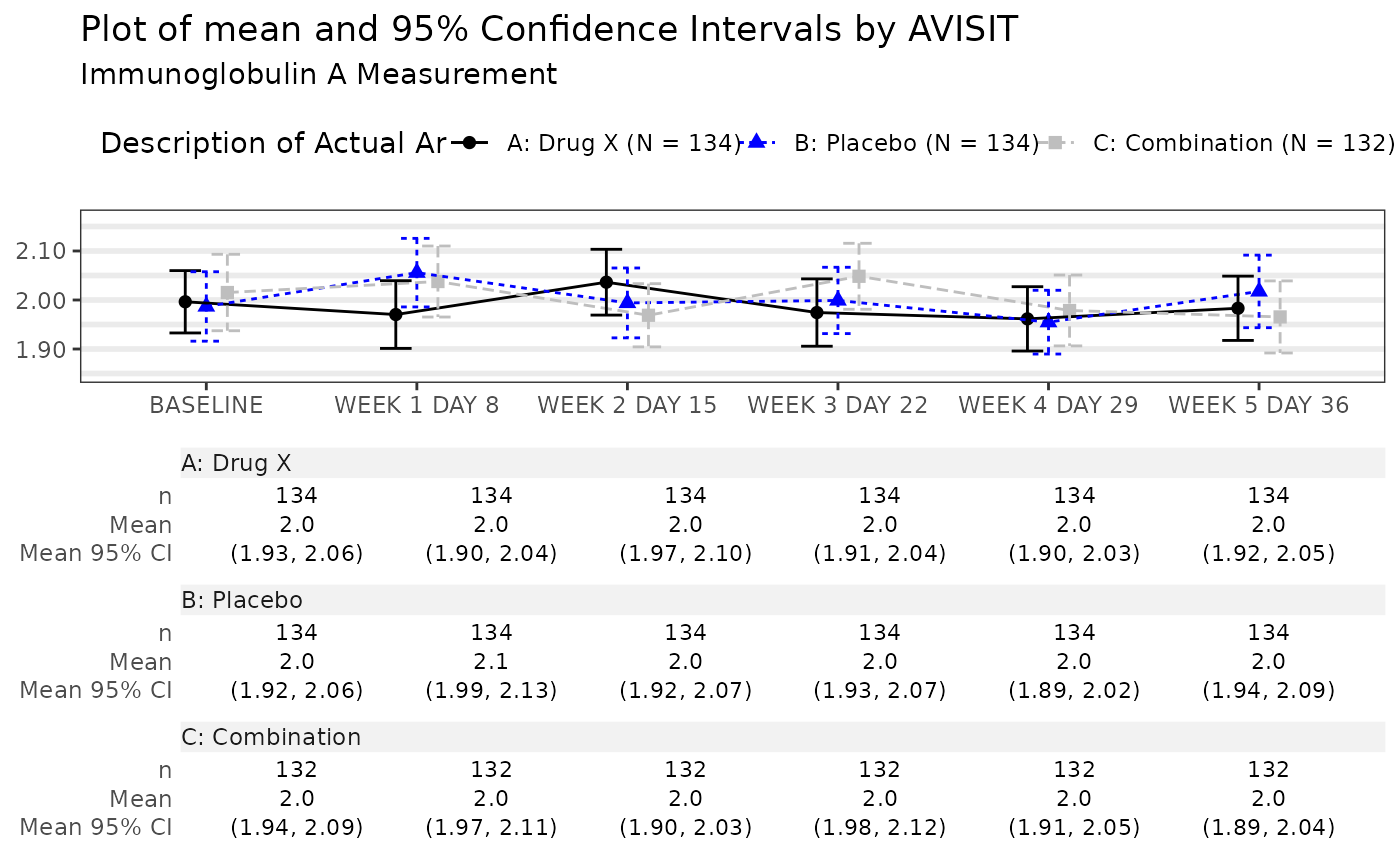
run(mng01_1, syn_data, dataset = "adlb", line_col = col)
#> $`Alanine Aminotransferase Measurement`
 #>
#> $`C-Reactive Protein Measurement`
#>
#> $`C-Reactive Protein Measurement`
 #>
#> $`Immunoglobulin A Measurement`
#>
#> $`Immunoglobulin A Measurement`
 #>
#> attr(,"class")
#> [1] "gg_list" "list"
#>
#> attr(,"class")
#> [1] "gg_list" "list"