![[Experimental]](figures/lifecycle-experimental.svg)
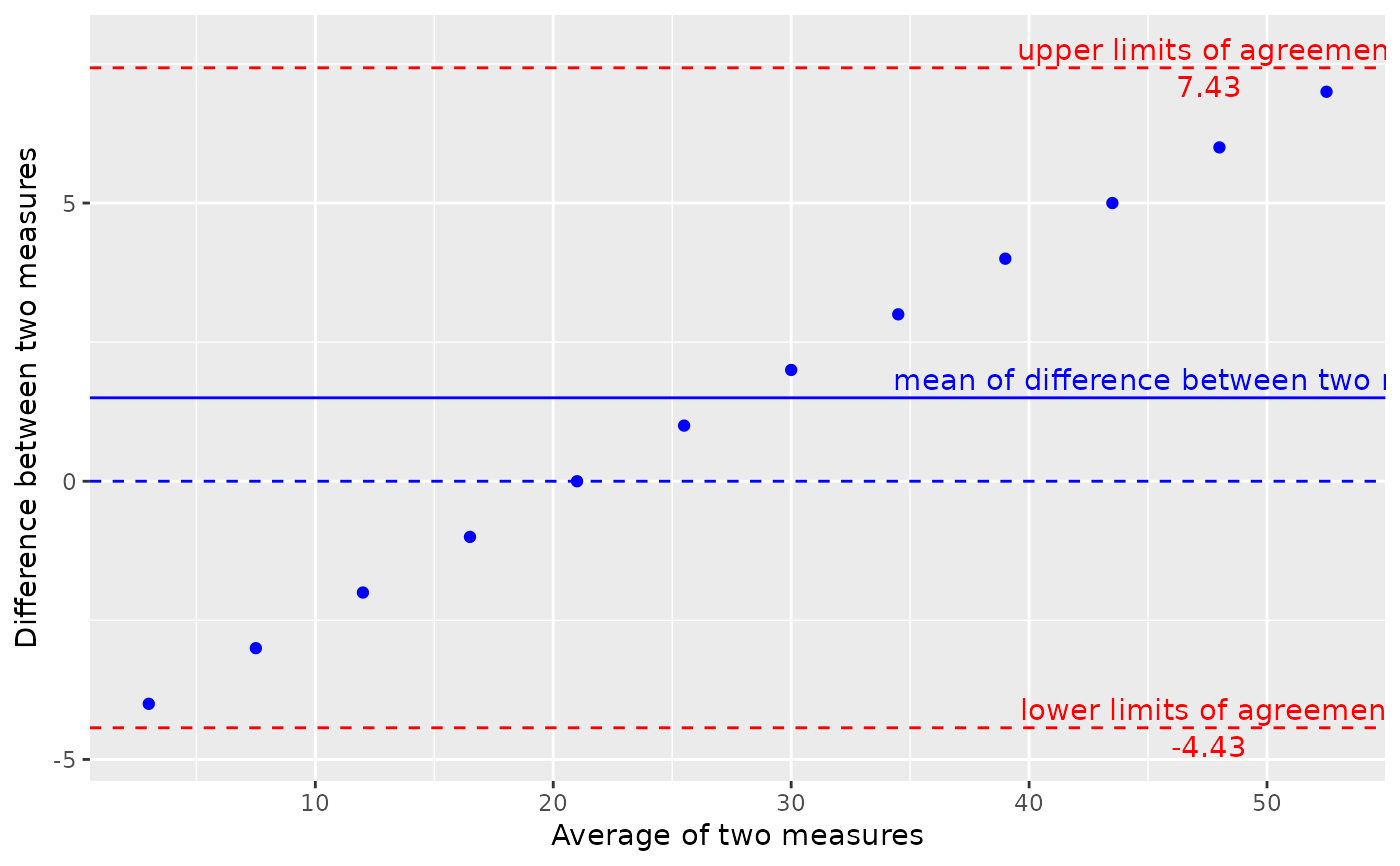
Graphing function that produces a Bland-Altman plot.
Usage
g_bland_altman(x, y, conf_level = 0.95)
Arguments
- x
(numeric)
vector of numbers we want to analyze.
- y
(numeric)
vector of numbers we want to analyze, to be compared with x.
- conf_level
(proportion)
confidence level of the interval.
Value
A ggplot Bland-Altman plot.
Examples
x <- seq(1, 60, 5)
y <- seq(5, 50, 4)

g_bland_altman(x = x, y = y, conf_level = 0.9)