Introduction
The teal.slice package provides a filter panel
for shiny applications. teal.slice creates a
filter panel module that allows for interactive filtering of data stored
in data.frame and MultiAssayExperiment
objects. It also displays filtered and unfiltered observation
counts.
Information for users of the filter panel in applications
The filter panel contains three panels:
- The top panel displays the number of records (observations) that
remain after the filters have been applied. For relational data (where
join_keysis specified), the number of unique subjects remaining in the filtered data set is also shown. - The middle panel displays the current active filters and allows the user to change their state.
- The bottom panel allows to add new filters on columns of the data sets in the app.
Note that multiple filters for the same data set are combined with
the AND operator and it is not possible to apply
hierarchical filters.
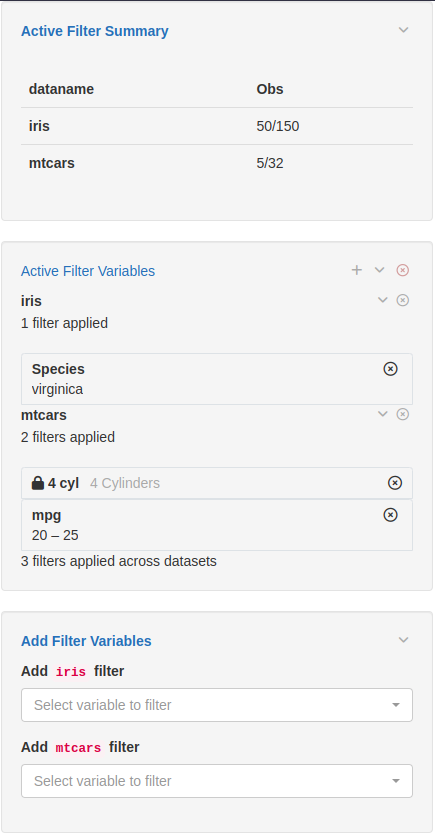
An example of the filter panel in use is shown in the image below.
The iris data set has the 50 versicolor
records removed, leaving 100 observations. The mtcars data
set has filtered out all records other than those with
(gear = 3 or gear = 5) and (disp in [205, 295]).
Depending on the data type of the selected variable, different filters are shown, for example date pickers, range sliders, checkbox inputs.
For relational data (when join_keys are specified),
filters specified on a parent data set (i.e. ADSL) will
apply to all child data sets, whereas filters for a child data set can
only be specified on columns not found in that data set’s parent. For
general relational data the filter panel treats each data set
independently, irrespective of relationships between data sets.
The filter panel also supports filtering
MultiAssayExperiment objects, where filters can be applied
to the subject data, which is stored in the colData slot
and accessed with colData(MAE), as well as to experiments,
which are stored in the ExperimentList slot and accessed
with MAE[["experiment name"]].
Information for R developers using the filter panel
The example app below shows how to embed the filter panel inside a
shiny application.
The filter panel is entirely contained within a
FilteredData object. FilteredData is an
R6 class that stores data sets, tracks filter states,
constructs and applies filter calls, and can output filtered data. It
also contains shiny modules (both UI and server functions)
that make up the panel itself.
In a teal application the FilteredData
object (datasets) is created automatically by
teal’s init function and filter panel
components are automatically placed on the right-hand side of the
page.
To facilitate communication with FilteredData, we
provide the filter panel API. The example below uses the
set_filter_state function to set state and the state is
specified with teal_slices and teal_slice
functions. For details please see the Filter panel for
developers vignette.
library(shiny)
library(teal.slice)

# create a FilteredData object
datasets <- init_filtered_data(list(iris = iris, mtcars = mtcars))

# setting initial state
set_filter_state(
  datasets = datasets,
  filter = teal_slices(
    teal_slice(dataname = "iris", varname = "Species", selected = "virginica", keep_na = FALSE),
    teal_slice(dataname = "mtcars", id = "4 cyl", title = "4 Cylinders", expr = "cyl == 4"),
    teal_slice(dataname = "mtcars", varname = "mpg", selected = c(20.0, 25.0), keep_na = FALSE, keep_inf = FALSE),
    include_varnames = list(iris = c("Species", "Sepal.Length")),
    exclude_varnames = list(mtcars = "cyl"),
    count_type = "all",
    allow_add = TRUE
  )
)

ui <- fluidPage(
  fluidRow(
    column(
      width = 9,
      tabsetPanel(
        tabPanel(title = "iris", dataTableOutput("iris_table")),
        tabPanel(title = "mtcars", dataTableOutput("mtcars_table"))
      )
    ),
    # ui for the filter panel
    column(width = 3, datasets$ui_filter_panel("filter_panel"))
  )
)

server <- function(input, output, session) {
  # this is the shiny server function for the filter panel and the datasets
  # object can now be used inside the application
  datasets$srv_filter_panel("filter_panel")

  # get the filtered datasets and put them inside reactives for analysis
  iris_filtered_data <- reactive(datasets$get_data(dataname = "iris", filtered = TRUE))
  mtcars_filtered_data <- reactive(datasets$get_data(dataname = "mtcars", filtered = TRUE))

  output$iris_table <- renderDataTable(iris_filtered_data())
  output$mtcars_table <- renderDataTable(mtcars_filtered_data())
}

if (interactive()) {
  shinyApp(ui, server)
}