![[Deprecated]](figures/lifecycle-deprecated.svg)
g_scatterplot() is deprecated. Please use
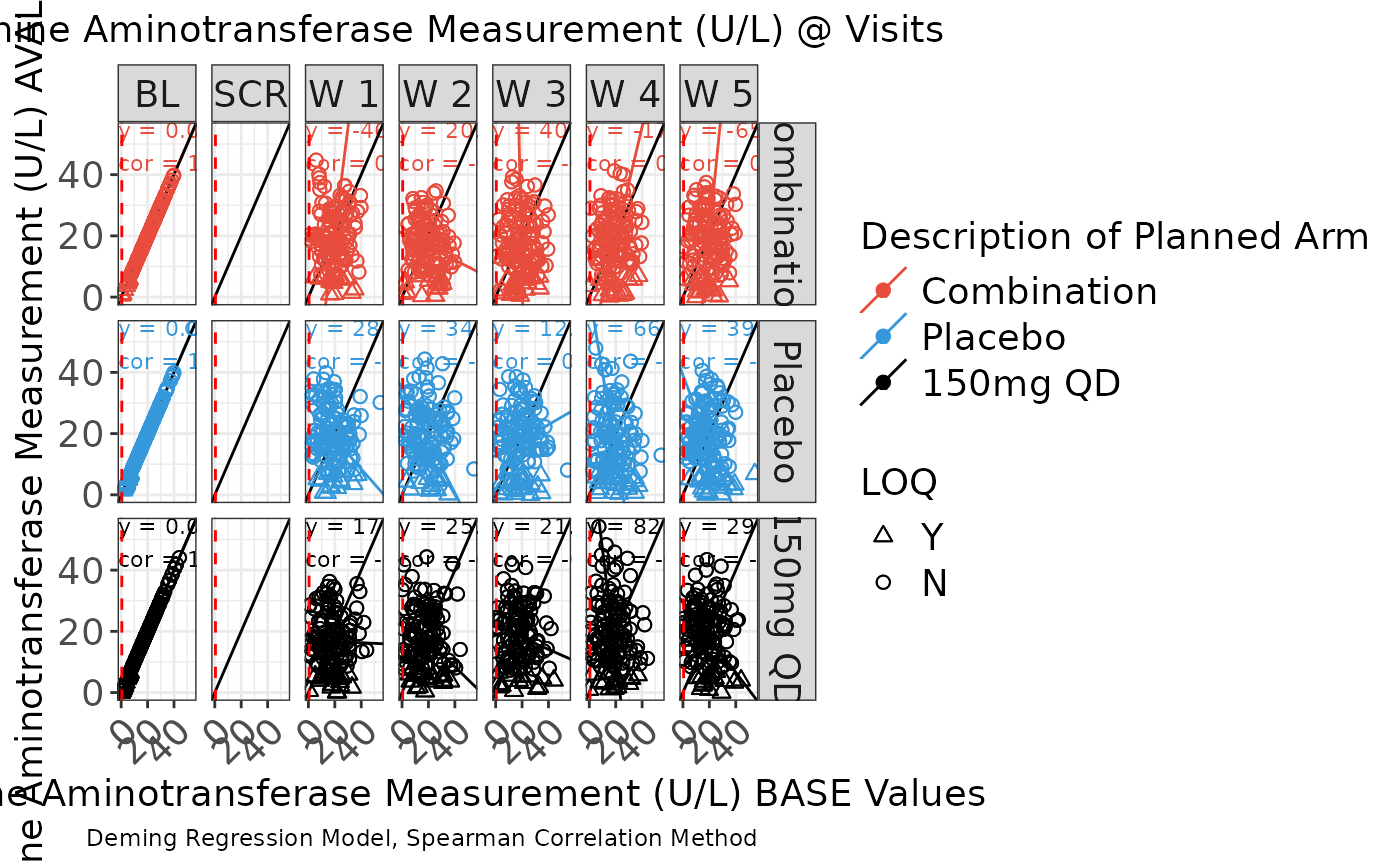
g_correlationplot() instead. Default plot displays scatter facetted by
visit with color attributed treatment arms and symbol attributed LOQ values.
Usage
g_scatterplot(
  label = "Scatter Plot",
  data,
  param_var = "PARAMCD",
  param = "CRP",
  xaxis_var = "BASE",
  yaxis_var = "AVAL",
  trt_group = "ARM",
  visit = "AVISITCD",
  loq_flag_var = "LOQFL",
  unit = "AVALU",
  xlim = c(NA, NA),
  ylim = c(NA, NA),
  color_manual = NULL,
  shape_manual = NULL,
  facet_ncol = 2,
  facet = FALSE,
  facet_var = "ARM",
  reg_line = FALSE,
  hline = NULL,
  vline = NULL,
  rotate_xlab = FALSE,
  font_size = 12,
  dot_size = NULL,
  reg_text_size = 3
)
Arguments
- label
text string to used to identify plot.
- data
ADaMstructured analysis laboratory data frame e.g.ADLB.- param_var
name of variable containing biomarker codes e.g.
PARAMCD.- param
biomarker to visualize e.g.
IGG.- xaxis_var
name of variable containing biomarker results displayed on X-axis e.g.
BASE.- yaxis_var
name of variable containing biomarker results displayed on Y-axis e.g.
AVAL.- trt_group
name of variable representing treatment group e.g.
ARM.- visit
name of variable containing nominal visits e.g.
AVISITCD.- loq_flag_var
name of variable containing
LOQflag e.g.LOQFL.- unit
name of variable containing biomarker unit e.g.
AVALU.- xlim
('numeric vector') optional, a vector of length 2 to specify the minimum and maximum of the x-axis if the default limits are not suitable.
- ylim
('numeric vector') optional, a vector of length 2 to specify the minimum and maximum of the y-axis if the default limits are not suitable.
- color_manual
vector of colors applied to treatment values.
- shape_manual
vector of symbols applied to
LOQvalues.- facet_ncol
number of facets per row.
- facet
set layout to use treatment facetting.
- facet_var
variable to use for treatment facetting.
- reg_line
include regression line and annotations for slope and coefficient in visualization. Use with facet = TRUE.
- hline
y-axis value to position a horizontal line.
- vline
x-axis value to position a vertical line.
- rotate_xlab
45 degree rotation of x-axis label values.
- font_size
font size control for title, x-axis label, y-axis label and legend.
- dot_size
plot dot size.
- reg_text_size
font size control for regression line annotations.
Examples
# Example using ADaM structure analysis dataset.

library(stringr)

# original ARM value = dose value
arm_mapping <- list(
  "A: Drug X" = "150mg QD", "B: Placebo" = "Placebo", "C: Combination" = "Combination"
)
color_manual <- c("150mg QD" = "#000000", "Placebo" = "#3498DB", "Combination" = "#E74C3C")
# assign LOQ flag symbols: circles for "N" and triangles for "Y", squares for "NA"
shape_manual <- c("N" = 1, "Y" = 2, "NA" = 0)

ADLB <- rADLB
var_labels <- lapply(ADLB, function(x) attributes(x)$label)
ADLB <- ADLB %>%
  mutate(AVISITCD = case_when(
    AVISIT == "SCREENING" ~ "SCR",
    AVISIT == "BASELINE" ~ "BL",
    grepl("WEEK", AVISIT) ~
      paste(
        "W",
        trimws(
          substr(
            AVISIT,
            start = 6,
            stop = str_locate(AVISIT, "DAY") - 1
          )
        )
      ),
    TRUE ~ NA_character_
  )) %>%
  mutate(AVISITCDN = case_when(
    AVISITCD == "SCR" ~ -2,
    AVISITCD == "BL" ~ 0,
    grepl("W", AVISITCD) ~ as.numeric(gsub("\\D+", "", AVISITCD)),
    TRUE ~ NA_real_
  )) %>%
  # use ARMCD values to order treatment in visualization legend
  mutate(TRTORD = ifelse(grepl("C", ARMCD), 1,
    ifelse(grepl("B", ARMCD), 2,
      ifelse(grepl("A", ARMCD), 3, NA)
    )
  )) %>%
  mutate(ARM = as.character(arm_mapping[match(ARM, names(arm_mapping))])) %>%
  mutate(ARM = factor(ARM) %>%
    reorder(TRTORD))
attr(ADLB[["ARM"]], "label") <- var_labels[["ARM"]]

g_scatterplot(
  label = "Scatter Plot",
  data = ADLB,
  param_var = "PARAMCD",
  param = c("ALT"),
  xaxis_var = "BASE",
  yaxis_var = "AVAL",
  trt_group = "ARM",
  visit = "AVISITCD",
  loq_flag_var = "LOQFL",
  unit = "AVALU",
  color_manual = color_manual,
  shape_manual = shape_manual,
  facet_ncol = 2,
  facet = TRUE,
  facet_var = "ARM",
  reg_line = TRUE,
  hline = NULL,
  vline = .5,
  rotate_xlab = TRUE,
  font_size = 14,
  dot_size = 2,
  reg_text_size = 3
)
#> Warning: `g_scatterplot()` was deprecated in goshawk 0.1.15.
#> ℹ You should use goshawk::g_correlationplot instead of goshawk::g_scatterplot