Default plot displays correlation facetted by visit with color attributed treatment arms and
symbol attributed LOQ values.
Usage
g_correlationplot(
  label = "Correlation Plot",
  data,
  param_var = "PARAMCD",
  xaxis_param = "CRP",
  xaxis_var = "BASE",
  xvar,
  yaxis_param = "IGG",
  yaxis_var = "AVAL",
  yvar,
  trt_group = "ARM",
  visit = "AVISITCD",
  loq_flag_var = "LOQFL_COMB",
  visit_facet = TRUE,
  loq_legend = TRUE,
  unit = "AVALU",
  xlim = c(NA, NA),
  ylim = c(NA, NA),
  title_text = title_text,
  xaxis_lab = xaxis_lab,
  yaxis_lab = yaxis_lab,
  color_manual = NULL,
  shape_manual = NULL,
  facet_ncol = 2,
  facet = FALSE,
  facet_var = "ARM",
  reg_line = FALSE,
  hline_arb = numeric(0),
  hline_arb_color = "red",
  hline_arb_label = "Horizontal line",
  hline_vars = character(0),
  hline_vars_colors = "green",
  hline_vars_labels = hline_vars,
  vline_arb = numeric(0),
  vline_arb_color = "red",
  vline_arb_label = "Vertical line",
  vline_vars = character(0),
  vline_vars_colors = "green",
  vline_vars_labels = vline_vars,
  rotate_xlab = FALSE,
  font_size = 12,
  dot_size = 2,
  reg_text_size = 3
)
Arguments
- label
text string to used to identify plot.
- data
ADaMstructured analysis laboratory data frame e.g.ADLB.- param_var
name of variable containing biomarker codes e.g.
PARAMCD.- xaxis_param
x-axis biomarker to visualize e.g.
IGG.- xaxis_var
name of variable containing biomarker results displayed on X-axis e.g.
BASE.- xvar
x-axis analysis variable from transposed data set.
- yaxis_param
y-axis biomarker to visualize e.g.
IGG.- yaxis_var
name of variable containing biomarker results displayed on Y-axis.g.
AVAL.- yvar
y-axis analysis variable from transposed data set.
- trt_group
name of variable representing treatment group e.g.
ARM.- visit
name of variable containing nominal visits e.g.
AVISITCD.- loq_flag_var
name of variable containing
LOQflag e.g.LOQFL_COMB.- visit_facet
visit facet toggle.
- loq_legend
logicalwhether to includeLoQlegend.- unit
name of variable containing biomarker unit e.g.
AVALU.- xlim
('numeric vector') optional, a vector of length 2 to specify the minimum and maximum of the x-axis if the default limits are not suitable.
- ylim
('numeric vector') optional, a vector of length 2 to specify the minimum and maximum of the y-axis if the default limits are not suitable.
- title_text
plot title.
- xaxis_lab
x-axis label.
- yaxis_lab
y-axis label.
- color_manual
vector of colors applied to treatment values.
- shape_manual
vector of symbols applied to
LOQvalues. (used withloq_flag_var).- facet_ncol
number of facets per row.
- facet
set layout to use treatment facetting.
- facet_var
variable to use for treatment facetting.
- reg_line
include regression line and annotations for slope and coefficient. Use with facet = TRUE.
- hline_arb
('numeric vector') value identifying intercept for arbitrary horizontal lines.
- hline_arb_color
('character vector') optional, color for the arbitrary horizontal lines.
- hline_arb_label
('character vector') optional, label for the legend to the arbitrary horizontal lines.
- hline_vars
('character vector'), names of variables
(ANR*)or values(*LOQ)identifying intercept values. The data inside of theggplot2object must also contain the columns with these variable names- hline_vars_colors
('character vector') colors for the horizontal lines defined by variables.
- hline_vars_labels
('character vector') labels for the legend to the horizontal lines defined by variables.
- vline_arb
('numeric vector') value identifying intercept for arbitrary vertical lines.
- vline_arb_color
('character vector') optional, color for the arbitrary vertical lines.
- vline_arb_label
('character vector') optional, label for the legend to the arbitrary vertical lines.
- vline_vars
('character vector'), names of variables
(ANR*)or values(*LOQ)identifying intercept values. The data inside of theggplot2object must also contain the columns with these variable names- vline_vars_colors
('character vector') colors for the vertical lines defined by variables.
- vline_vars_labels
('character vector') labels for the legend to the vertical lines defined by variables.
- rotate_xlab
45 degree rotation of x-axis label values.
- font_size
font size control for title, x-axis label, y-axis label and legend.
- dot_size
plot dot size.
- reg_text_size
font size control for regression line annotations.
Examples
# Example using ADaM structure analysis dataset.
library(stringr)
library(tidyr)
# original ARM value = dose value
arm_mapping <- list(
"A: Drug X" = "150mg QD",
"B: Placebo" = "Placebo",
"C: Combination" = "Combination"
)
color_manual <- c("150mg QD" = "#000000", "Placebo" = "#3498DB", "Combination" = "#E74C3C")
# assign LOQ flag symbols: circles for "N" and triangles for "Y", squares for "NA"
shape_manual <- c("N" = 1, "Y" = 2, "NA" = 0)
ADLB <- rADLB
var_labels <- lapply(ADLB, function(x) attributes(x)$label)
ADLB <- ADLB %>%
mutate(AVISITCD = case_when(
AVISIT == "SCREENING" ~ "SCR",
AVISIT == "BASELINE" ~ "BL",
grepl("WEEK", AVISIT) ~
paste(
"W",
trimws(
substr(
AVISIT,
start = 6,
stop = str_locate(AVISIT, "DAY") - 1
)
)
),
TRUE ~ NA_character_
)) %>%
mutate(AVISITCDN = case_when(
AVISITCD == "SCR" ~ -2,
AVISITCD == "BL" ~ 0,
grepl("W", AVISITCD) ~ as.numeric(gsub("\\D+", "", AVISITCD)),
TRUE ~ NA_real_
)) %>%
# use ARMCD values to order treatment in visualization legend
mutate(TRTORD = ifelse(grepl("C", ARMCD), 1,
ifelse(grepl("B", ARMCD), 2,
ifelse(grepl("A", ARMCD), 3, NA)
)
)) %>%
mutate(ARM = as.character(arm_mapping[match(ARM, names(arm_mapping))])) %>%
mutate(ARM = factor(ARM) %>%
reorder(TRTORD)) %>%
mutate(
ANRHI = case_when(
PARAMCD == "ALT" ~ 60,
PARAMCD == "CRP" ~ 70,
PARAMCD == "IGA" ~ 80,
TRUE ~ NA_real_
),
ANRLO = case_when(
PARAMCD == "ALT" ~ 20,
PARAMCD == "CRP" ~ 30,
PARAMCD == "IGA" ~ 40,
TRUE ~ NA_real_
)
) %>%
rowwise() %>%
group_by(PARAMCD) %>%
mutate(LBSTRESC = ifelse(
USUBJID %in% sample(USUBJID, 1, replace = TRUE),
paste("<", round(runif(1, min = 25, max = 30))), LBSTRESC
)) %>%
mutate(LBSTRESC = ifelse(
USUBJID %in% sample(USUBJID, 1, replace = TRUE),
paste(">", round(runif(1, min = 70, max = 75))), LBSTRESC
)) %>%
ungroup()
attr(ADLB[["ARM"]], "label") <- var_labels[["ARM"]]
attr(ADLB[["ANRHI"]], "label") <- "Analysis Normal Range Upper Limit"
attr(ADLB[["ANRLO"]], "label") <- "Analysis Normal Range Lower Limit"
# add LLOQ and ULOQ variables
ADLB_LOQS <- goshawk:::h_identify_loq_values(ADLB, flag_var = "LOQFL")
ADLB <- left_join(ADLB, ADLB_LOQS, by = "PARAM")
# given the 2 param and 2 analysis vars we need to transform the data
plot_data_t1 <- ADLB %>%
gather(
ANLVARS, ANLVALS, PARAM, LBSTRESC, BASE2, BASE, AVAL, BASE, LOQFL,
ANRHI, ANRLO, ULOQN, LLOQN
) %>%
mutate(ANL.PARAM = ifelse(ANLVARS %in% c("PARAM", "LBSTRESC", "LOQFL"),
paste0(ANLVARS, "_", PARAMCD),
paste0(ANLVARS, ".", PARAMCD)
)) %>%
select(USUBJID, ARM, ARMCD, AVISITN, AVISITCD, ANL.PARAM, ANLVALS) %>%
spread(ANL.PARAM, ANLVALS)
#> Warning: attributes are not identical across measure variables; they will be dropped
# the transformed analysis value variables are character and need to be converted to numeric for
# ggplot
# remove records where either of the analysis variables are NA since they will not appear on the
# plot and will ensure that LOQFL = NA level is removed
plot_data_t2 <- plot_data_t1 %>%
filter(!is.na(BASE.CRP) & !is.na(AVAL.ALT)) %>%
mutate_at(vars(contains(".")), as.numeric) %>%
mutate(
LOQFL_COMB = ifelse(LOQFL_CRP == "Y" | LOQFL_ALT == "Y", "Y", "N")
)
g_correlationplot(
label = "Correlation Plot",
data = plot_data_t2,
param_var = "PARAMCD",
xaxis_param = c("CRP"),
xaxis_var = "AVAL",
xvar = "AVAL.CRP",
yaxis_param = c("ALT"),
yaxis_var = "BASE",
yvar = "BASE.ALT",
trt_group = "ARM",
visit = "AVISITCD",
visit_facet = TRUE,
loq_legend = TRUE,
unit = "AVALU",
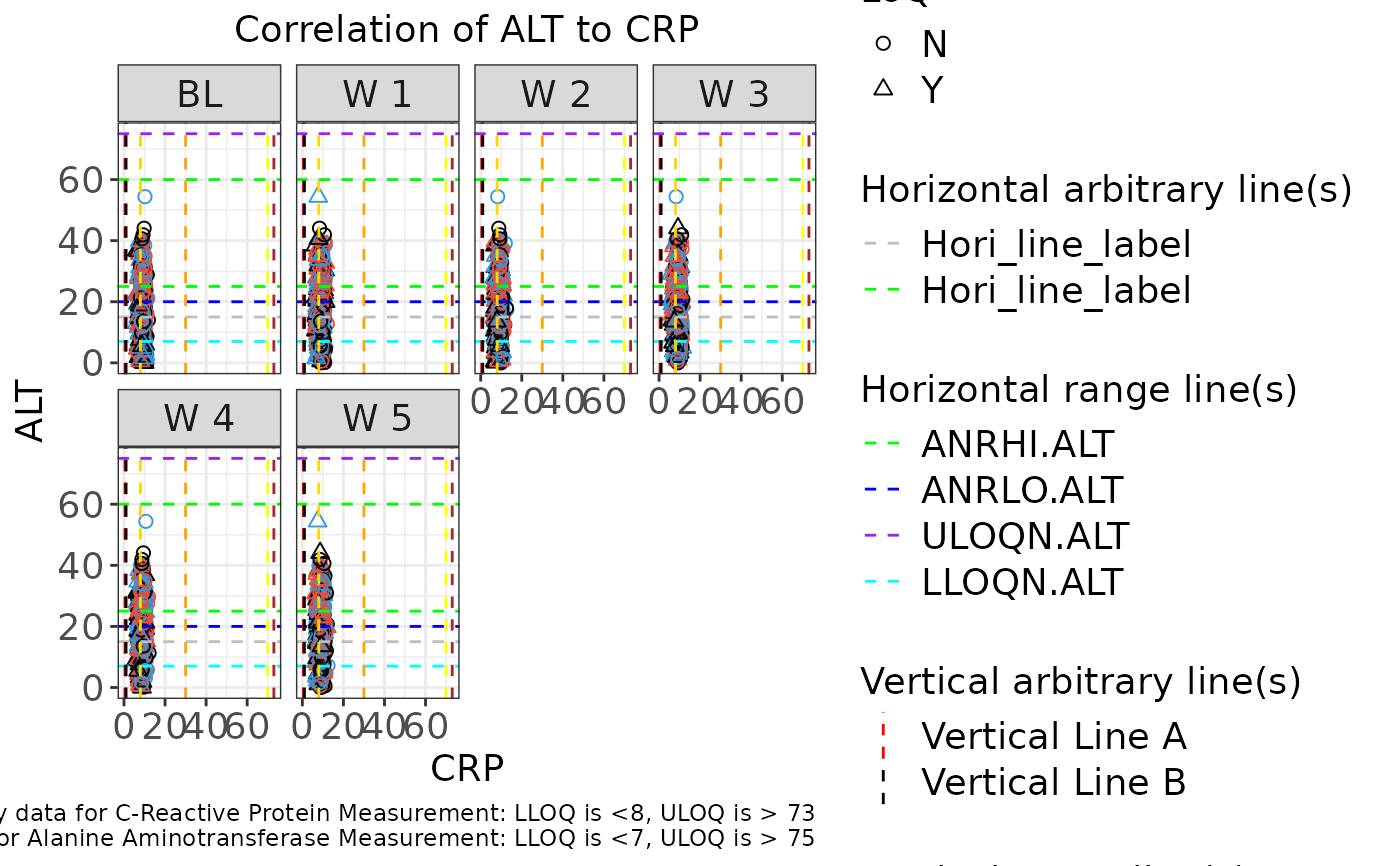
title_text = "Correlation of ALT to CRP",
xaxis_lab = "CRP",
yaxis_lab = "ALT",
color_manual = color_manual,
shape_manual = shape_manual,
facet_ncol = 4,
facet = FALSE,
facet_var = "ARM",
reg_line = FALSE,
hline_arb = c(15, 25),
hline_arb_color = c("gray", "green"),
hline_arb_label = "Hori_line_label",
vline_arb = c(.5, 1),
vline_arb_color = c("red", "black"),
vline_arb_label = c("Vertical Line A", "Vertical Line B"),
hline_vars = c("ANRHI.ALT", "ANRLO.ALT", "ULOQN.ALT", "LLOQN.ALT"),
hline_vars_colors = c("green", "blue", "purple", "cyan"),
hline_vars_labels = c("ANRHI ALT Label", "ANRLO ALT Label", "ULOQN ALT Label", "LLOQN ALT Label"),
vline_vars = c("ANRHI.CRP", "ANRLO.CRP", "ULOQN.CRP", "LLOQN.CRP"),
vline_vars_colors = c("yellow", "orange", "brown", "gold"),
vline_vars_labels = c("ANRHI CRP Label", "ANRLO CRP Label", "ULOQN CRP Label", "LLOQN CRP Label"),
rotate_xlab = FALSE,
font_size = 14,
dot_size = 2,
reg_text_size = 3
)