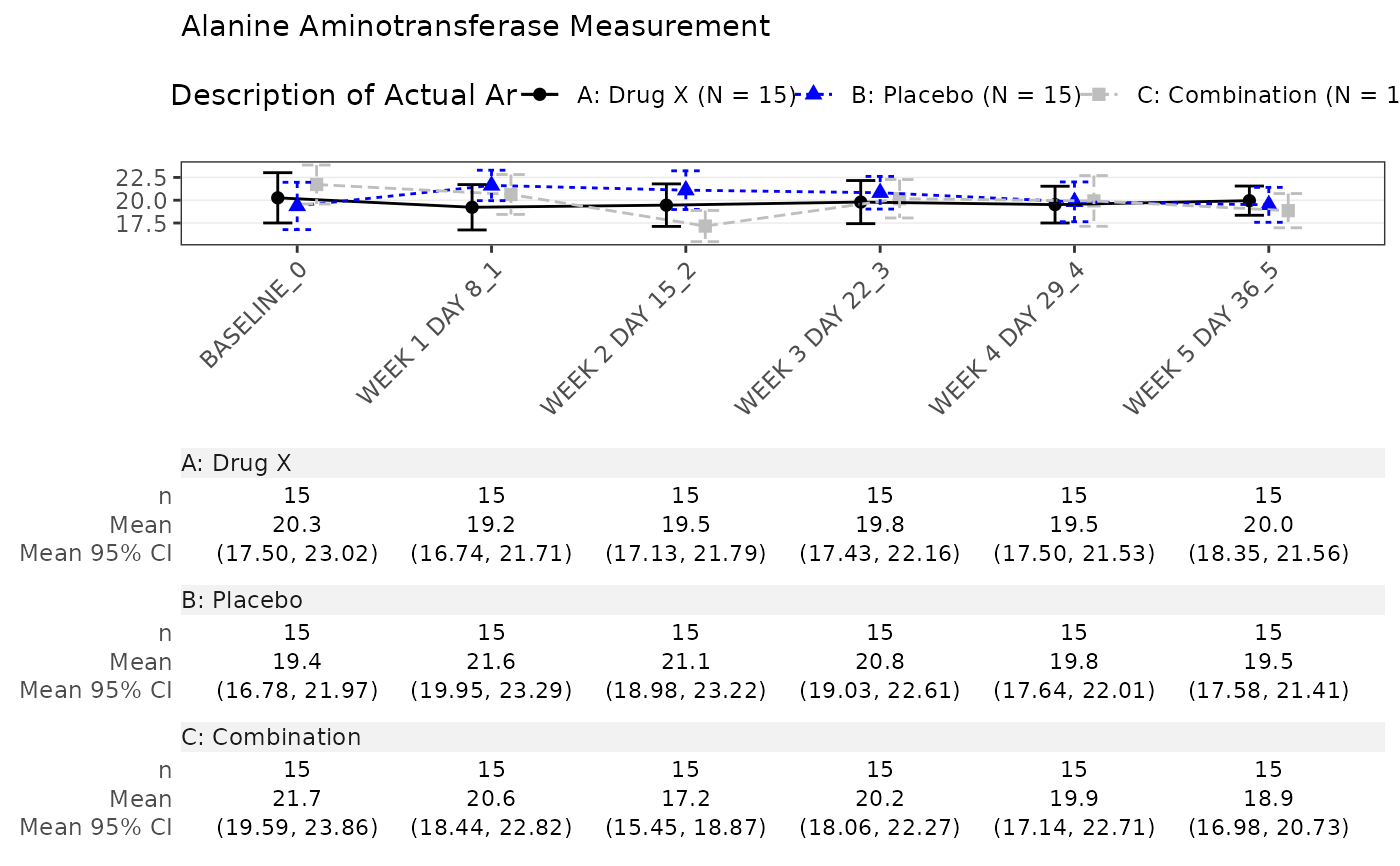
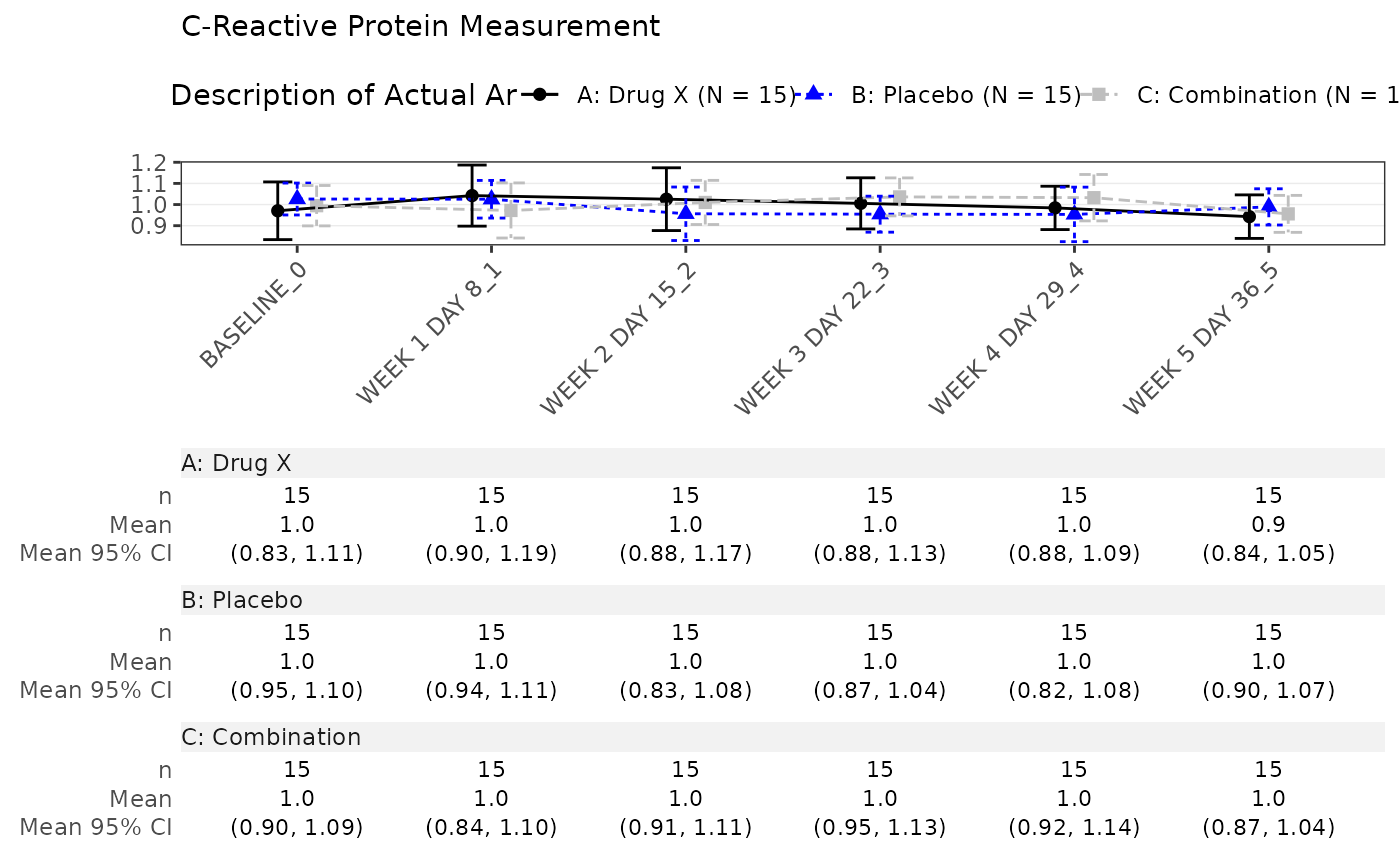
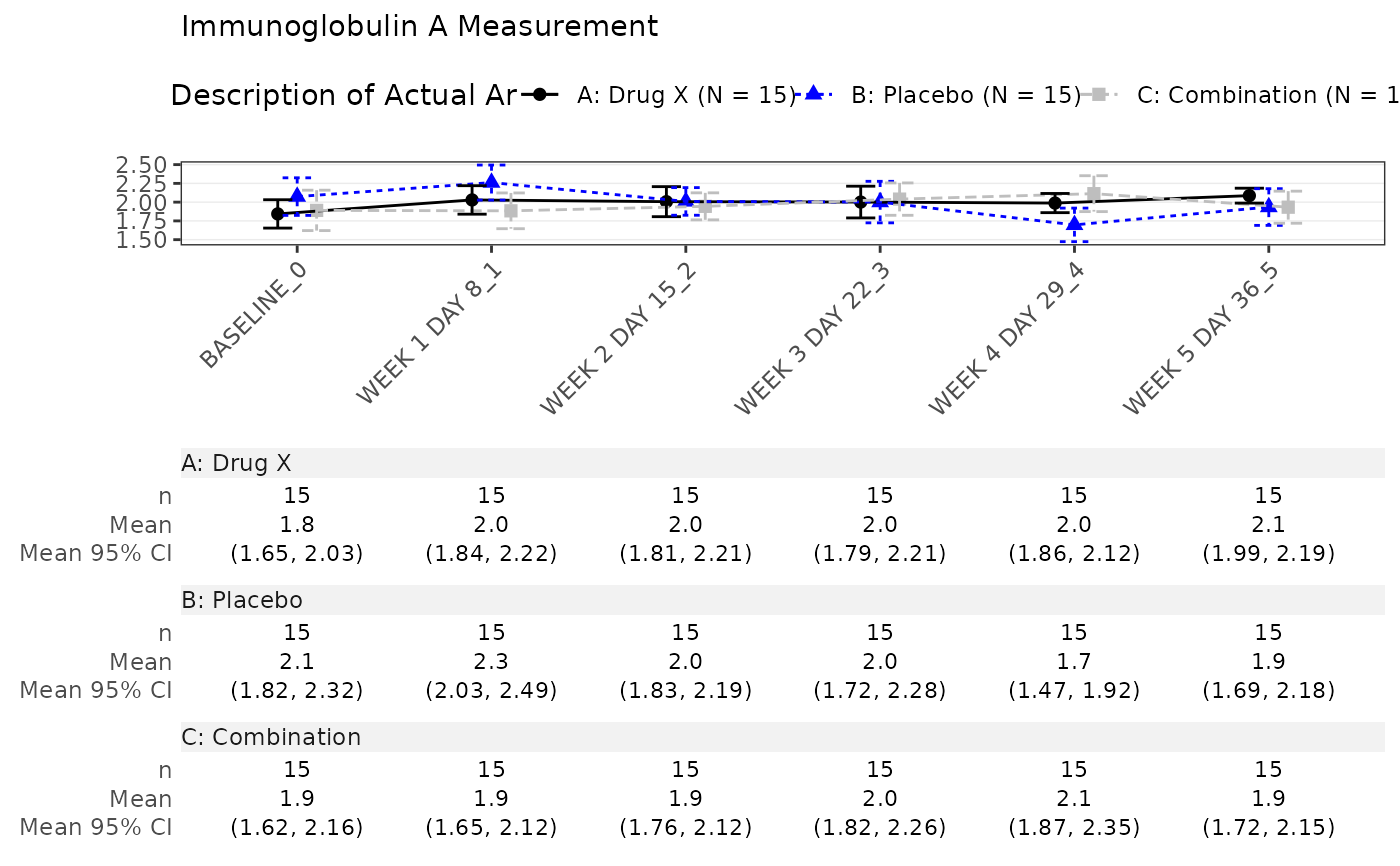
Overview of a summary statistics across time and arm for a selected data set.
Usage
mng01_main(
  adam_db,
  dataset = "adlb",
  x_var = "AVISIT",
  y_var = "AVAL",
  y_name = "PARAM",
  y_unit = NULL,
  arm_var = "ACTARM",
  center_fun = "mean",
  interval_fun = "mean_ci",
  jitter = 0.3,
  line_col = nestcolor::color_palette(),
  ggtheme = gg_theme_chevron(),
  table = c("n", center_fun, interval_fun),
  ...
)

mng01_pre(adam_db, dataset, x_var = "AVISIT", ...)

mng01Arguments
- adam_db
(
listofdata.frames) object containing theADaMdatasets- dataset
(
string) the name of a table in theadam_dbobject.- x_var
(
string) the name of a column in thedatasetto represent on the x-axis.- y_var
(
string) the name of the variable to be represented on the y-axis.- y_name
(
string) the variable name fory. Used for plot's subtitle.- y_unit
(
string) the name of the variable with the units ofy. Used for plot's subtitle. ifNULL, onlyy_nameis displayed as subtitle.- arm_var
(
string) variable used for column splitting- center_fun
(
string) the function to compute the estimate value.- interval_fun
(
string) the function defining the crossbar range. IfNULL, no crossbar is displayed.- jitter
(
numeric) the width of spread for data points on the x-axis; a number from 0 (nojitter) to 1 (highjitter), with a default of 0.3 (slightjitter).- line_col
(
character) describing the colors to use for the lines or a namedcharacterassociating values ofarm_varwith color names.- ggtheme
(
theme) passed totern::g_lineplot().- table
(
character) names of the statistics to be displayed in the table. IfNULL, no table is displayed.- ...
passed to
tern::g_lineplot().
Value
the main function returns a list of ggplot objects.
a list of ggplot objects.
the preprocessing function returns a list of data.frame.
Note
adam_dbobject must contain the table specified bydatasetwith the columns specified byx_var,y_var,y_name,y_unitandarm_var.