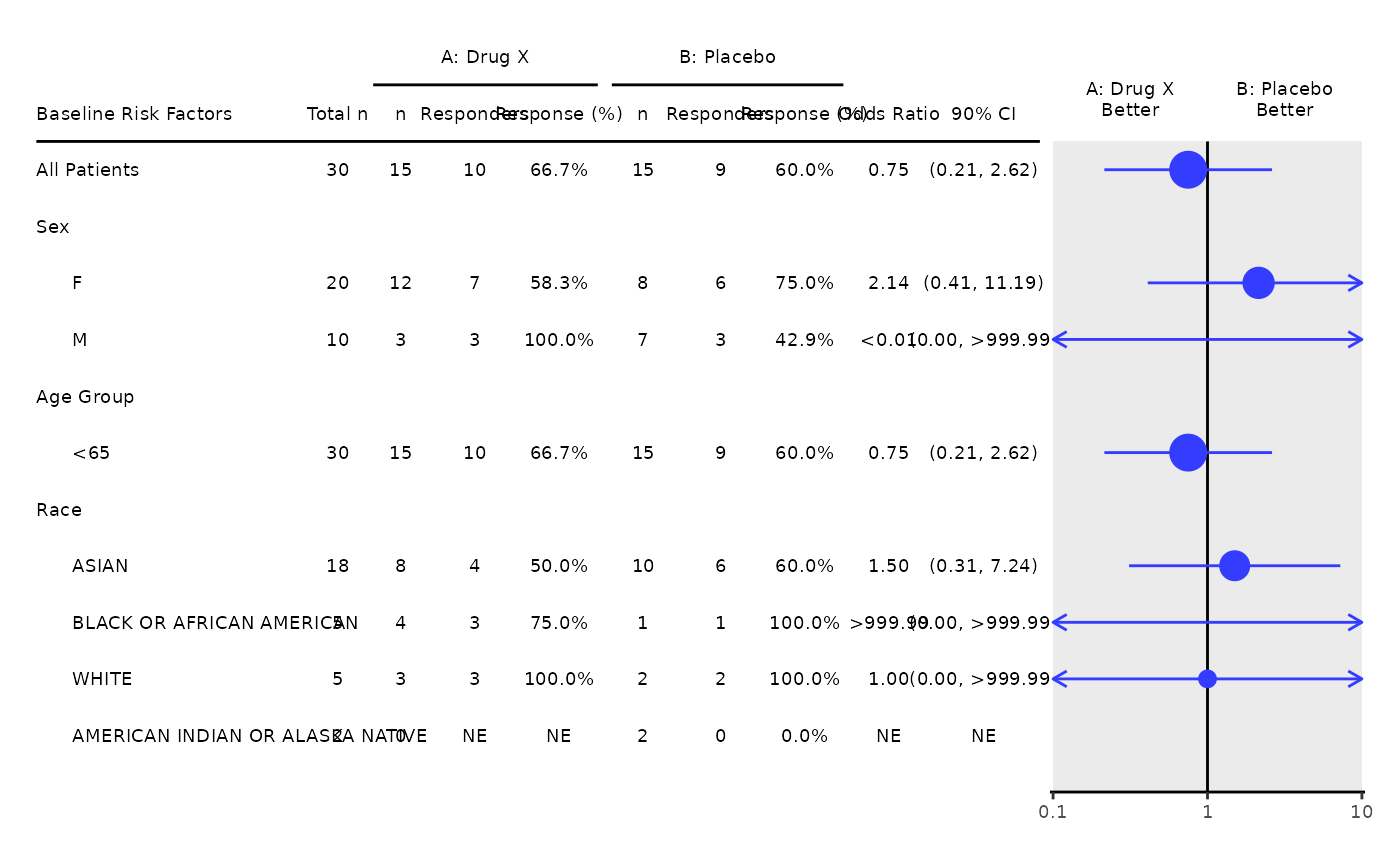
The template produces the subgroup analysis of best overall response graphic.
Arguments
- adam_db
(
listofdata.frames) object containing theADaMdatasets- dataset
(
string) the name of a table in theadam_dbobject.- arm_var
(
string) the arm variable name used for group splitting.- rsp_var
(
string) the response variable name to flag whether each subject is a binary response or not.- subgroups
(
character) the subgroups variable name to list baseline risk factors.- strata_var
(
character) required if stratified analysis is performed.- stat_var
(
character) the names of statistics to be reported intabulate_rsp_subgroups.- ...
Further arguments passed to
g_forestandextract_rsp_subgroups(a wrapper forh_odds_ratio_subgroups_dfandh_proportion_subgroups_df). For details, see the documentation intern. Commonly used arguments includecol_symbol_size,col,vline,groups_lists,conf_level,method,label_all, etc.
Value
the main function returns a grob object.
a gTree object.
the preprocessing function returns a list of data.frame.
Note
adam_dbobject must contain the table specified bydatasetwith"PARAMCD","ARM","AVALC", and the columns specified bysubgroupswhich is denoted asc("SEX", "AGEGR1", "RACE")by default.If the plot is too large to be rendered in the output, please provide
gp,width_row_names,width_columnsandwidth_forestmanually to make it fit. Seetern::g_forestfor more details.