Add titles, footnotes, page Number, and a bounding box to a grid grob
Source:R/decorate_grob.R
decorate_grob.Rd![[Stable]](figures/lifecycle-stable.svg)
This function is useful to label grid grobs (also ggplot2, and lattice plots)
with title, footnote, and page numbers.
Usage
decorate_grob(
  grob,
  titles,
  footnotes,
  page = "",
  width_titles = grid::unit(1, "npc"),
  width_footnotes = grid::unit(1, "npc"),
  border = TRUE,
  padding = grid::unit(rep(1, 4), "lines"),
  margins = grid::unit(c(1, 0, 1, 0), "lines"),
  outer_margins = grid::unit(c(2, 1.5, 3, 1.5), "cm"),
  gp_titles = grid::gpar(),
  gp_footnotes = grid::gpar(fontsize = 8),
  name = NULL,
  gp = grid::gpar(),
  vp = NULL
)
Arguments
- grob
(
grob)
a grid grob object, optionallyNULLif only agrobwith the decoration should be shown.- titles
(
character)
titles given as a vector of strings that are each separated by a newline and wrapped according to the page width.- footnotes
(
character)
footnotes. Uses the same formatting rules astitles.- page
(
stringorNULL)
page numeration. IfNULLthen no page number is displayed.- width_titles
(
grid::unit)
width of titles. Usually defined as all the available spacegrid::unit(1, "npc"), it is affected by the parameterouter_margins. Right margins (outer_margins[4]) need to be subtracted to the allowed width.- width_footnotes
(
grid::unit)
width of footnotes. Same default and margin correction aswidth_titles.- border
(
flag)
whether a border should be drawn around the plot or not.- padding
(
grid::unit)
padding. A unit object of length 4. Innermost margin between the plot (grob) and, possibly, the border of the plot. Usually expressed in 4 identical values (usually"lines"). It defaults togrid::unit(rep(1, 4), "lines").- margins
(
grid::unit)
margins. A unit object of length 4. Margins between the plot and the other elements in the list (e.g. titles, plot, and footers). This is usually expressed in 4"lines", where the lateral ones are 0s, while top and bottom are 1s. It defaults togrid::unit(c(1, 0, 1, 0), "lines").- outer_margins
(
grid::unit)
outer margins. A unit object of length 4. It defines the general margin of the plot, considering also decorations like titles, footnotes, and page numbers. It defaults togrid::unit(c(2, 1.5, 3, 1.5), "cm").- gp_titles
(
gpar)
agparobject. Mainly used to set different"fontsize".- gp_footnotes
(
gpar)
agparobject. Mainly used to set different"fontsize".- name
a character identifier for the grob. Used to find the grob on the display list and/or as a child of another grob.
- gp
A
"gpar"object, typically the output from a call to the functiongpar. This is basically a list of graphical parameter settings.- vp
a
viewportobject (orNULL).
Examples
library(grid)
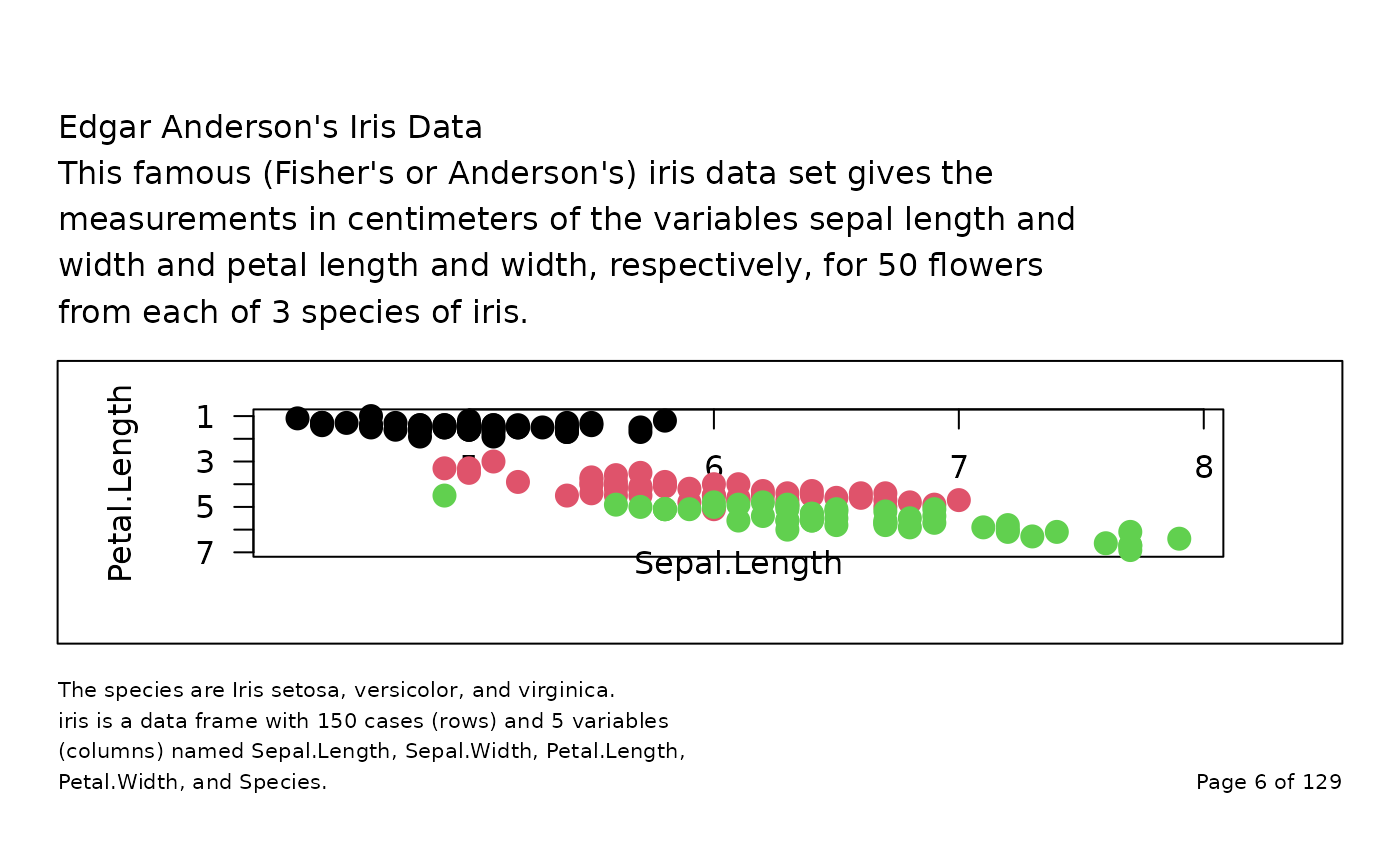
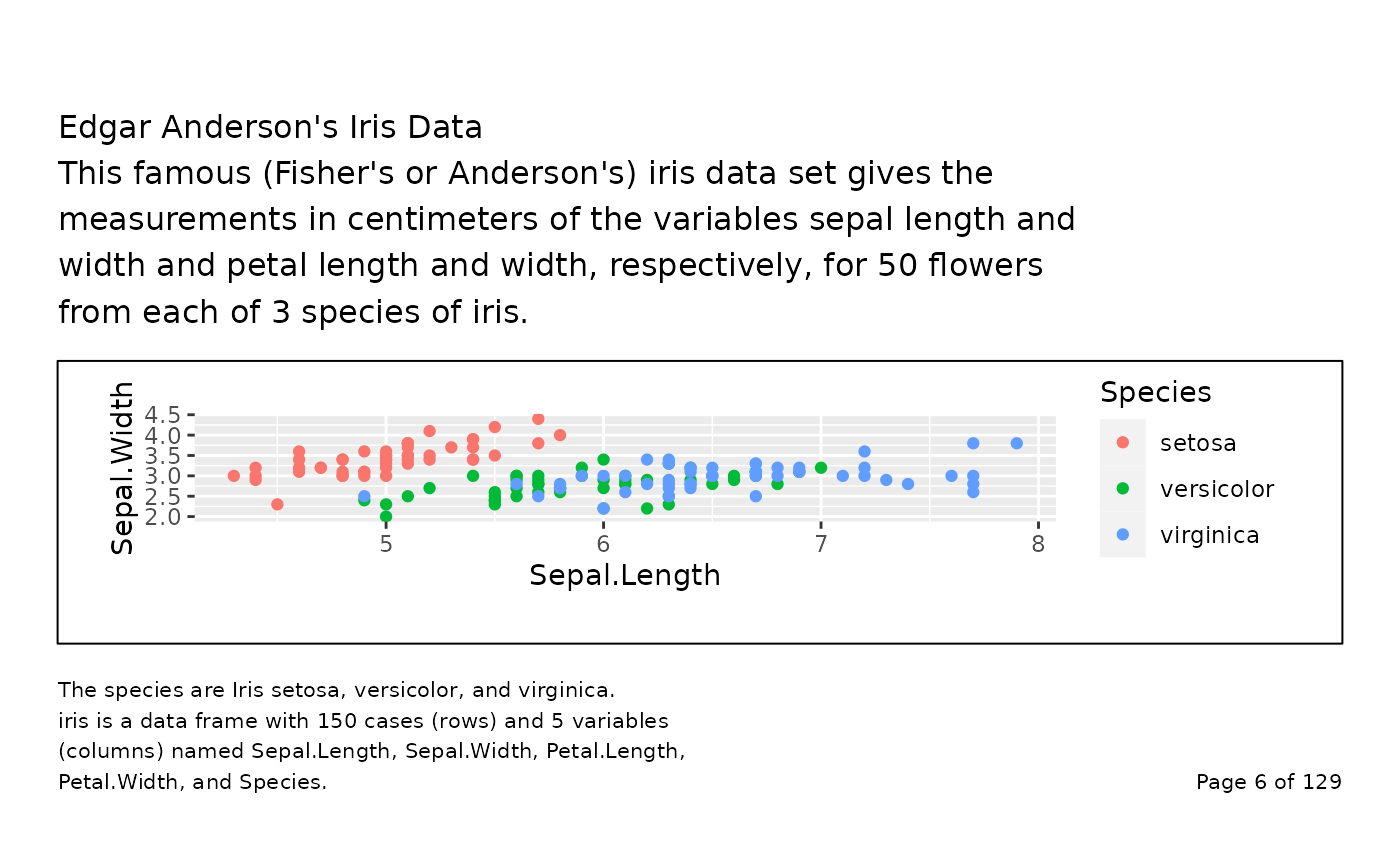
titles <- c(
"Edgar Anderson's Iris Data",
paste(
"This famous (Fisher's or Anderson's) iris data set gives the measurements",
"in centimeters of the variables sepal length and width and petal length",
"and width, respectively, for 50 flowers from each of 3 species of iris."
)
)
footnotes <- c(
"The species are Iris setosa, versicolor, and virginica.",
paste(
"iris is a data frame with 150 cases (rows) and 5 variables (columns) named",
"Sepal.Length, Sepal.Width, Petal.Length, Petal.Width, and Species."
)
)
## empty plot
grid.newpage()
grid.draw(
decorate_grob(
NULL,
titles = titles,
footnotes = footnotes,
page = "Page 4 of 10"
)
)
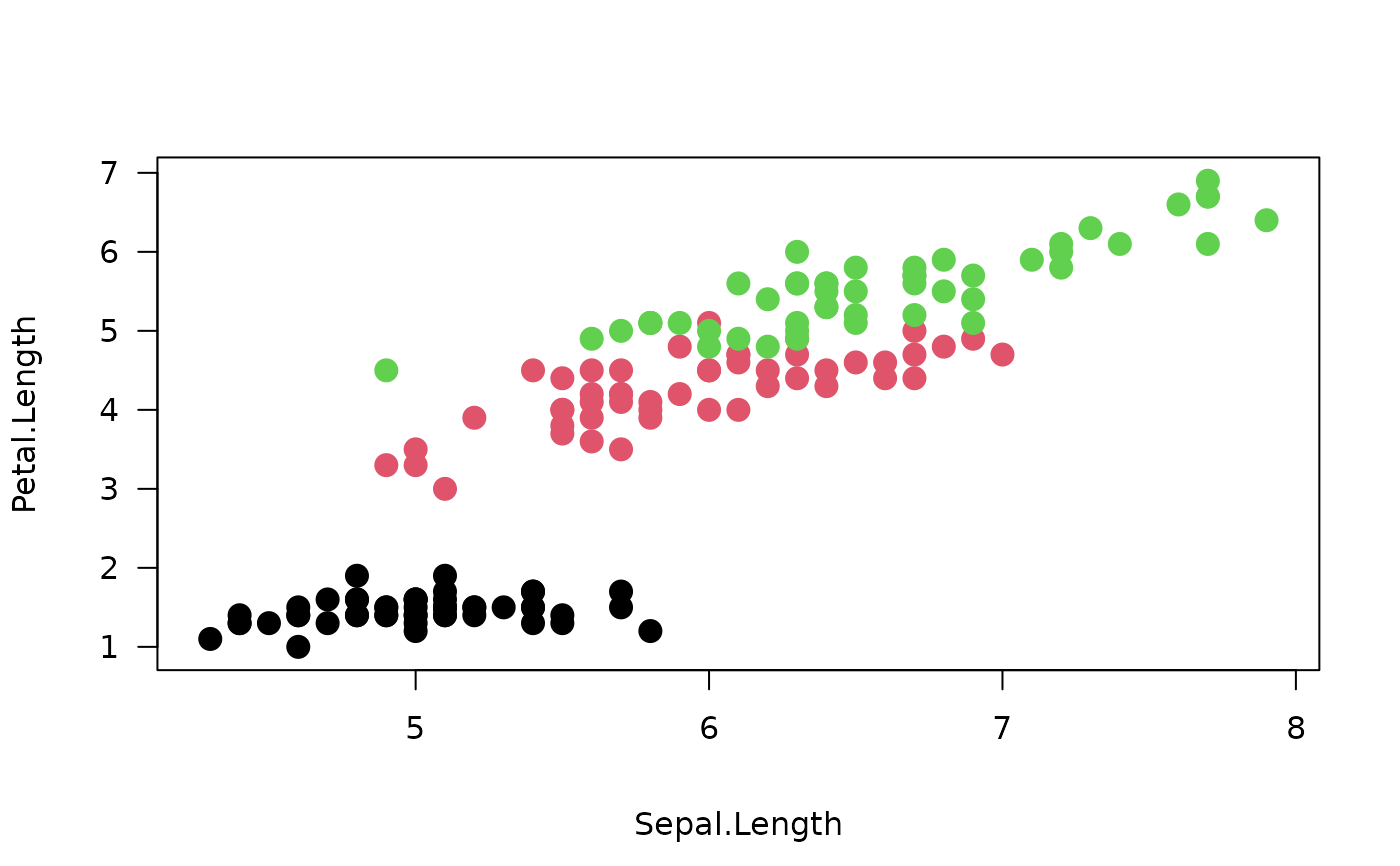
 # grid
p <- gTree(
children = gList(
rectGrob(),
xaxisGrob(),
yaxisGrob(),
textGrob("Sepal.Length", y = unit(-4, "lines")),
textGrob("Petal.Length", x = unit(-3.5, "lines"), rot = 90),
pointsGrob(iris$Sepal.Length, iris$Petal.Length, gp = gpar(col = iris$Species), pch = 16)
),
vp = vpStack(plotViewport(), dataViewport(xData = iris$Sepal.Length, yData = iris$Petal.Length))
)
grid.newpage()
grid.draw(p)
# grid
p <- gTree(
children = gList(
rectGrob(),
xaxisGrob(),
yaxisGrob(),
textGrob("Sepal.Length", y = unit(-4, "lines")),
textGrob("Petal.Length", x = unit(-3.5, "lines"), rot = 90),
pointsGrob(iris$Sepal.Length, iris$Petal.Length, gp = gpar(col = iris$Species), pch = 16)
),
vp = vpStack(plotViewport(), dataViewport(xData = iris$Sepal.Length, yData = iris$Petal.Length))
)
grid.newpage()
grid.draw(p)
 grid.newpage()
grid.draw(
decorate_grob(
grob = p,
titles = titles,
footnotes = footnotes,
page = "Page 6 of 129"
)
)
grid.newpage()
grid.draw(
decorate_grob(
grob = p,
titles = titles,
footnotes = footnotes,
page = "Page 6 of 129"
)
)
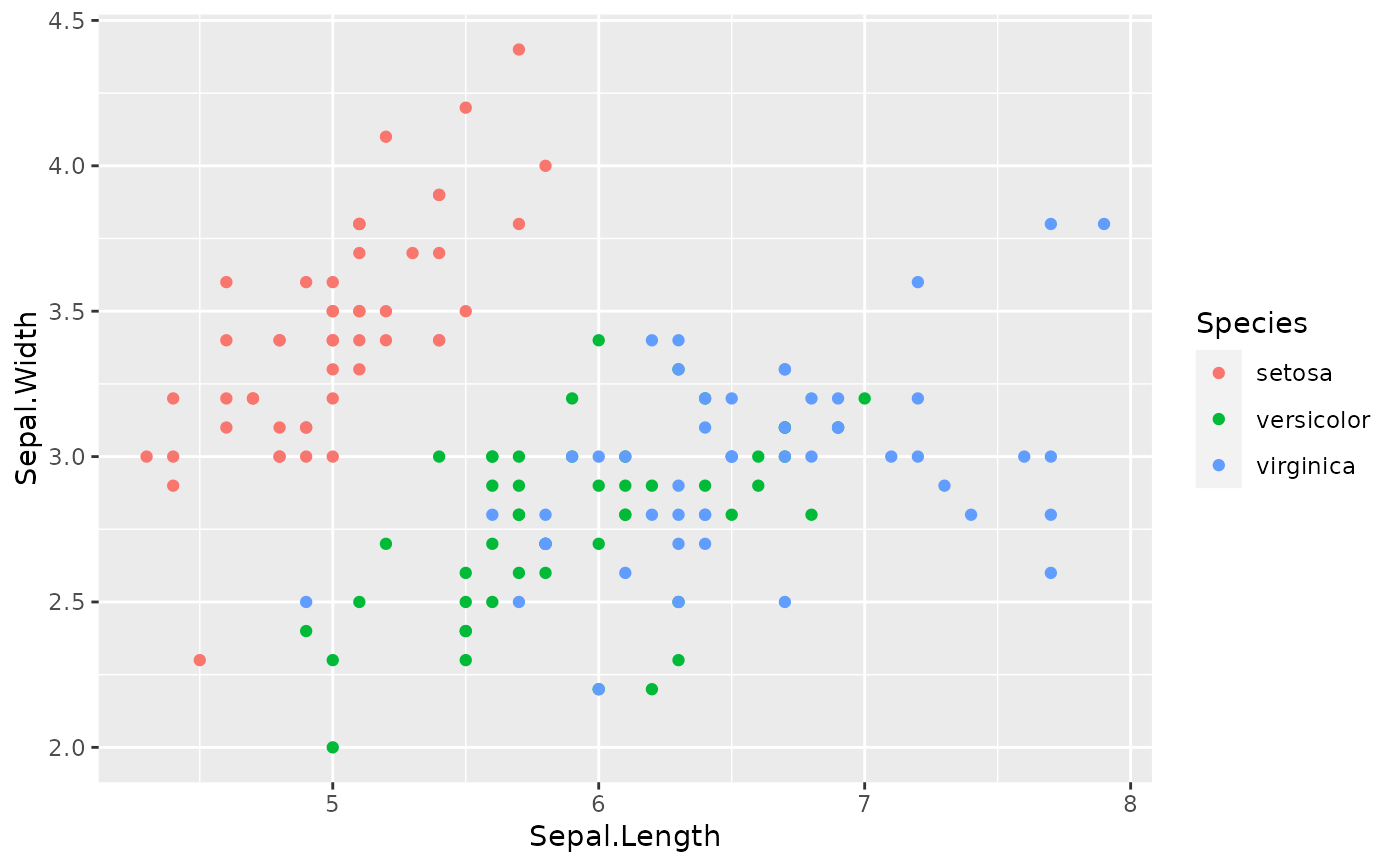
 ## with ggplot2
library(ggplot2)
p_gg <- ggplot2::ggplot(iris, aes(Sepal.Length, Sepal.Width, col = Species)) +
ggplot2::geom_point()
p_gg
## with ggplot2
library(ggplot2)
p_gg <- ggplot2::ggplot(iris, aes(Sepal.Length, Sepal.Width, col = Species)) +
ggplot2::geom_point()
p_gg
 p <- ggplotGrob(p_gg)
grid.newpage()
grid.draw(
decorate_grob(
grob = p,
titles = titles,
footnotes = footnotes,
page = "Page 6 of 129"
)
)
p <- ggplotGrob(p_gg)
grid.newpage()
grid.draw(
decorate_grob(
grob = p,
titles = titles,
footnotes = footnotes,
page = "Page 6 of 129"
)
)
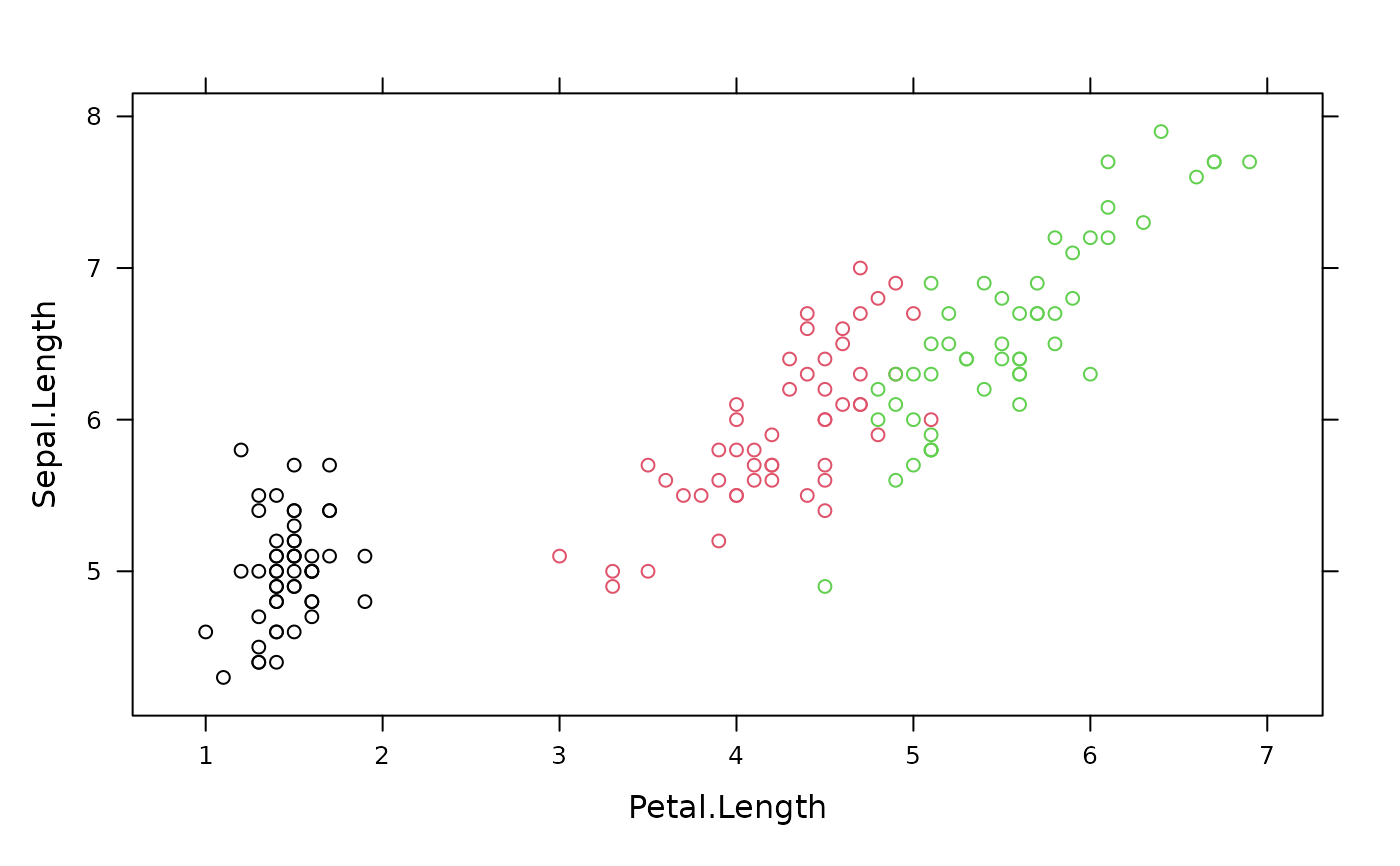
 ## with lattice
library(lattice)
xyplot(Sepal.Length ~ Petal.Length, data = iris, col = iris$Species)
## with lattice
library(lattice)
xyplot(Sepal.Length ~ Petal.Length, data = iris, col = iris$Species)
 p <- grid.grab()
 grid.newpage()
grid.draw(
decorate_grob(
grob = p,
titles = titles,
footnotes = footnotes,
page = "Page 6 of 129"
)
)
grid.newpage()
grid.draw(
decorate_grob(
grob = p,
titles = titles,
footnotes = footnotes,
page = "Page 6 of 129"
)
)
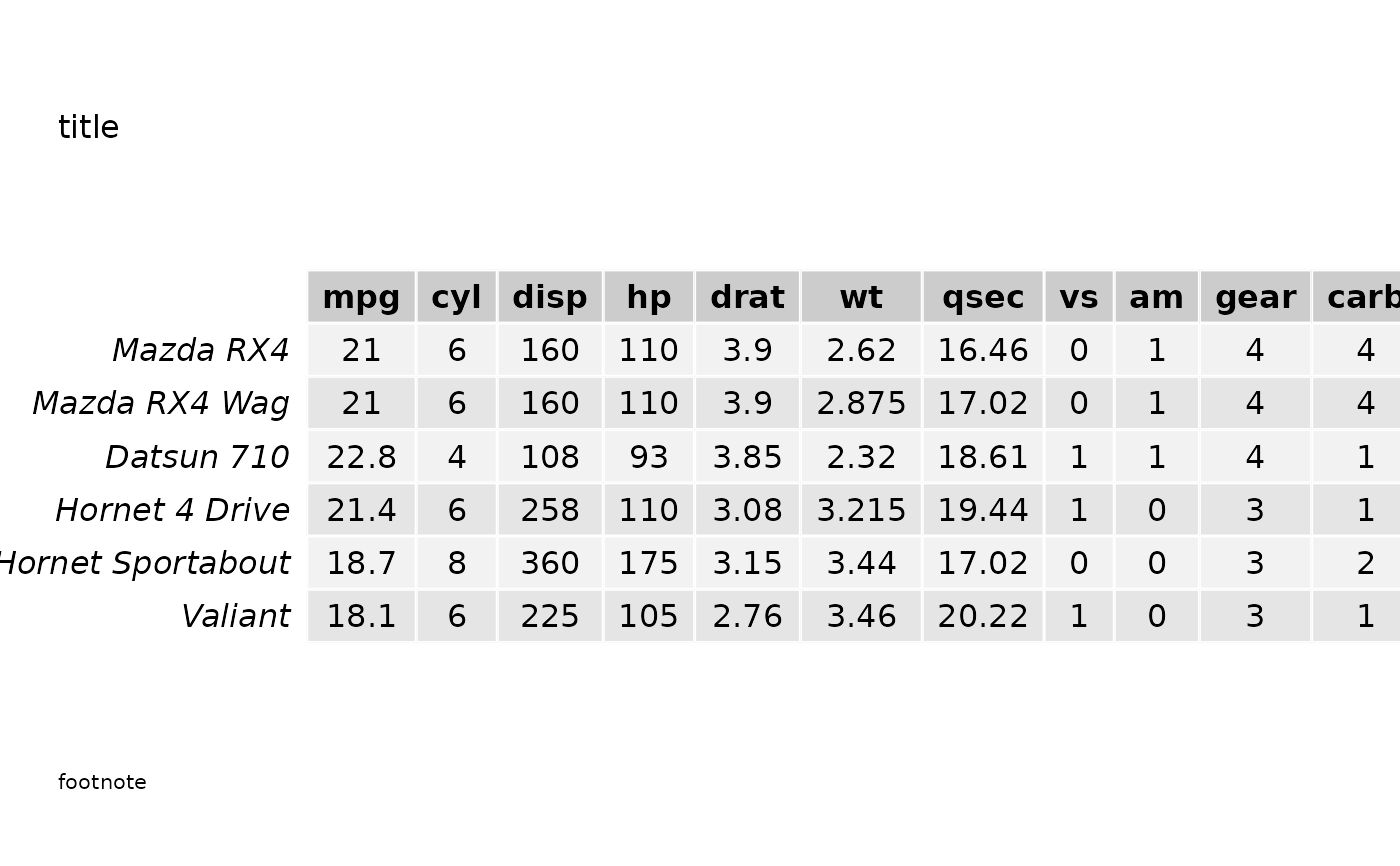
 # with gridExtra - no borders
library(gridExtra)
#>
#> Attaching package: ‘gridExtra’
#> The following object is masked from ‘package:dplyr’:
#>
#> combine
grid.newpage()
grid.draw(
decorate_grob(
tableGrob(
head(mtcars)
),
titles = "title",
footnotes = "footnote",
border = FALSE
)
)
# with gridExtra - no borders
library(gridExtra)
#>
#> Attaching package: ‘gridExtra’
#> The following object is masked from ‘package:dplyr’:
#>
#> combine
grid.newpage()
grid.draw(
decorate_grob(
tableGrob(
head(mtcars)
),
titles = "title",
footnotes = "footnote",
border = FALSE
)
)