This function summarizes adjusted lsmeans and standard error, as well as conducts
comparisons between groups' adjusted lsmeans, where the first level of the group
is the reference level.
Usage
g_mmrm_lsmeans(
  object,
  select = c("estimates", "contrasts"),
  titles = c(estimates = paste("Adjusted mean of", object$labels$response,
    "by treatment at visits"), contrasts = paste0("Differences of ",
    object$labels$response, " adjusted means vs. control ('", object$ref_level, "')")),
  xlab = object$labels$visit,
  ylab = paste0("Estimates with ", round(object$conf_level * 100), "% CIs"),
  xlimits = NULL,
  ylimits = NULL,
  width = 0.6,
  show_pval = TRUE,
  show_lines = FALSE,
  constant_baseline = NULL,
  n_baseline = NA_integer_,
  table_stats = character(),
  table_formats = c(n = "xx.", estimate = "xx.x", se = "xx.x", ci = "(xx.xx, xx.xx)"),
  table_labels = c(n = "n", estimate = "LS mean", se = "Std. Error", ci =
    paste0(round(object$conf_level * 100), "% CI")),
  table_font_size = 3,
  table_rel_height = 0.5
)
Arguments
- object
(
tern_mmrm)
model result produced byfit_mmrm().- select
(
character)
to select one or both of "estimates" and "contrasts" plots. Note "contrasts" option is not applicable to model summaries excluding an arm variable.- titles
(
character)
with elementsestimatesandcontrastscontaining the plot titles.- xlab
(
string)
the x axis label.- ylab
(
string)
the y axis label.- xlimits
(
numeric)
x axis limits.- ylimits
(
numeric)
y axis limits.- width
(
numeric)
width of the error bars.- show_pval
(
flag)
should the p-values for the differences of LS means vs. control be displayed (not default)?- show_lines
(
flag)
should the visit estimates be connected by lines (not default)?- constant_baseline
(named
numberorNULL)
optional constant baseline for the LS mean estimates. If specified then needs to be a namednumber, and the name will be used to label the corresponding baseline visit. The differences of LS means will always be 0 at this baseline visit.- n_baseline
(
intor namedinteger)
optional number of patients at baseline. Since this can be visible in the optional table below the estimates plot, and we cannot infer this fromobject(since that is then only fit without baseline data), we need to allow the user to specify this. Ifnumberthen assumed constant across potential treatment arms, otherwise one number per treatment arm can be provided.- table_stats
(
character)
names of the statistics that will be displayed in the table below the estimates plot. Note that the table will only be added when selecting only the "estimates" plot. Available statistics aren,estimate,se, andci.- table_formats
(named
character)
format patterns for descriptive statistics used in the (optional) estimates table appended to the estimates plot.- table_labels
(named
character)
labels for the statistics in the (optional) estimates table.- table_font_size
(
number)
controls the font size of values in the (optional) estimates table.- table_rel_height
(
number)
controls the relative height of the (optional) estimates table compared to the estimates plot.
Details
If variable labels are available in the original data set, then these are used. Otherwise the variable names themselves are used for annotating the plot.
The contrast plot is not going to be returned if treatment is not
considered in the tern_mmrm object input,
no matter if select argument contains the contrasts value.
Examples
library(dplyr)
mmrm_results <- fit_mmrm(
vars = list(
response = "FEV1",
covariates = c("RACE", "SEX"),
id = "USUBJID",
arm = "ARMCD",
visit = "AVISIT"
),
data = mmrm_test_data,
cor_struct = "unstructured",
weights_emmeans = "equal"
)
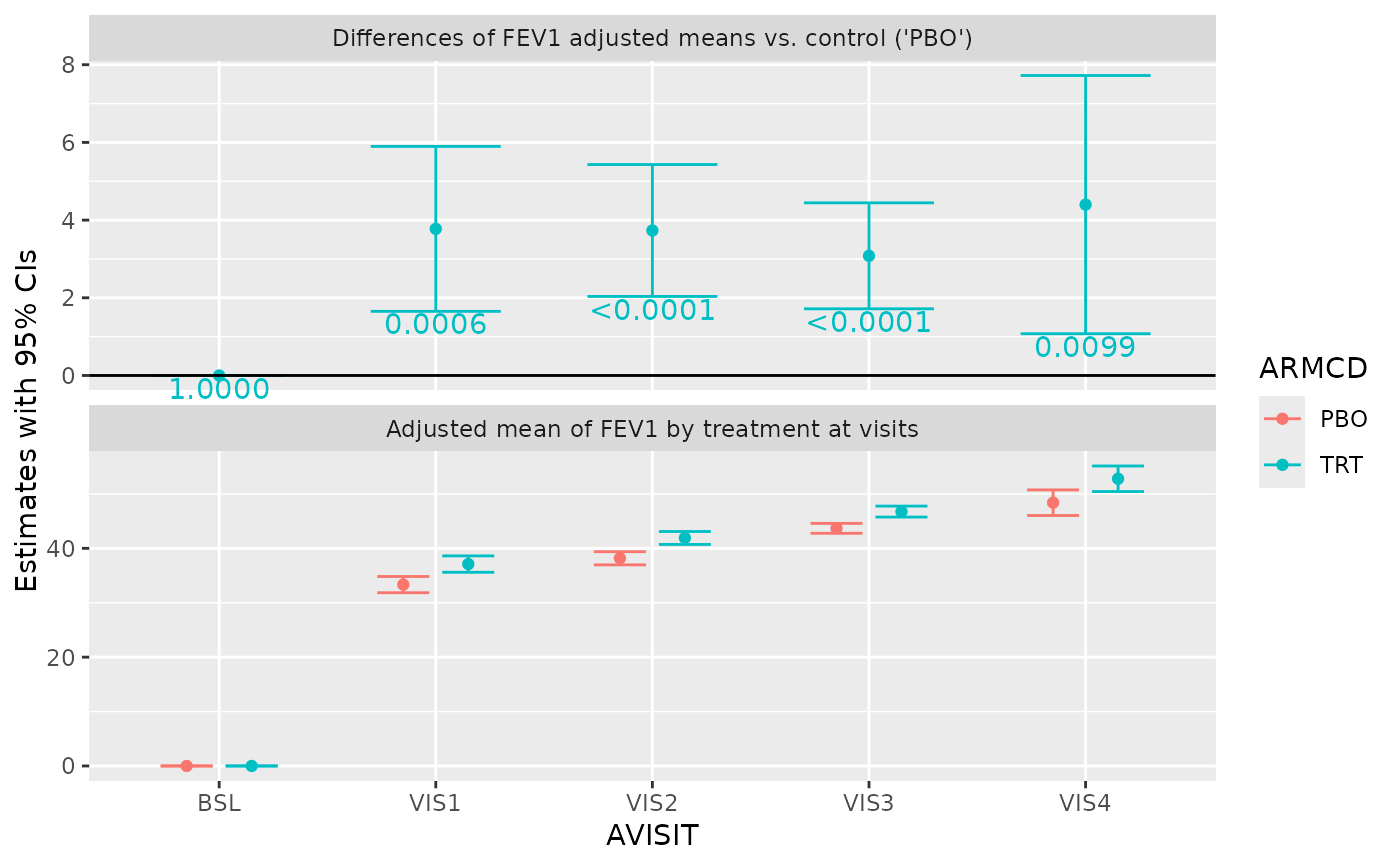
g_mmrm_lsmeans(mmrm_results, constant_baseline = c(BSL = 0))
#> Coordinate system already present. Adding new coordinate system, which will
#> replace the existing one.
 g_mmrm_lsmeans(
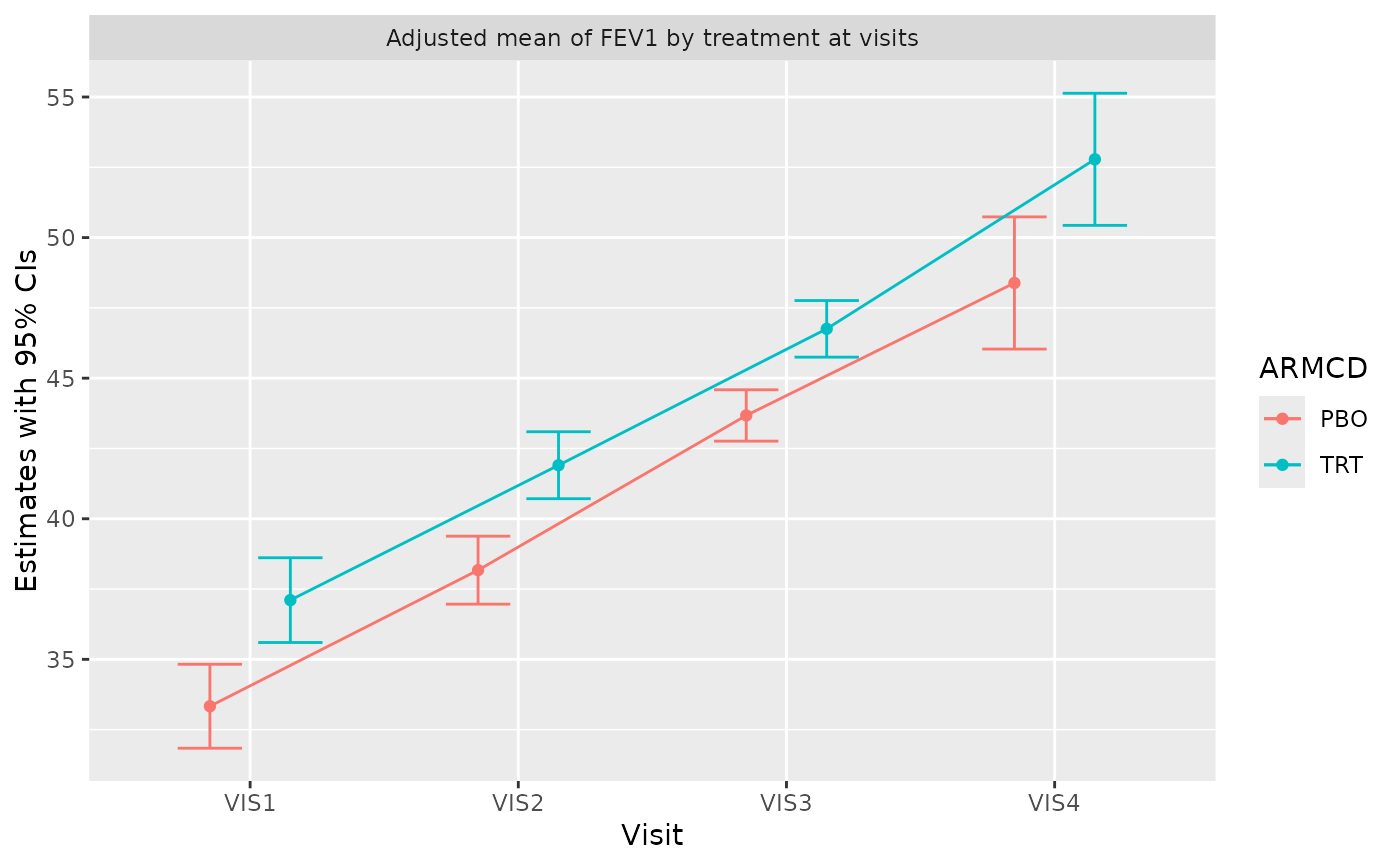
mmrm_results,
select = "estimates",
show_lines = TRUE,
xlab = "Visit"
)
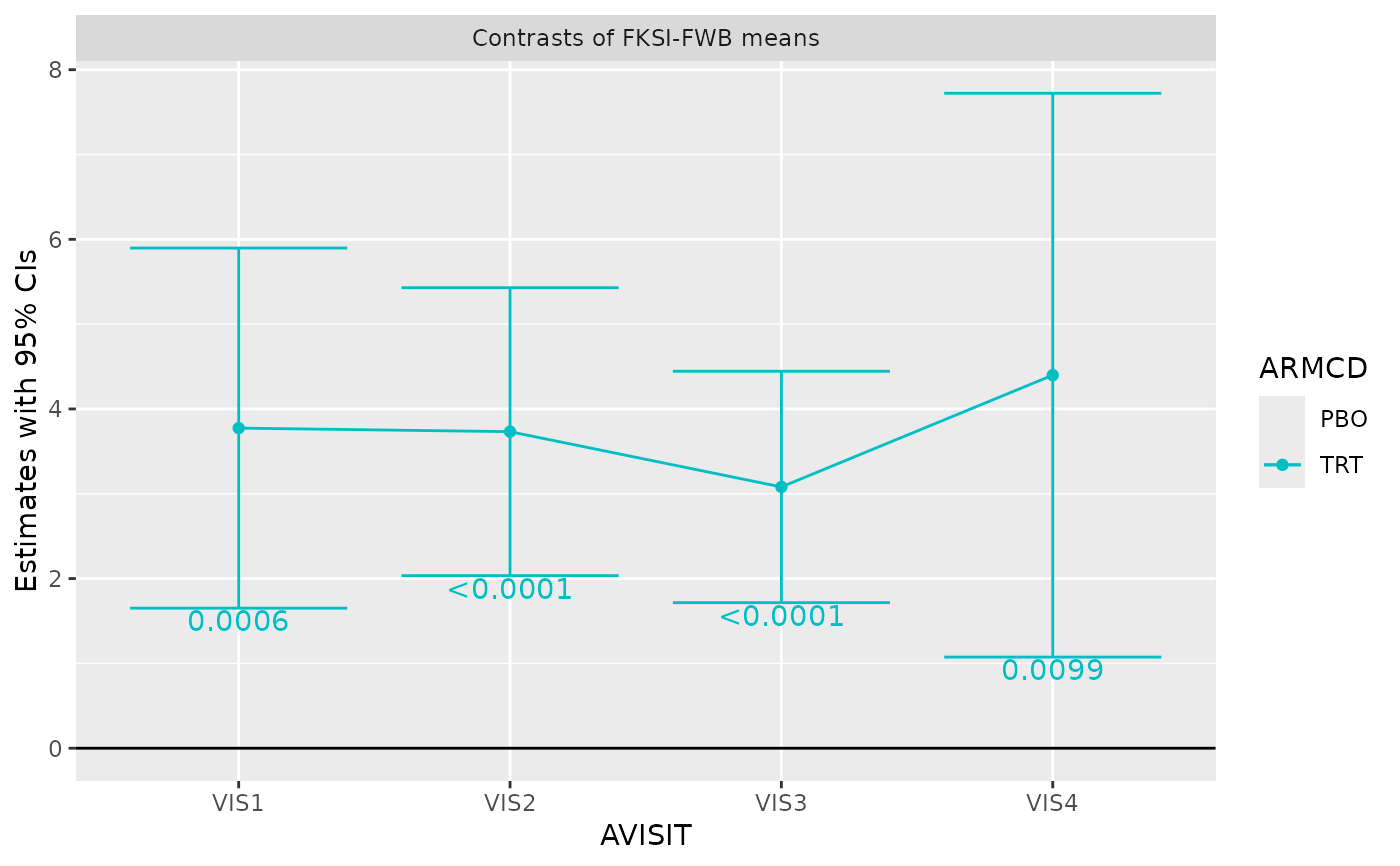
 g_mmrm_lsmeans(
mmrm_results,
select = "contrasts",
titles = c(contrasts = "Contrasts of FKSI-FWB means"),
show_pval = TRUE,
show_lines = TRUE,
width = 0.8
)
#> Coordinate system already present. Adding new coordinate system, which will
#> replace the existing one.
 mmrm_test_data2 <- mmrm_test_data %>%
filter(ARMCD == "TRT")
mmrm_results_no_arm <- fit_mmrm(
vars = list(
response = "FEV1",
covariates = c("RACE", "SEX"),
id = "USUBJID",
visit = "AVISIT"
),
data = mmrm_test_data2,
cor_struct = "unstructured",
weights_emmeans = "equal"
)
g_mmrm_lsmeans(mmrm_results_no_arm, select = "estimates")
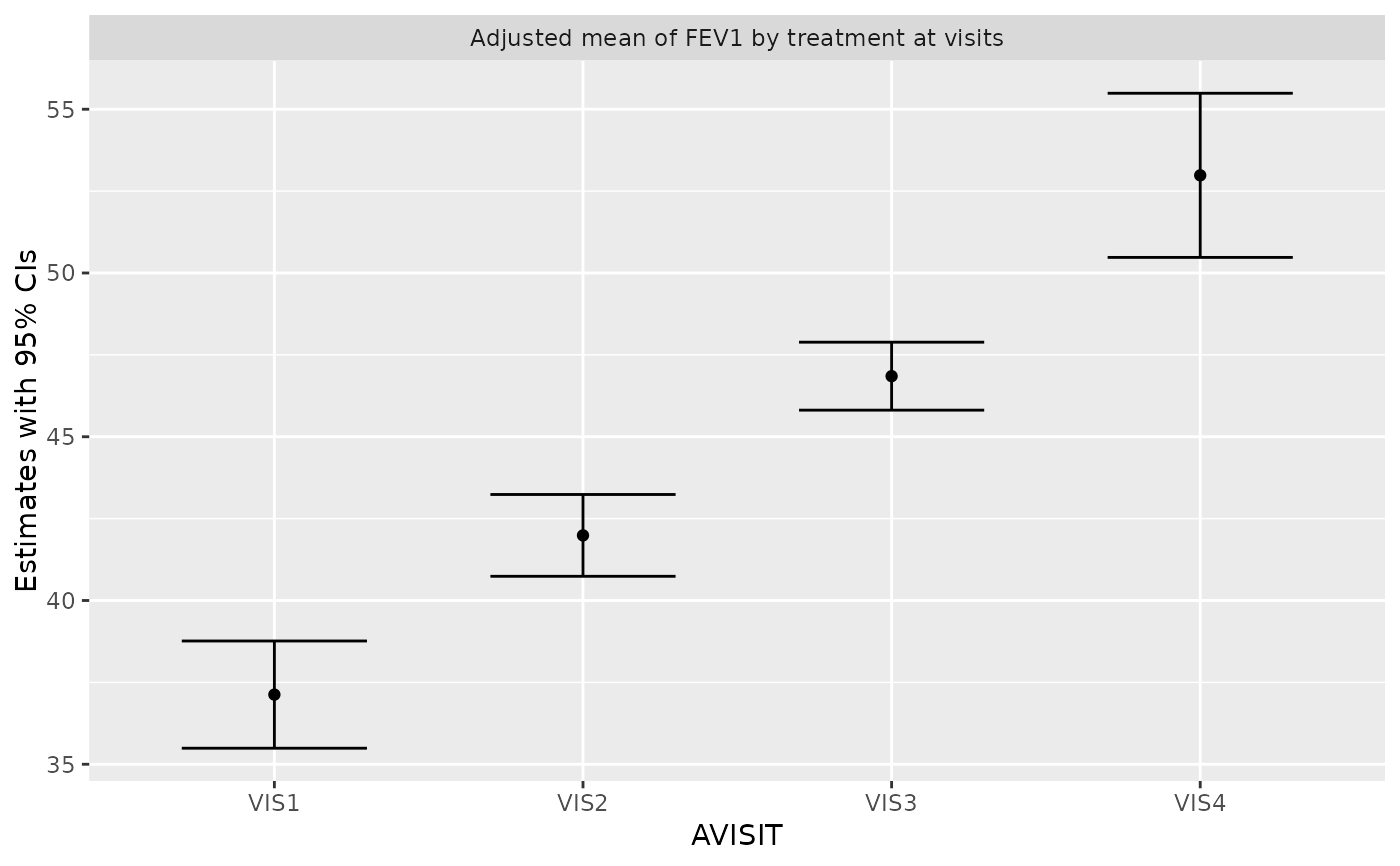 g_mmrm_lsmeans(
mmrm_results_no_arm,
select = c("estimates", "contrasts"),
titles = c(
estimates = "Adjusted mean of FKSI-FWB",
contrasts = "it will not be created"
),
show_pval = TRUE,
width = 0.8
)
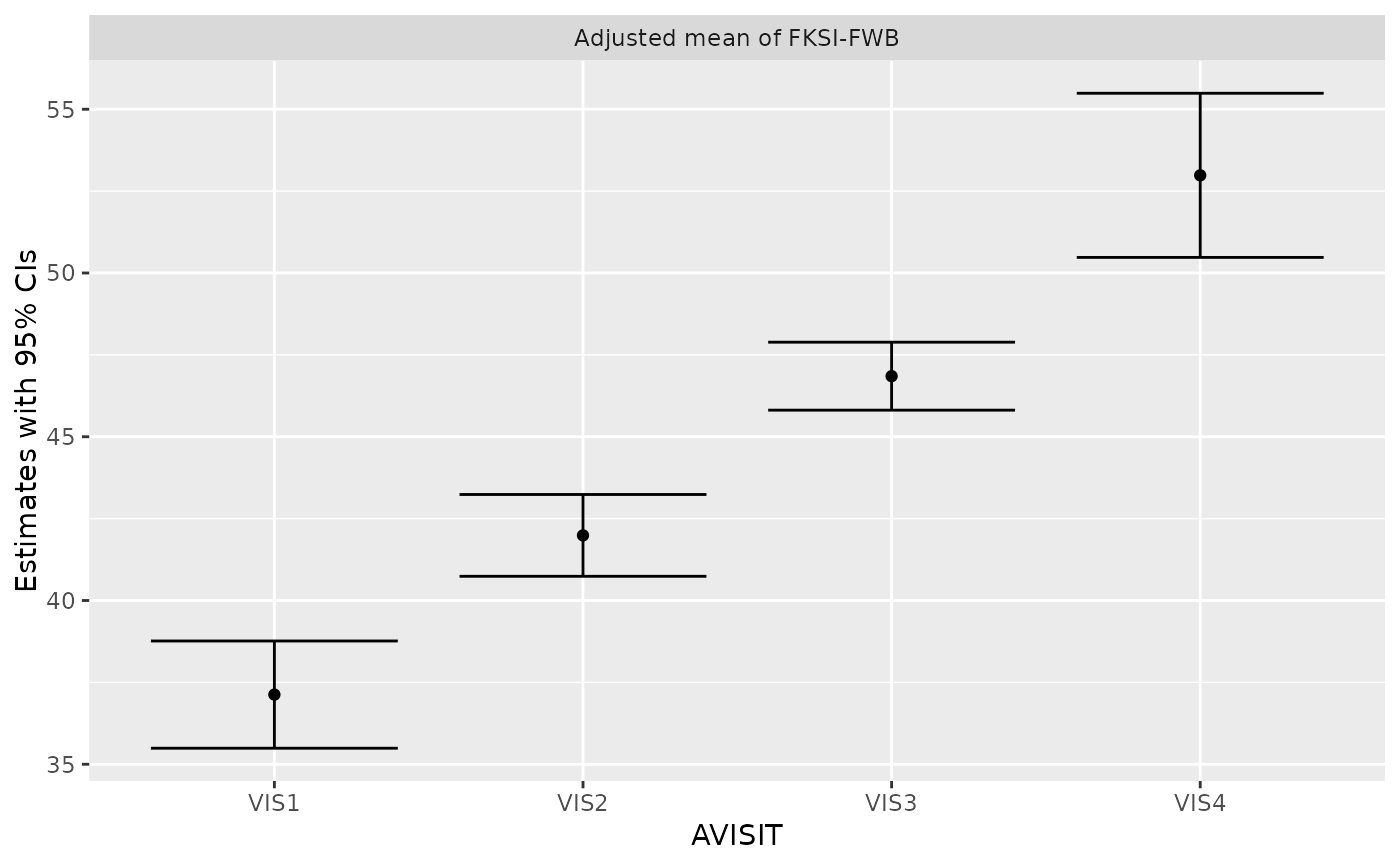 g_mmrm_lsmeans(
mmrm_results_no_arm,
select = "estimates",
titles = c(estimates = "Adjusted mean of FKSI-FWB"),
show_pval = TRUE,
width = 0.8,
show_lines = TRUE
)
#> `geom_line()`: Each group consists of only one observation.
#> ℹ Do you need to adjust the group aesthetic?
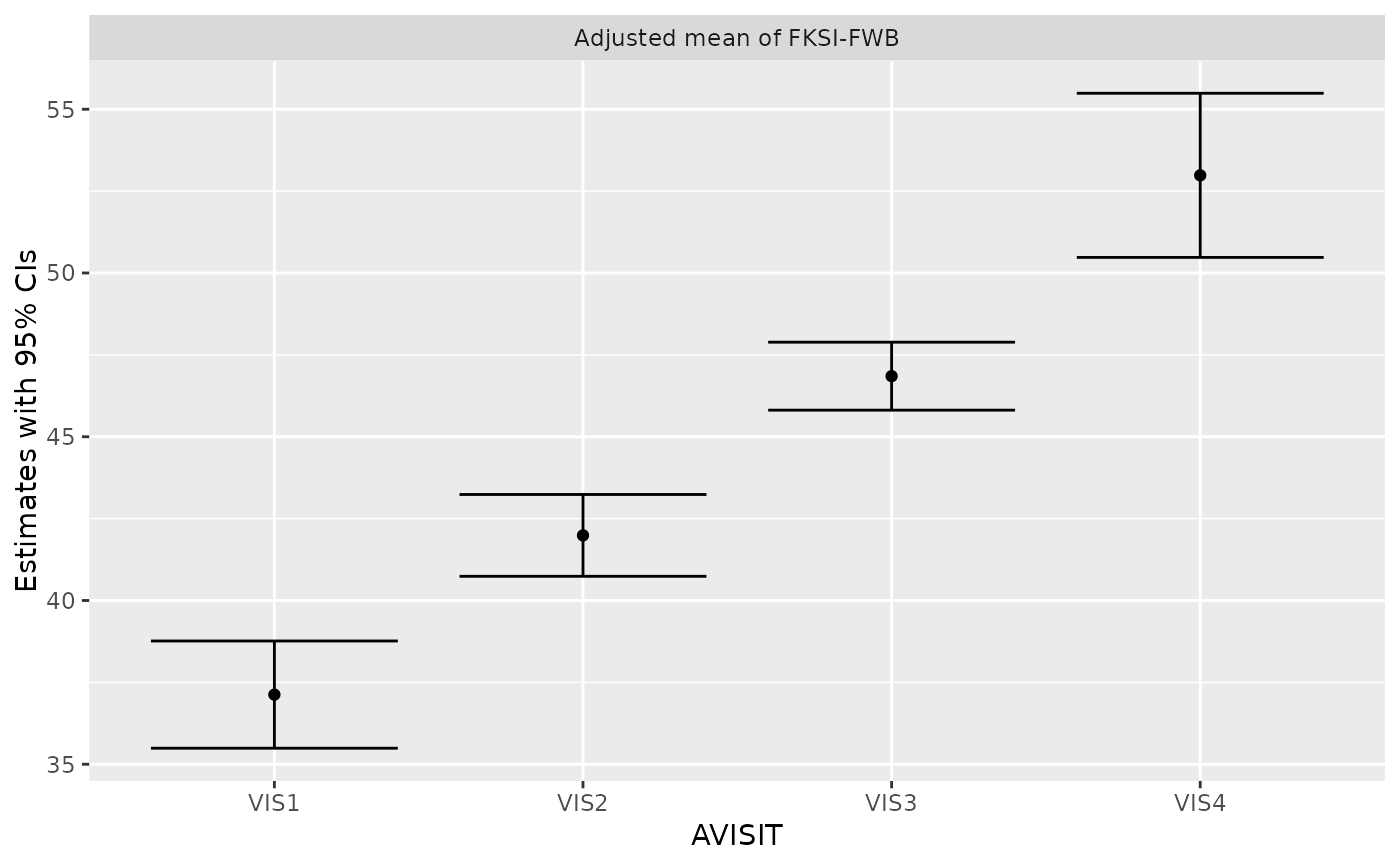 g_mmrm_lsmeans(
mmrm_results,
select = "estimates",
titles = c(estimates = "Adjusted mean of FKSI-FWB"),
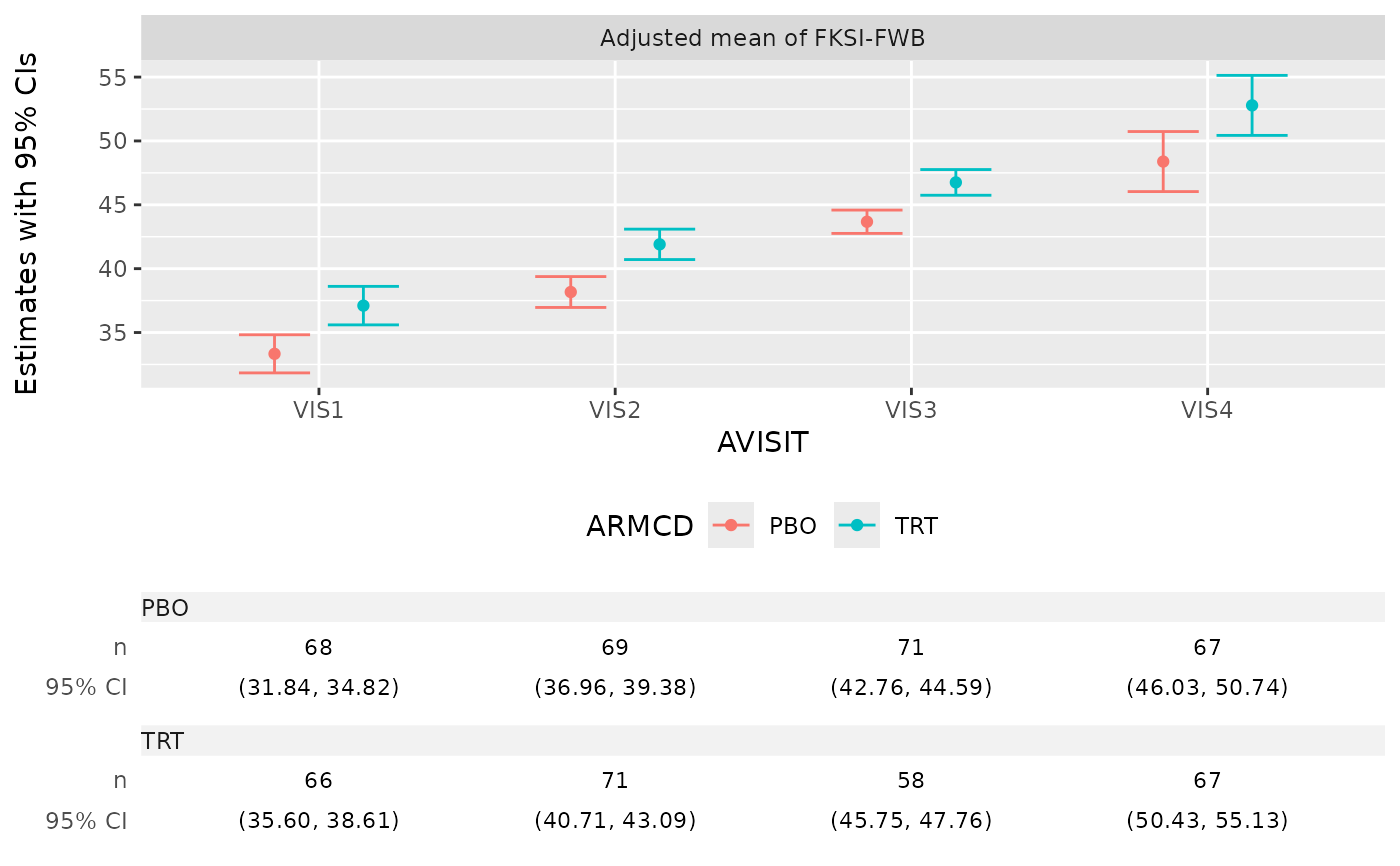
table_stats = c("n", "ci")
)
