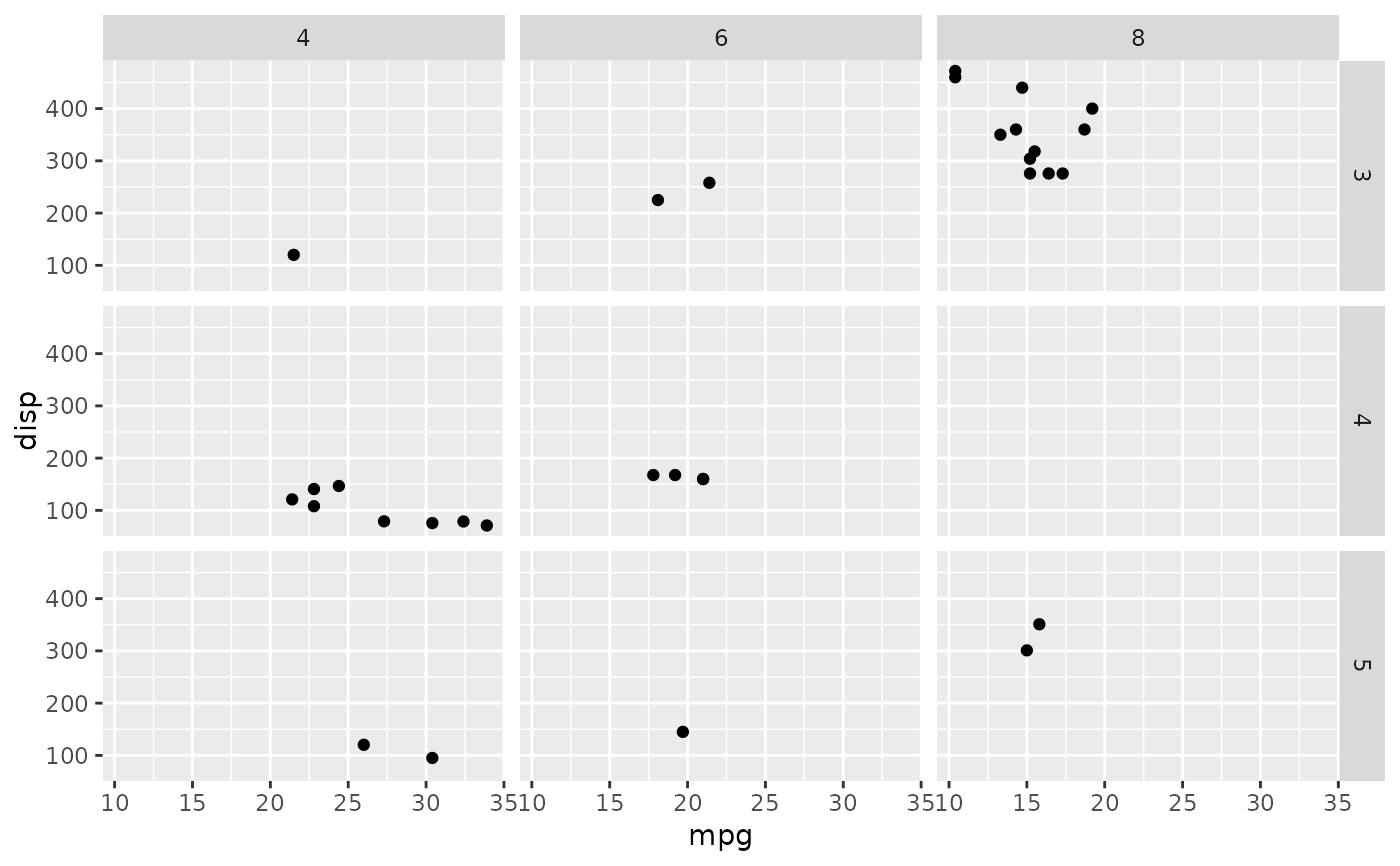
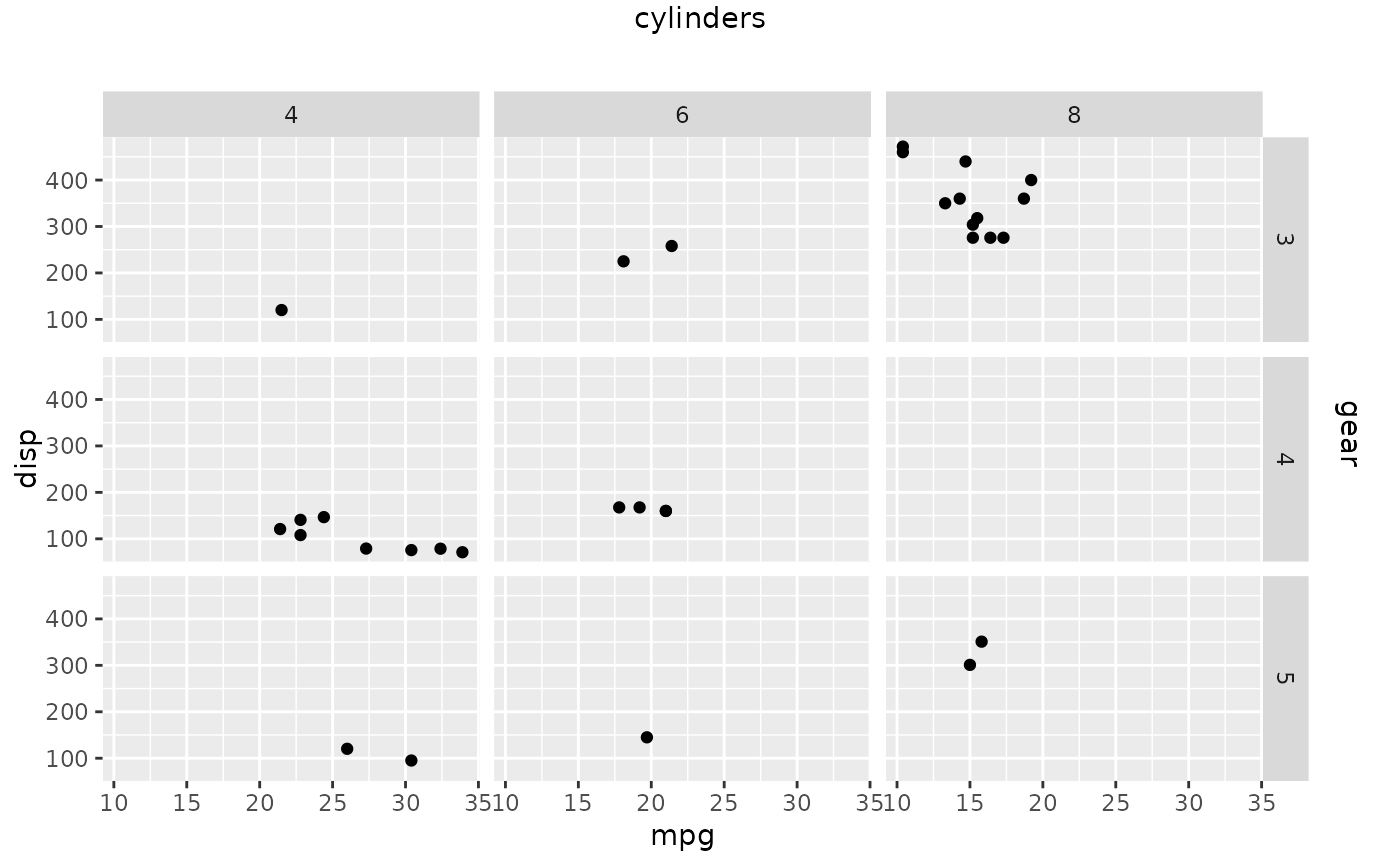
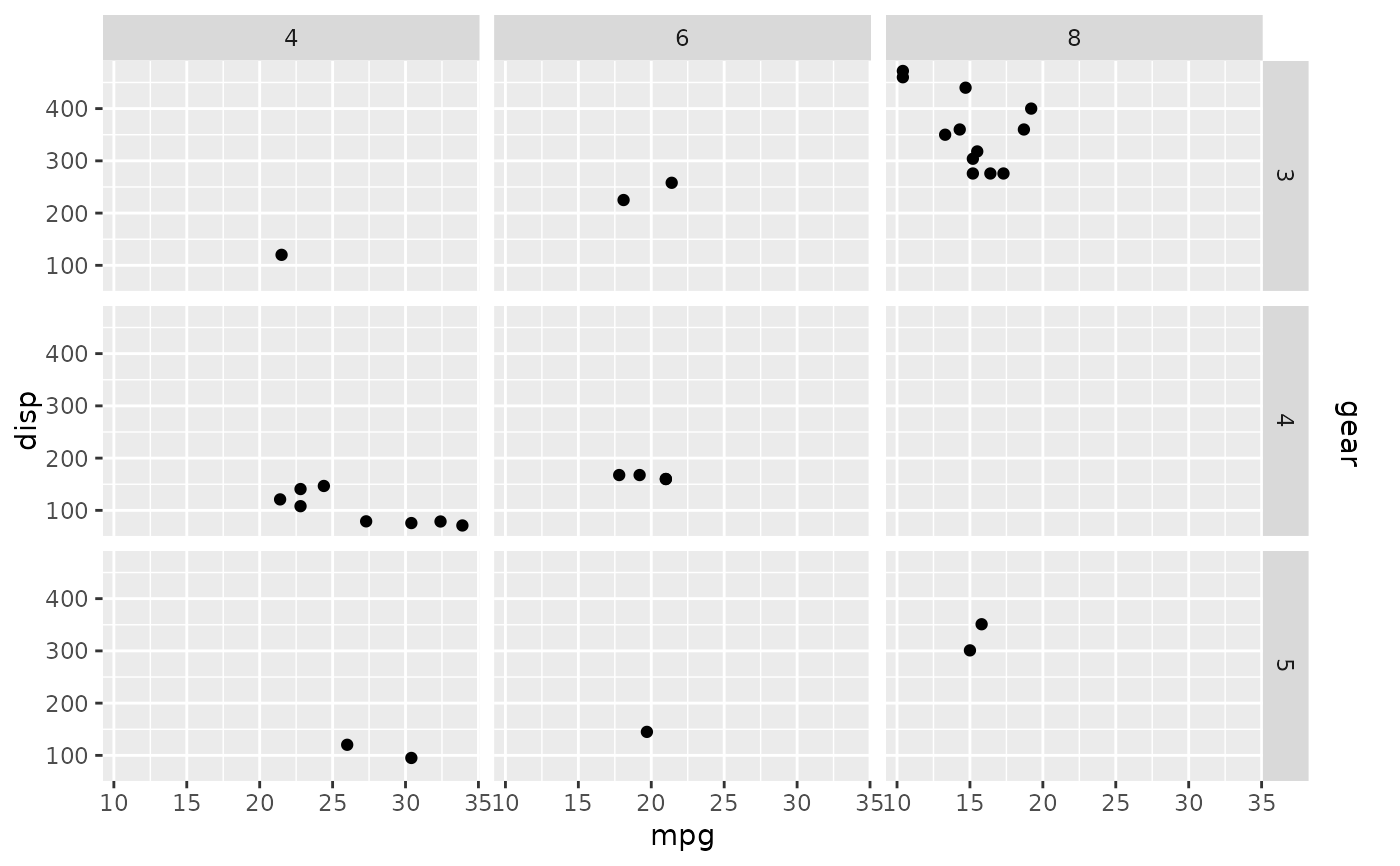
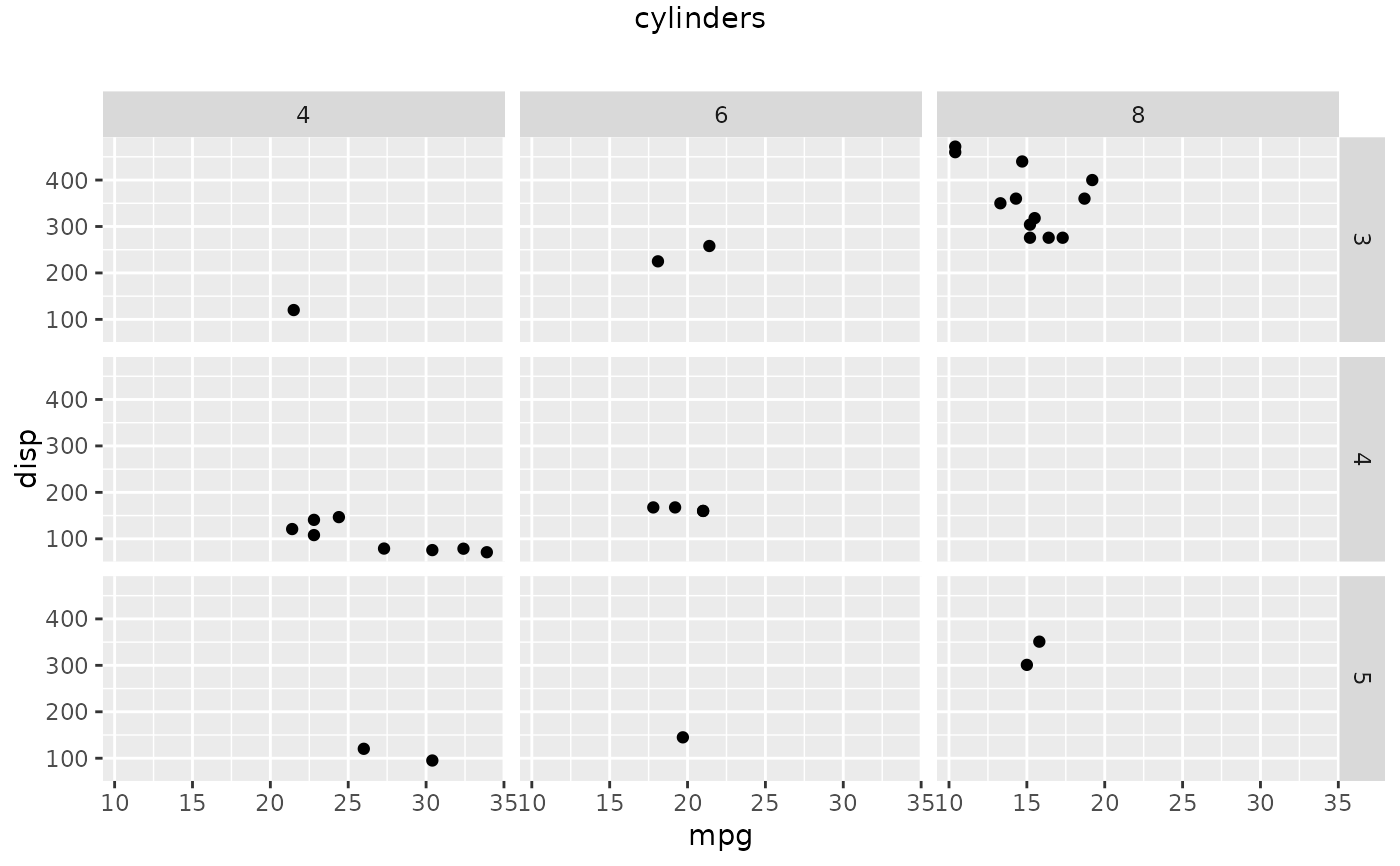
Enhances a ggplot2 plot by adding labels that describe
the faceting variables along the x and y axes.
Examples
library(ggplot2)
library(grid)
p <- ggplot(mtcars) +
aes(x = mpg, y = disp) +
geom_point() +
facet_grid(gear ~ cyl)
xfacet_label <- "cylinders"
yfacet_label <- "gear"
res <- add_facet_labels(p, xfacet_label, yfacet_label)
grid.newpage()
grid.draw(res)
 grid.newpage()
grid.draw(add_facet_labels(p, xfacet_label = NULL, yfacet_label))
grid.newpage()
grid.draw(add_facet_labels(p, xfacet_label = NULL, yfacet_label))
 grid.newpage()
grid.draw(add_facet_labels(p, xfacet_label, yfacet_label = NULL))
grid.newpage()
grid.draw(add_facet_labels(p, xfacet_label, yfacet_label = NULL))
 grid.newpage()
grid.draw(add_facet_labels(p, xfacet_label = NULL, yfacet_label = NULL))
grid.newpage()
grid.draw(add_facet_labels(p, xfacet_label = NULL, yfacet_label = NULL))