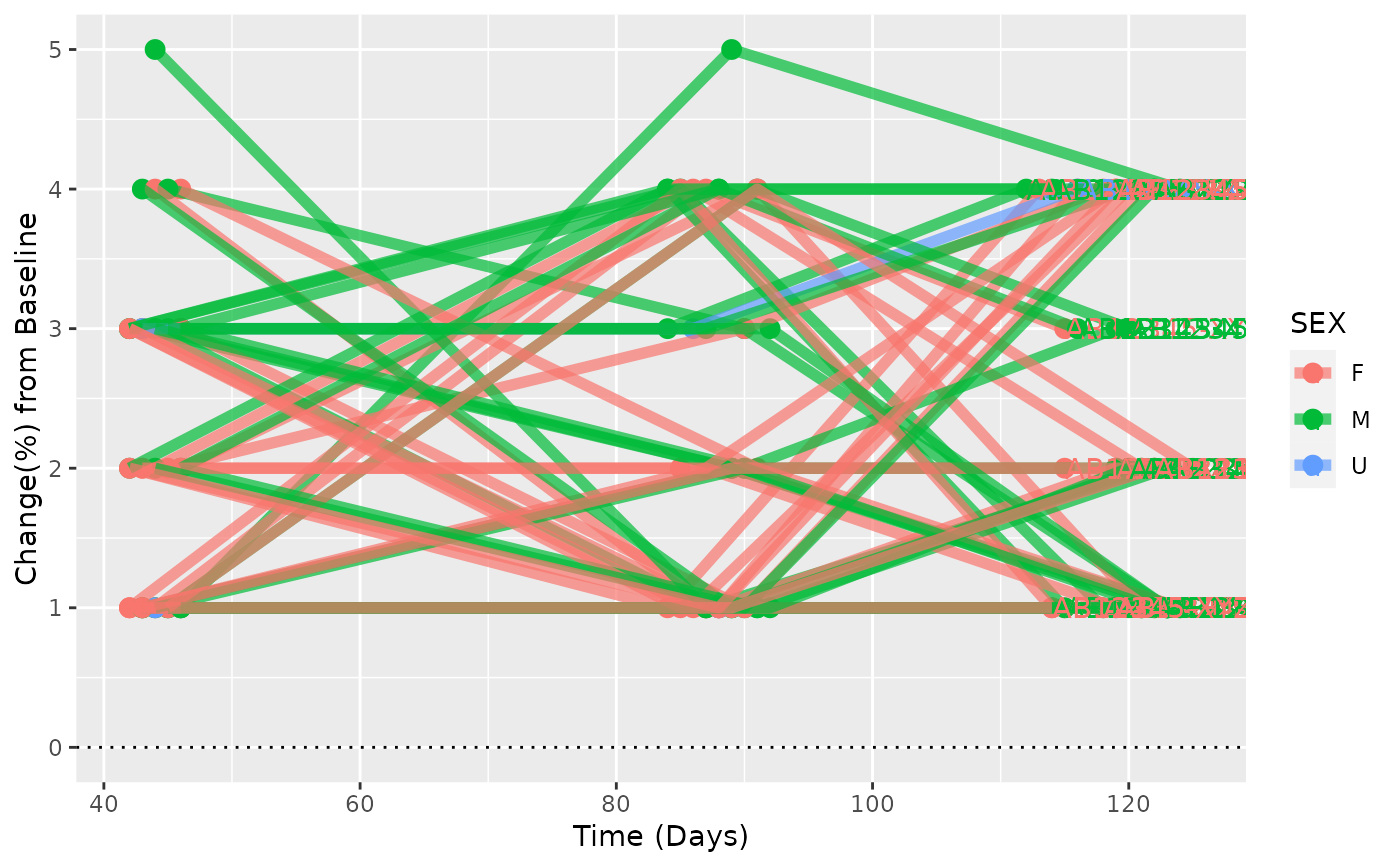
Description of this plot
Usage
spiderplot_simple(
  anl,
  byvar = "USUBJID",
  days = "TRTDURD",
  mes_value = "PARAM",
  group_col = "USUBJID",
  baseday = 0
)
Arguments
- anl
The analysis data frame (e.g. ATE.sas7bdat on BCE)
- byvar
Analysis dataset
- days
Variable with time in days
- mes_value
Variable with measurement
- group_col
Variable to color the individual lines and id in plot
- baseday
Numeric Value, pts with only smaller values will be cut out
Examples
library(dplyr)

ADSL <- rADSL
ADRS <- rADRS
ANL <- left_join(ADSL, ADRS)
#> Joining, by = c("SUBJID", "STUDYID", "SITEID", "USUBJID", "AGE", "SEX",
#> "ARMCD", "COUNTRY", "RACE", "STRATA1", "STRATA2", "BMK1", "BMK2", "SAFFL",
#> "EOSSTT", "ARM", "ACTARM", "ACTARMCD", "AGEGR1", "TRTDURD", "EOSDY", "DCSREAS",
#> "DCSREASP", "DCSREAS_GRP", "DTHFL", "DTHCAUS", "AEWITHFL")

ANL %>%
  dplyr::filter(PARAMCD == "OVRINV") %>%
  spiderplot_simple(group_col = "SEX", days = "ADY", mes_value = "AVAL")
