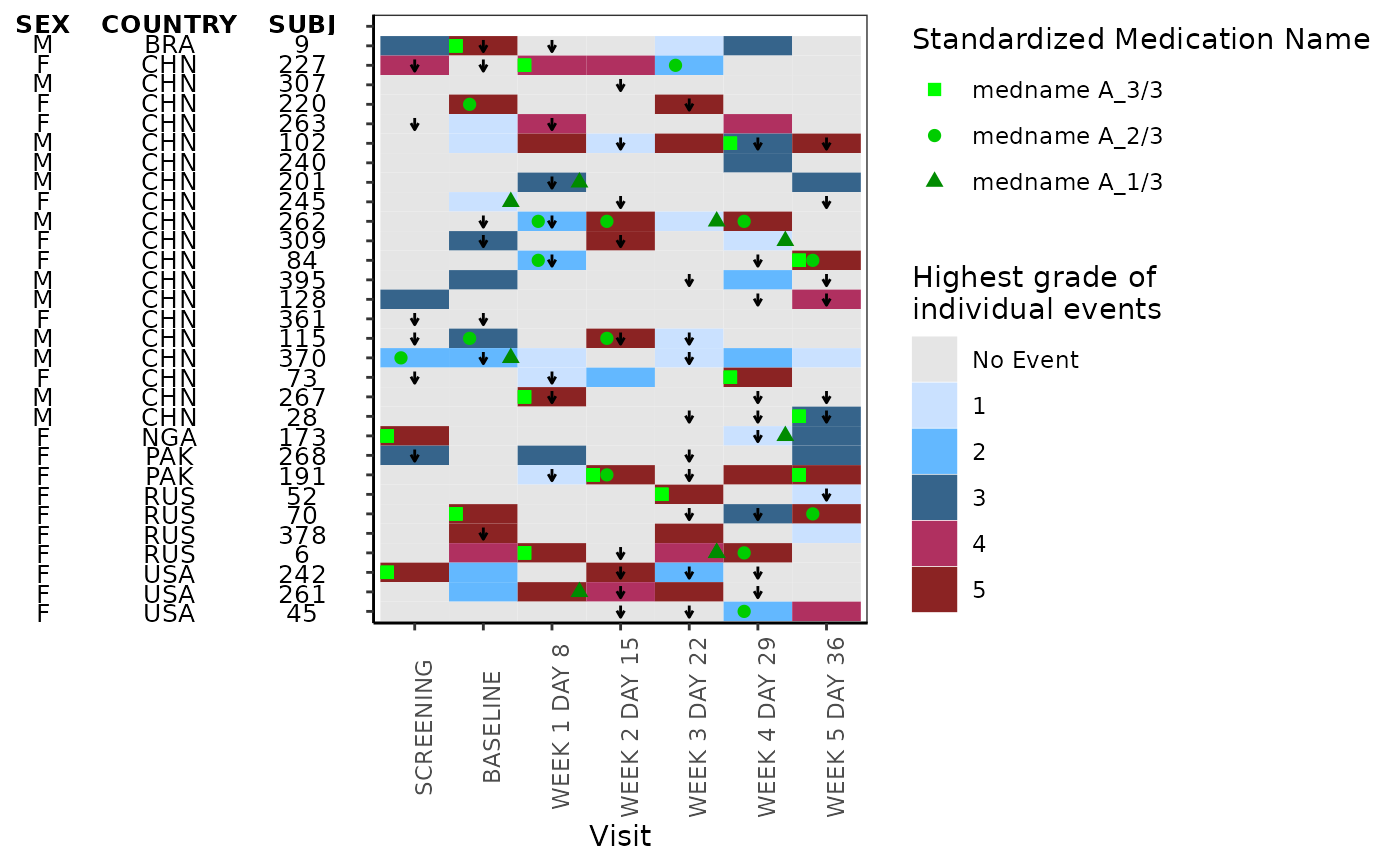
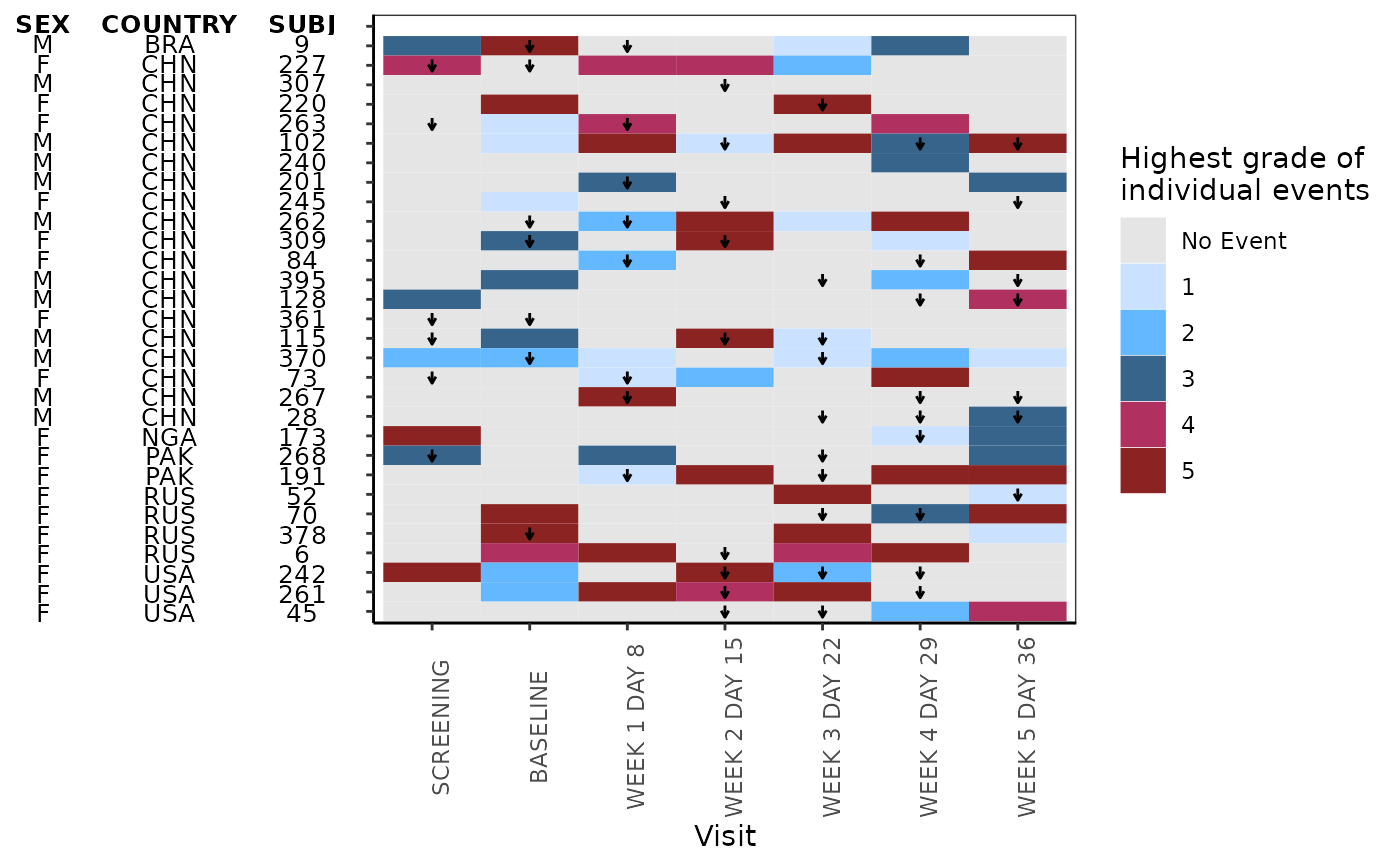
This function plots heatmap
Usage
g_heat_bygrade(
  id_var,
  exp_data,
  visit_var,
  ongo_var,
  anno_data,
  anno_var,
  heat_data,
  heat_color_var,
  heat_color_opt = NULL,
  conmed_data = NULL,
  conmed_var = NULL,
  conmed_color_opt = NULL,
  xlab = "Visit",
  title = NULL
)
Arguments
- id_var
(
character)
name of the column that contains the unique subject identifier shared by all data Usually it is"USUBJID".- exp_data
(
data.frame)
exposure data. Usually it isADEX.- visit_var
(
character)
name of the column that contains the analysis visit. Usually it is"AVISIT"- ongo_var
(
character)
name of the column inexp_datathat contains the logical variable indicating whether the treatment is still ongoing. Usually it can be derived fromEOSSTT- anno_data
(
data.frame)
annotation data that contains subject level characteristics. Usually it isADSL- anno_var
(
character) a vector of columns name(s) to include for the annotation- heat_data
(
data.frame)
data frame that contains the information needed for the text over heatmap Usually it isADCM.- heat_color_var
(
character)
name of the column that contains the heat grade- heat_color_opt
optional, (
character)
a named vector that maps the names to heat colors- conmed_data
optional, (
data.frame)
concomitant medicine data. Usually it isADCMdefault isNULL(no conmed plotted)- conmed_var
optional, (
character)
concomitant medicine variable name. Must be a column name in conmed_data when conmed_data is provided. default isNULL(no conmed plotted)- conmed_color_opt
optional, (
character)
vector of color name(s) to conmed_data- xlab
optional, (
character)
string to be shown as x-axis label, default is"Visit"- title
(
character)
string to be shown as title of the plot. default isNULL(no plot title is displayed)
Examples
library(scda)
library(dplyr)
ADSL <- synthetic_cdisc_data("latest")$adsl %>% slice(1:30)
ADEX <- synthetic_cdisc_data("latest")$adex %>% filter(USUBJID %in% ADSL$USUBJID)
ADAE <- synthetic_cdisc_data("latest")$adae %>% filter(USUBJID %in% ADSL$USUBJID)
ADCM <- synthetic_cdisc_data("latest")$adcm %>% filter(USUBJID %in% ADSL$USUBJID)
# function to derive AVISIT from ADEX
add_visit <- function(data_need_visit) {
  visit_dates <- ADEX %>%
    filter(PARAMCD == "DOSE") %>%
    distinct(USUBJID, AVISIT, ASTDTM) %>%
    group_by(USUBJID) %>%
    arrange(ASTDTM) %>%
    mutate(next_vis = lead(ASTDTM), is_last = ifelse(is.na(next_vis), TRUE, FALSE)) %>%
    rename(this_vis = ASTDTM)
  data_visit <- data_need_visit %>%
    select(USUBJID, ASTDTM) %>%
    left_join(visit_dates, by = "USUBJID") %>%
    filter(ASTDTM > this_vis & (ASTDTM < next_vis | is_last == TRUE)) %>%
    left_join(data_need_visit)
  return(data_visit)
}
# add AVISIT in ADAE and ADCM
ADAE <- add_visit(ADAE)
#> Joining, by = c("USUBJID", "ASTDTM")
ADCM <- add_visit(ADCM)
#> Joining, by = c("USUBJID", "ASTDTM")
exp_data <- ADEX %>%
  filter(PARCAT1 == "INDIVIDUAL") %>%
  group_by(USUBJID) %>%
  # create a shorter subject identifier
  mutate(SUBJ = utils::tail(strsplit(USUBJID, "-")[[1]], n = 1)) %>%
  mutate(ongo_var = (EOSSTT == "ONGOING")) %>%
  ungroup()
anno_data <- ADSL %>%
  select(SEX, COUNTRY, USUBJID) %>%
  group_by(USUBJID) %>%
  mutate(SUBJ = utils::tail(strsplit(USUBJID, "-")[[1]], n = 1)) %>%
  ungroup() %>%
  select(-USUBJID)
heat_data <- ADAE %>%
  select(USUBJID, AVISIT, AETOXGR) %>%
  group_by(USUBJID) %>%
  mutate(SUBJ = utils::tail(strsplit(USUBJID, "-")[[1]], n = 1)) %>%
  ungroup() %>%
  select(-USUBJID)
heat_color_opt <- c(
  "No Event" = "gray90",
  "1" = "lightsteelblue1",
  "2" = "steelblue1",
  "3" = "steelblue4",
  "4" = "maroon",
  "5" = "brown4"
)
cmdecod_label <- attr(ADCM[["CMDECOD"]], "label")
ADCM <- ADCM %>%
  filter(
    CMDECOD == "medname A_1/3" | CMDECOD == "medname A_2/3" | CMDECOD == "medname A_3/3"
  ) %>%
  mutate(CMDECOD = factor(CMDECOD, levels = unique(CMDECOD)))
attr(ADCM[["CMDECOD"]], "label") <- cmdecod_label
conmed_data <- ADCM %>%
  group_by(USUBJID) %>%
  mutate(SUBJ = utils::tail(strsplit(USUBJID, "-")[[1]], n = 1))
# example plotting conmed
g_heat_bygrade(
  id_var = "SUBJ",
  exp_data,
  visit_var = "AVISIT",
  ongo_var = "ongo_var",
  anno_data,
  anno_var = c("SEX", "COUNTRY"),
  heat_data,
  heat_color_var = "AETOXGR",
  heat_color_opt,
  conmed_data,
  conmed_var = "CMDECOD",
  conmed_color_opt = c("green", "green3", "green4")
)

# example not plotting conmed
g_heat_bygrade(
  id_var = "SUBJ",
  exp_data,
  visit_var = "AVISIT",
  ongo_var = "ongo_var",
  anno_data,
  anno_var = c("SEX", "COUNTRY"),
  heat_data,
  heat_color_var = "AETOXGR",
  heat_color_opt
)
