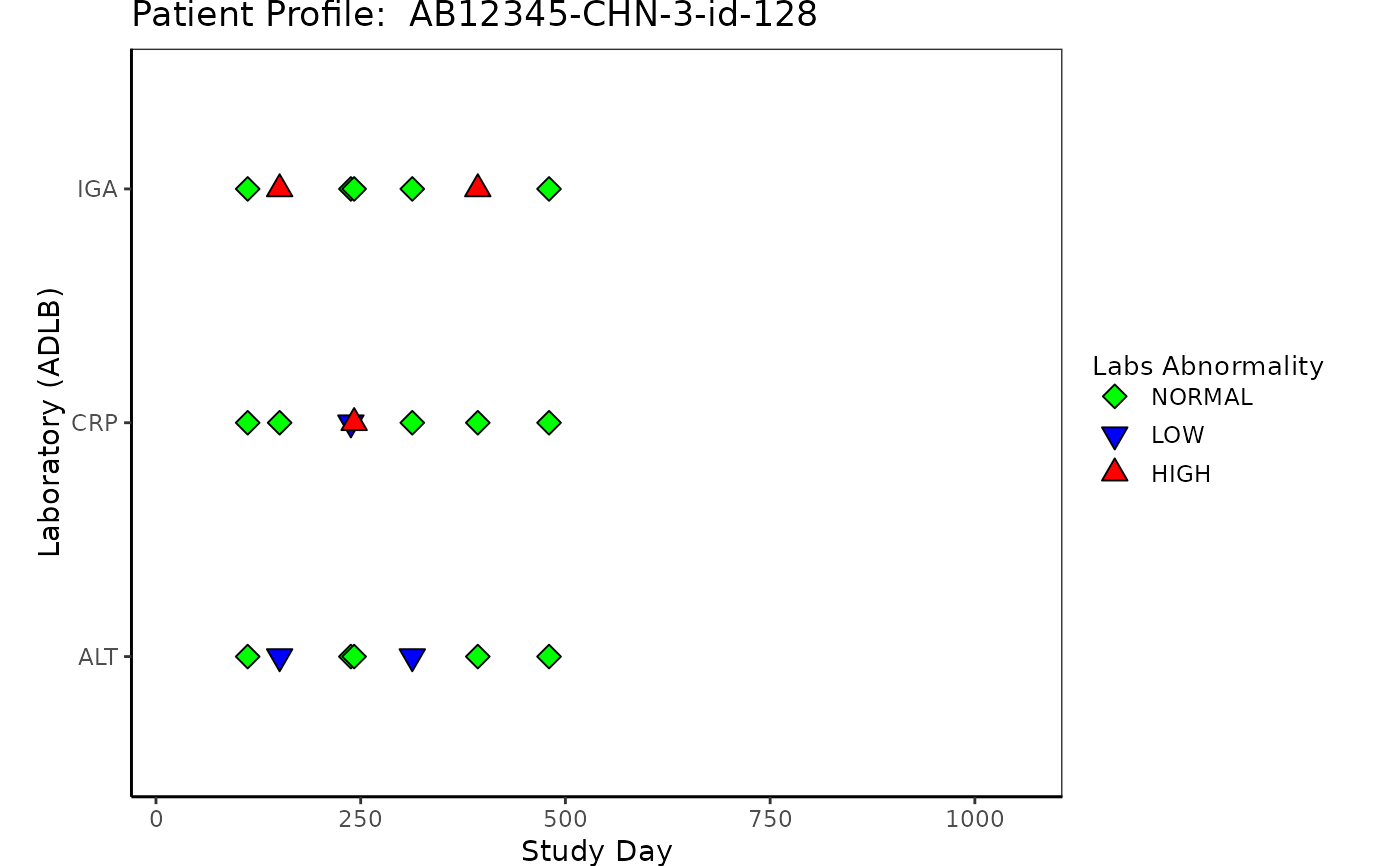
Patient domain profile provides information for a specific subject that participated in the study.
The plot includes relevant data for one subject in a user specified domain, including
adverse events (ADAE), response (ADRS), concomitant medications
(ADCM), exposure (ADEX), and laboratory (ADLB).
Usage
patient_domain_profile(
  domain = NULL,
  var_names,
  marker_pos,
  arrow_end,
  xtick_at = waiver(),
  line_col_list = NULL,
  line_width = 1,
  arrow_size = 0.1,
  no_enddate_extention = 0,
  marker_col_list = NULL,
  marker_shape_list = NULL,
  show_days_label = TRUE,
  xlim = c(-28, max(marker_pos) + 5),
  xlab = NULL,
  show_title = TRUE,
  title = NULL
)
Arguments
- domain
string of domain name to be shown as y-axis label, default is
NULL(no y-axis label shown)- var_names
character vector to identify each lane
- marker_pos
-
Depending on the domain, this can be
marker position numeric vector for domains
ADEX,ADLB, andADRSnumeric data frame with two columns, start and end time marker position, for domains
ADAEandADCM
- arrow_end
numeric value indicates the end of arrow when arrows are requested
- xtick_at
numeric vector with the locations of the x-axis tick marks
- line_col_list
-
a list may contain
line_col: factor vector to specify color for segments , default isNULL(no line color is specified)line_col_optaesthetic values to map color values (named vector to map color values to each name). If notNULL, please make sure this contains all possible values forline_colvalues, otherwise color will be assigned byhcl.colorsline_col_legend: a string to be displayed as line color legend title whenline_colis specified, default isNULL(no legend title is displayed)
- line_width
numeric value for segment width, default is
line_width = 1- arrow_size
numeric value for arrow size, default is
arrow_size = 0.1- no_enddate_extention
numeric value for extending the arrow when end date is missing for
ADAEorADCMdomain. Default isno_enddate_extention = 0.- marker_col_list
-
a list may contain
marker_cola factor vector to specify color for markers, default isNULL(no color markers is specified)marker_col_optaesthetic values to map color values (named vector to map color values to each name) If notNULL, please make sure this contains all possible values formarker_colvalues, otherwise color will be assigned byhcl.colorsmarker_col_legenda string to be displayed as marker color legend title, default isNULL(no legend title is displayed)
- marker_shape_list
-
a list may contain
marker_shapefactor vector to specify shape for markers, default isNULL(no shape marker is specified)marker_shape_optaesthetic values to map shape values (named vector to map shape values to each name). If notNULL, please make sure this contains all possible values formarker_shapevalues, otherwise shape will be assigned byggplotdefaultmarker_shape_legendstring to be displayed as marker shape legend title, default isNULL(no legend title is displayed)
- show_days_label
boolean value for showing y-axis label, default is
TRUE- xlim
numeric vector for x-axis limit, default is
xlim = c(-28, max(marker_pos) + 5)- xlab
string to be shown as x-axis label, default is
"Study Day"- show_title
boolean value for showing title of the plot, default is
TRUE- title
string to be shown as title of the plot, default is
NULL(no plot title is displayed)
Author
Xuefeng Hou (houx14) houx14@gene.com
Tina Cho (chot) tina.cho@roche.com
Molly He (hey59) hey59@gene.com
Ting Qi (qit3) qit3@gene.com
Examples
library(dplyr)
# ADSL
ADSL <- osprey::rADSL %>%
filter(USUBJID == rADSL$USUBJID[1]) %>%
mutate(
TRTSDT = as.Date(TRTSDTM),
max_date = max(as.Date(LSTALVDT), as.Date(DTHDT), na.rm = TRUE),
max_day = as.numeric(as.Date(max_date) - as.Date(TRTSDT)) + 1
) %>%
select(USUBJID, STUDYID, TRTSDT, max_day)
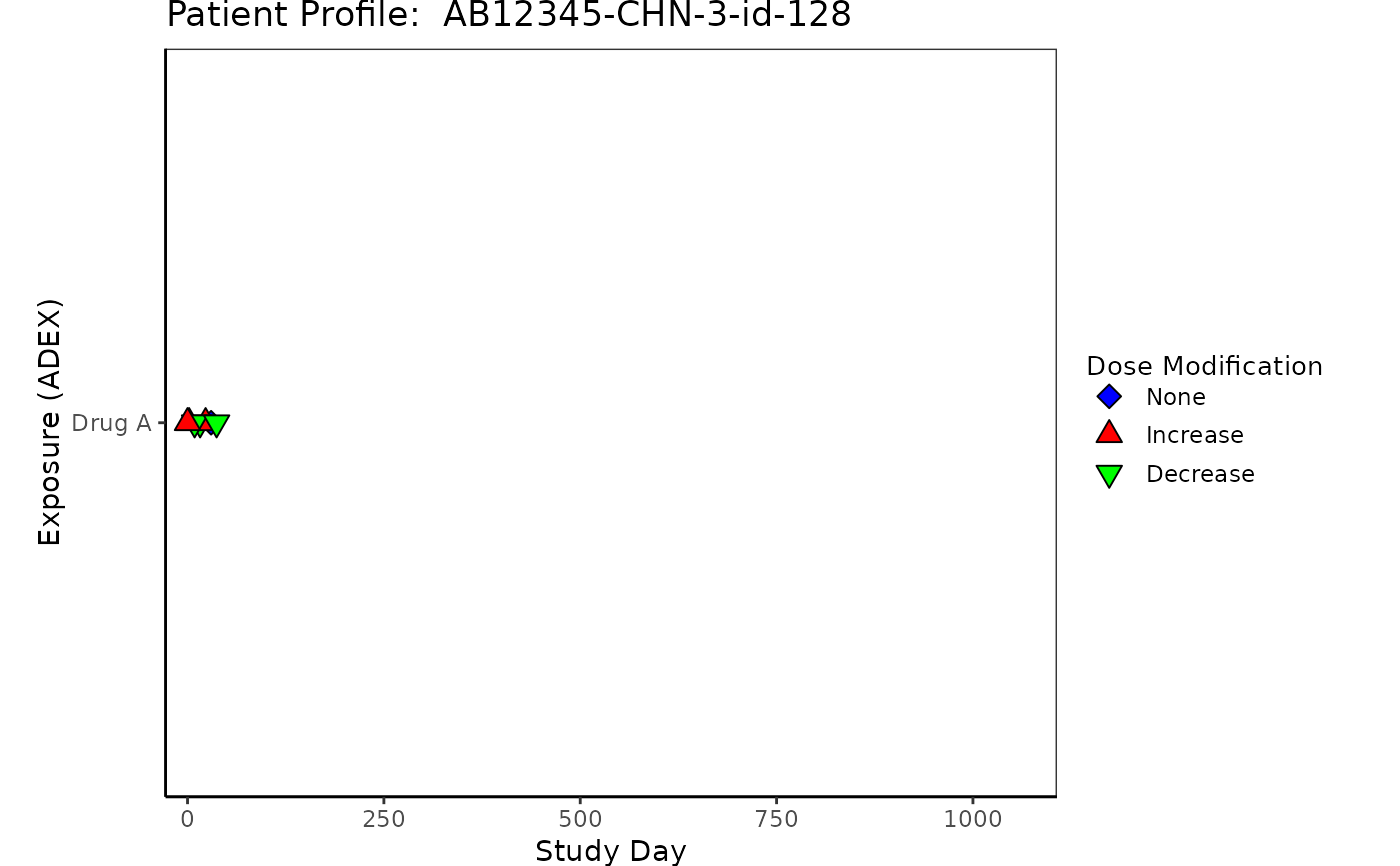
# Example 1 Exposure "ADEX"
ADEX <- osprey::rADEX %>%
select(USUBJID, STUDYID, ASTDTM, PARCAT2, AVAL, AVALU, PARAMCD)
ADEX <- left_join(ADSL, ADEX, by = c("USUBJID", "STUDYID"))
ADEX <- ADEX %>%
filter(PARAMCD == "DOSE") %>%
arrange(PARCAT2, PARAMCD) %>%
mutate(diff = c(0, diff(AVAL, lag = 1))) %>%
mutate(
Modification = case_when(
diff < 0 ~ "Decrease",
diff > 0 ~ "Increase",
diff == 0 ~ "None"
)
) %>%
mutate(
ASTDT_dur = as.numeric(
as.Date(
substr(as.character(ASTDTM), 1, 10)
) - as.Date(TRTSDT) + 1
)
)
p1 <- patient_domain_profile(
domain = "Exposure (ADEX)",
var_names = ADEX$PARCAT2,
marker_pos = ADEX$ASTDT_dur,
arrow_end = ADSL$max_day,
xtick_at = waiver(),
line_col_list = NULL,
line_width = 1,
arrow_size = 0.1,
no_enddate_extention = 0,
marker_col_list = list(
marker_col = factor(ADEX$Modification),
marker_col_opt = c("Increase" = "red", "Decrease" = "green", "None" = "blue"),
marker_col_legend = NULL
),
marker_shape_list = list(
marker_shape = factor(ADEX$Modification),
marker_shape_opt = c("Increase" = 24, "Decrease" = 25, "None" = 23),
marker_shape_legend = "Dose Modification"
),
show_days_label = TRUE,
xlim = c(-28, ADSL$max_day),
xlab = "Study Day",
title = paste("Patient Profile: ", ADSL$USUBJID)
)
p1
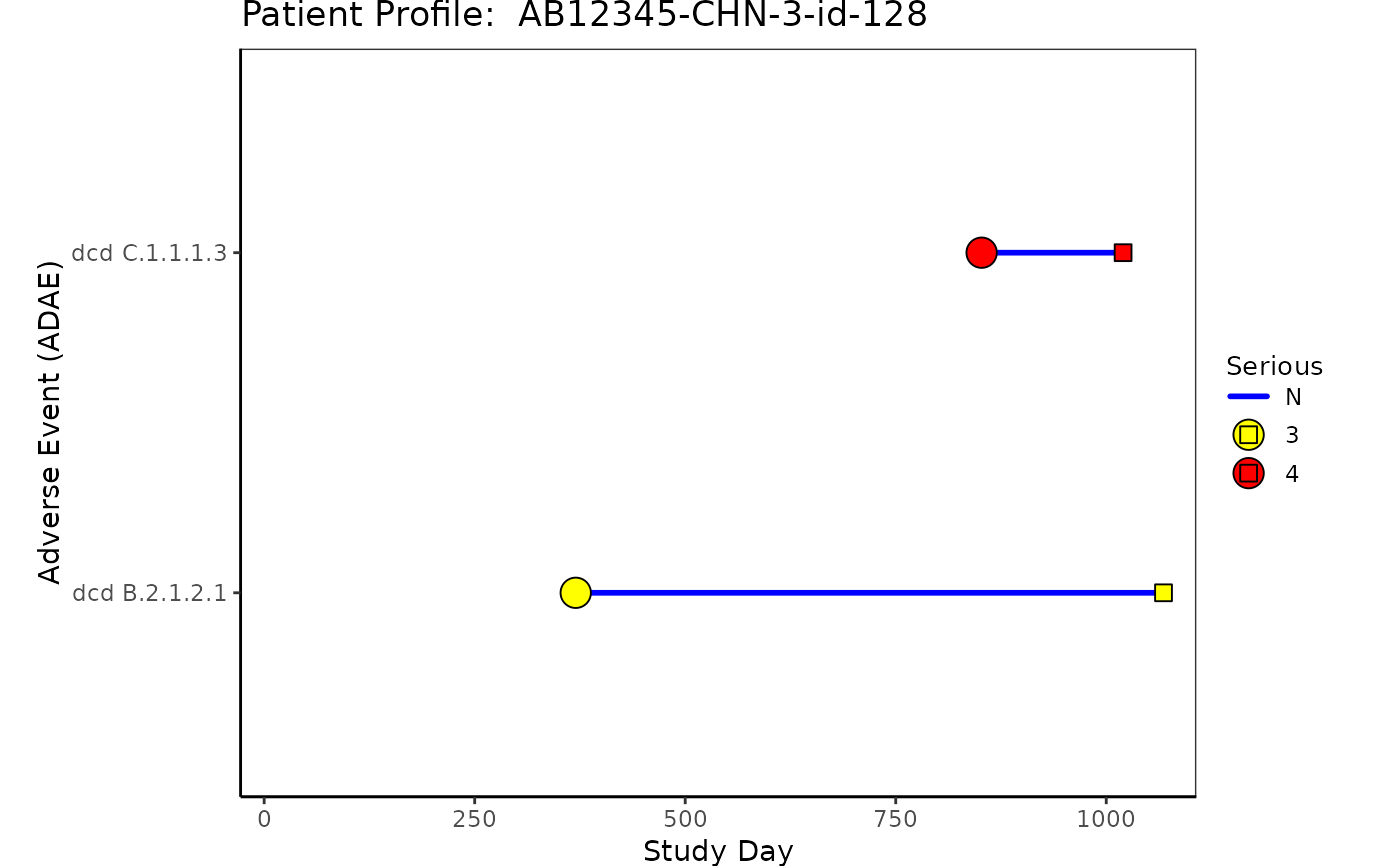
 # Example 2 Adverse Event "ADAE"
# Note that ASTDY is represented by a circle and AENDY is represented by a square.
# If AENDY and ASTDY occur on the same day only AENDY will be shown.
# Adverse Event ADAE
ADAE <- osprey::rADAE %>%
select(USUBJID, STUDYID, AESOC, AEDECOD, AESER, AETOXGR, AEREL, ASTDY, AENDY)
ADAE <- left_join(ADSL, ADAE, by = c("USUBJID", "STUDYID"))
p2 <- patient_domain_profile(
domain = "Adverse Event (ADAE)",
var_names = ADAE$AEDECOD,
marker_pos = ADAE[, c("ASTDY", "AENDY")],
arrow_end = ADSL$max_day,
xtick_at = waiver(),
line_col_list = list(
line_col = ADAE$AESER,
line_col_legend = "Serious",
line_col_opt = c("blue", "green")
),
line_width = 1,
arrow_size = 0.1,
no_enddate_extention = 0,
marker_col_list = list(
marker_col = factor(ADAE$AETOXGR),
marker_col_opt = c("3" = "yellow", "4" = "red"),
marker_col_legend = NULL
),
marker_shape_list = list(
marker_shape = NULL,
marker_shape_opt = NULL,
marker_shape_legend = "Grade"
),
show_days_label = TRUE,
xlim = c(-28, ADSL$max_day),
xlab = "Study Day",
title = paste("Patient Profile: ", ADSL$USUBJID)
)
p2
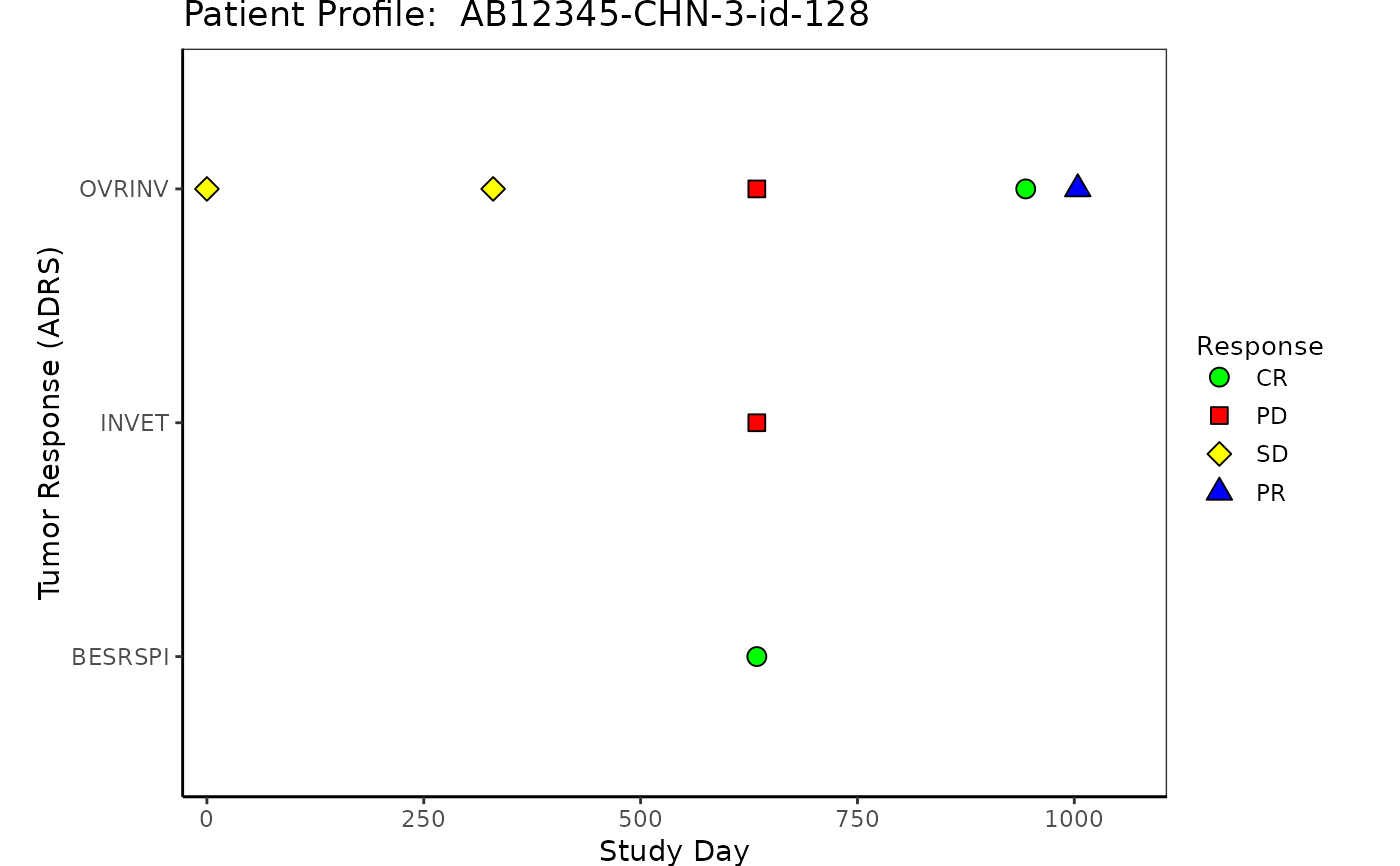
 # Example 3 Tumor Response "ADRS"
ADRS <- osprey::rADRS %>%
select(USUBJID, STUDYID, PARAMCD, PARAM, AVALC, AVAL, ADY, ADTM)
ADRS <- left_join(ADSL, ADRS, by = c("USUBJID", "STUDYID"))
p3 <- patient_domain_profile(
domain = "Tumor Response (ADRS)",
var_names = ADRS$PARAMCD,
marker_pos = ADRS$ADY,
arrow_end = ADSL$max_day,
xtick_at = waiver(),
line_col_list = NULL,
line_width = 1,
arrow_size = 0.1,
no_enddate_extention = 0,
marker_col_list = list(
marker_col = factor(ADRS$AVALC),
marker_col_opt = c(
"CR" = "green", "PR" = "blue",
"SD" = "yellow", "PD" = "red", "NE" = "pink",
"Y" = "lightblue", "N" = "darkred"
),
marker_col_legend = NULL
),
marker_shape_list = list(
marker_shape = factor(ADRS$AVALC),
marker_shape_opt = c(
"CR" = 21, "PR" = 24,
"SD" = 23, "PD" = 22, "NE" = 14,
"Y" = 11, "N" = 8
),
marker_shape_legend = "Response"
),
show_days_label = TRUE,
xlim = c(-28, ADSL$max_day),
xlab = "Study Day",
title = paste("Patient Profile: ", ADSL$USUBJID)
)
p3
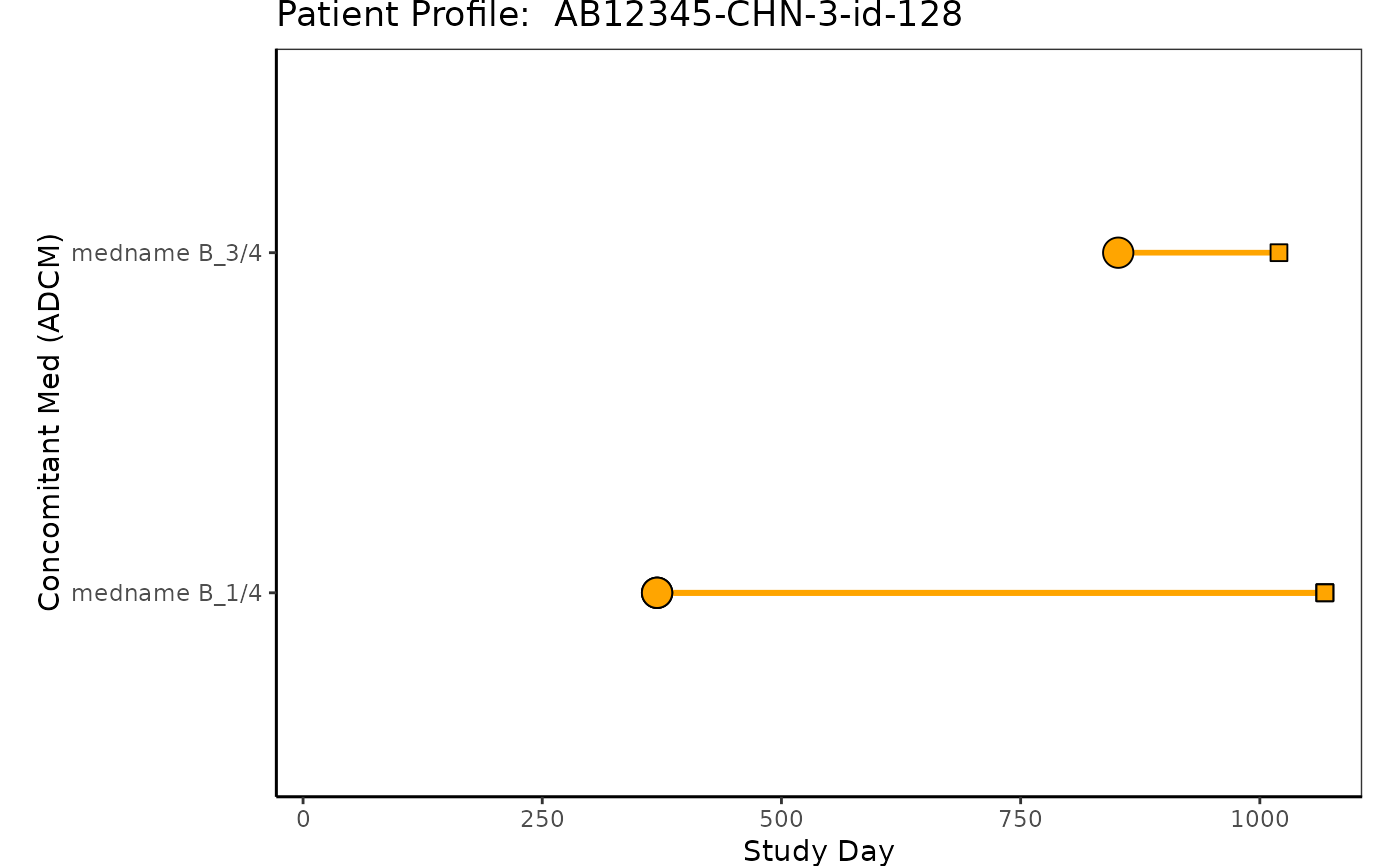
 # Example 4 Concomitant Med "ADCM"
ADCM <- osprey::rADCM %>%
select(USUBJID, STUDYID, ASTDTM, AENDTM, CMDECOD, ASTDY, AENDY)
ADCM <- left_join(ADSL, ADCM, by = c("USUBJID", "STUDYID"))
p4 <- patient_domain_profile(
domain = "Concomitant Med (ADCM)",
var_names = ADCM$CMDECOD,
marker_pos = ADCM[, c("ASTDY", "AENDY")],
arrow_end = ADSL$max_day,
xtick_at = waiver(),
line_col_list = list(line_col_opt = "orange"),
line_width = 1,
arrow_size = 0.1,
no_enddate_extention = 50,
marker_col_list = list(marker_col_opt = "orange"),
marker_shape_list = NULL,
show_days_label = TRUE,
xlim = c(-28, ADSL$max_day),
xlab = "Study Day",
title = paste("Patient Profile: ", ADSL$USUBJID)
)
p4
 # Example 5 Laboratory "ADLB"
ADLB <- osprey::rADLB %>%
select(
USUBJID, STUDYID, LBSEQ, PARAMCD, BASETYPE,
ADTM, ADY, ATPTN, AVISITN, LBTESTCD, ANRIND
)
ADLB <- left_join(ADSL, ADLB, by = c("USUBJID", "STUDYID"))
ADLB <- ADLB %>%
group_by(USUBJID) %>%
mutate(ANRIND = factor(ANRIND, levels = c("LOW", "NORMAL", "HIGH")))
p5 <- patient_domain_profile(
domain = "Laboratory (ADLB)",
var_names = ADLB$LBTESTCD,
marker_pos = ADLB$ADY,
arrow_end = ADSL$max_day,
xtick_at = waiver(),
line_col_list = NULL,
line_width = 1,
arrow_size = 0.1,
no_enddate_extention = 0,
marker_col_list = list(
marker_col = factor(ADLB$ANRIND),
marker_col_opt = c(
"HIGH" = "red", "LOW" = "blue",
"NORMAL" = "green", "NA" = "green"
)
),
marker_shape_list = list(
marker_shape = factor(ADLB$ANRIND),
marker_shape_opt = c(
"HIGH" = 24, "LOW" = 25,
"NORMAL" = 23, "NA" = 23
),
marker_shape_legend = "Labs Abnormality"
),
show_days_label = TRUE,
xlim = c(-30, ADSL$max_day),
xlab = "Study Day",
title = paste("Patient Profile: ", ADSL$USUBJID)
)
p5
