![[Experimental]](figures/lifecycle-experimental.svg)
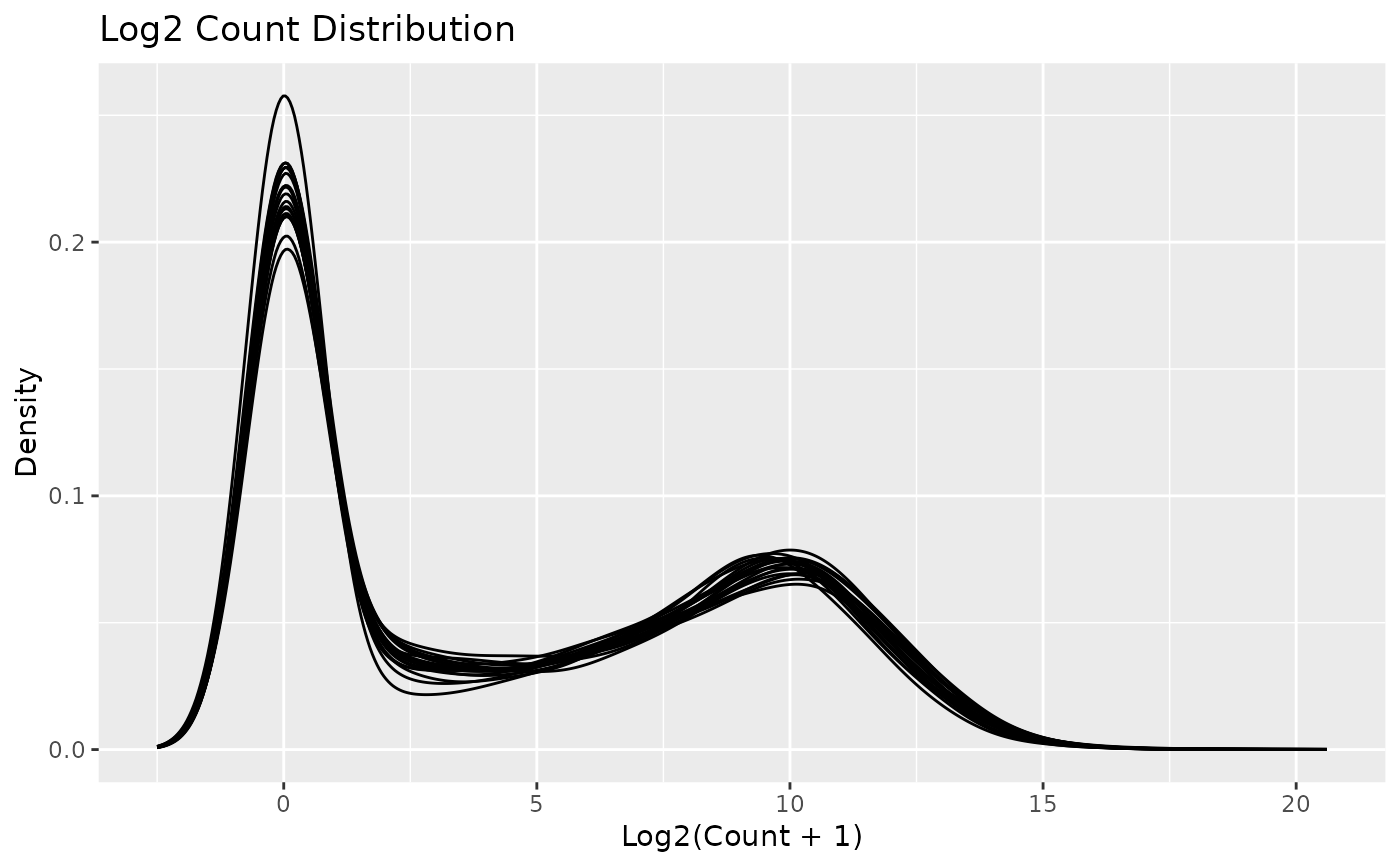
This creates a density plot of the (log) counts distributions of the AnyHermesData object where each line on the plot corresponds to a sample.
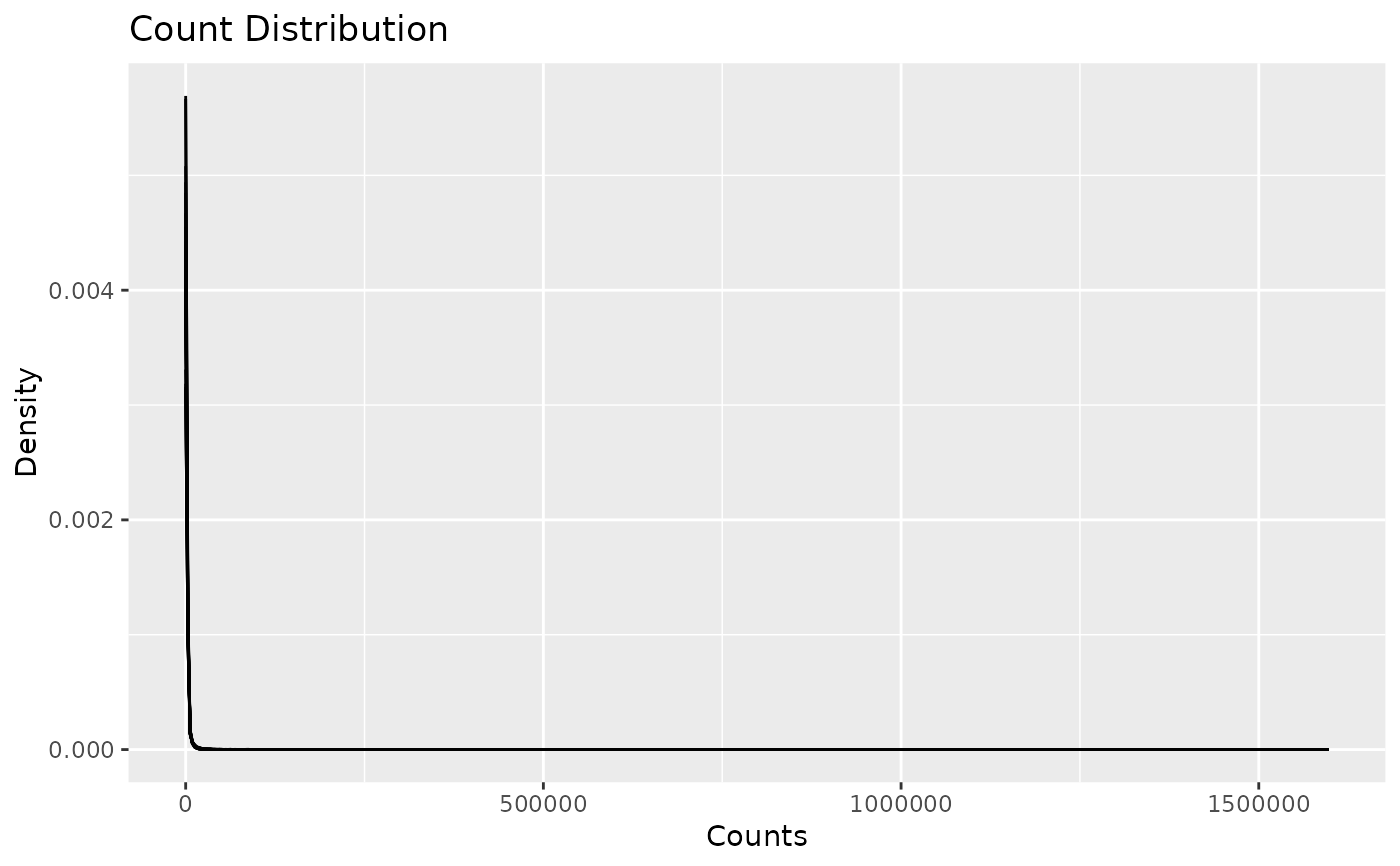
This creates a density plot of the (log) counts distributions of the AnyHermesData object where each line on the plot corresponds to a sample.