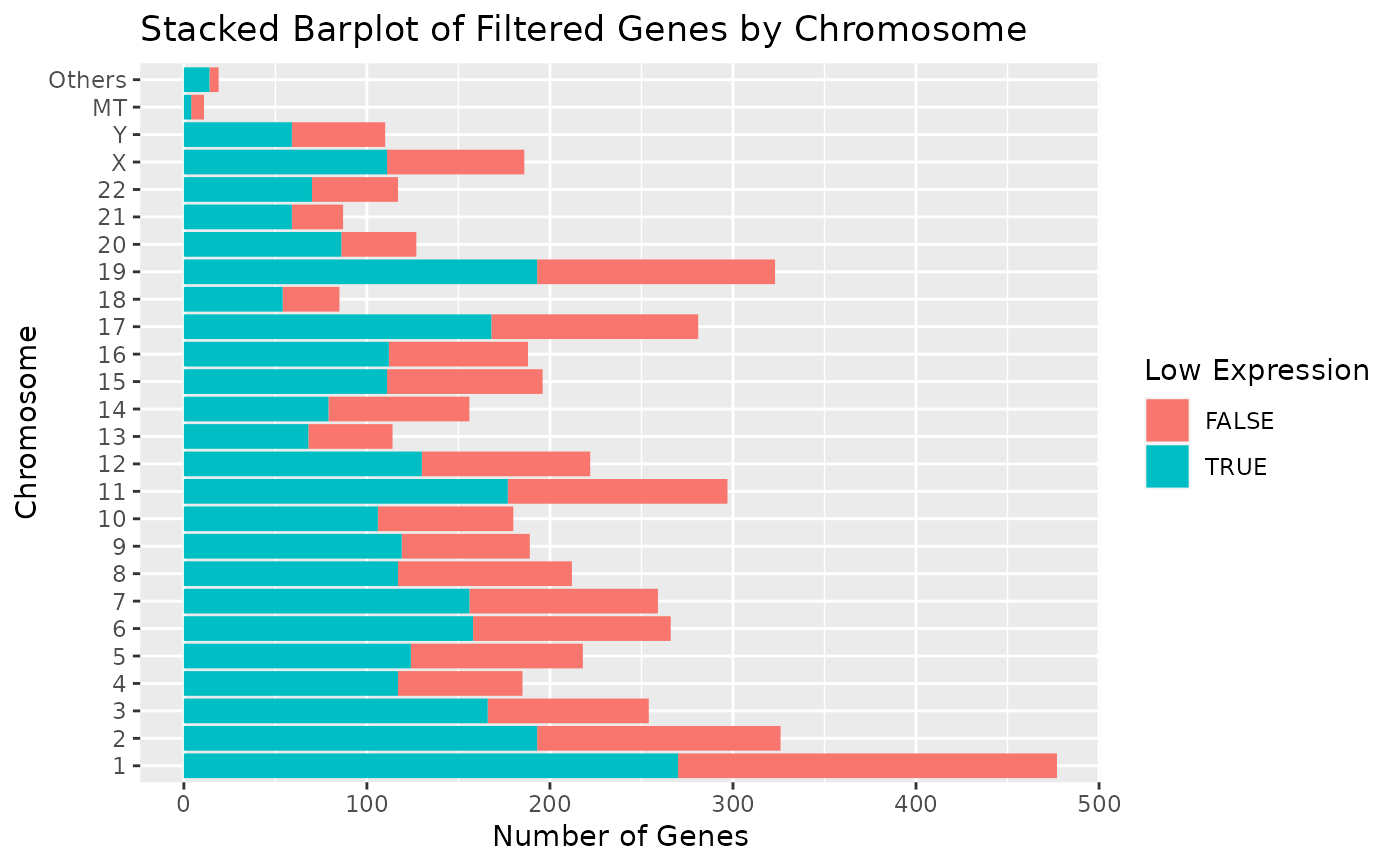
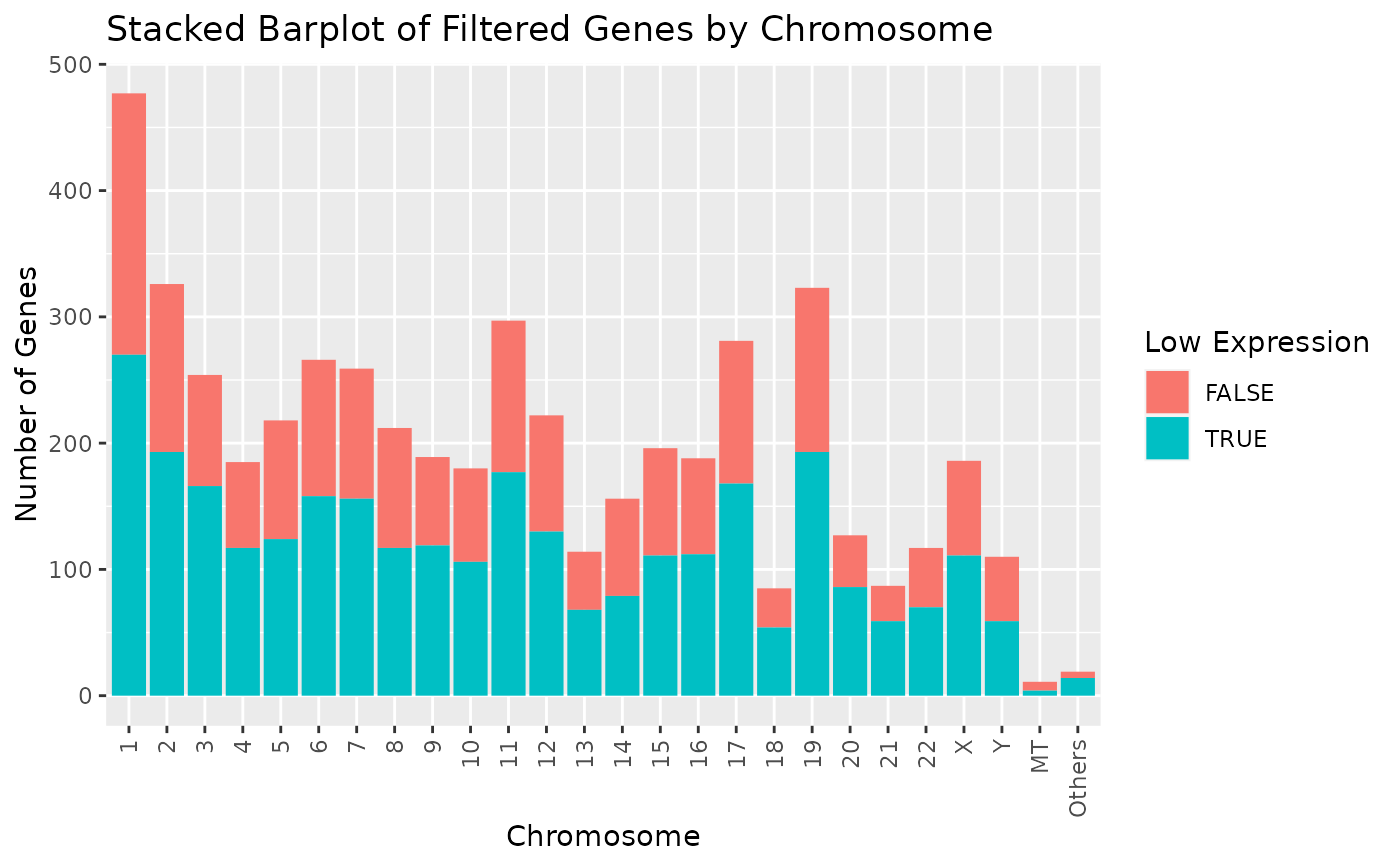
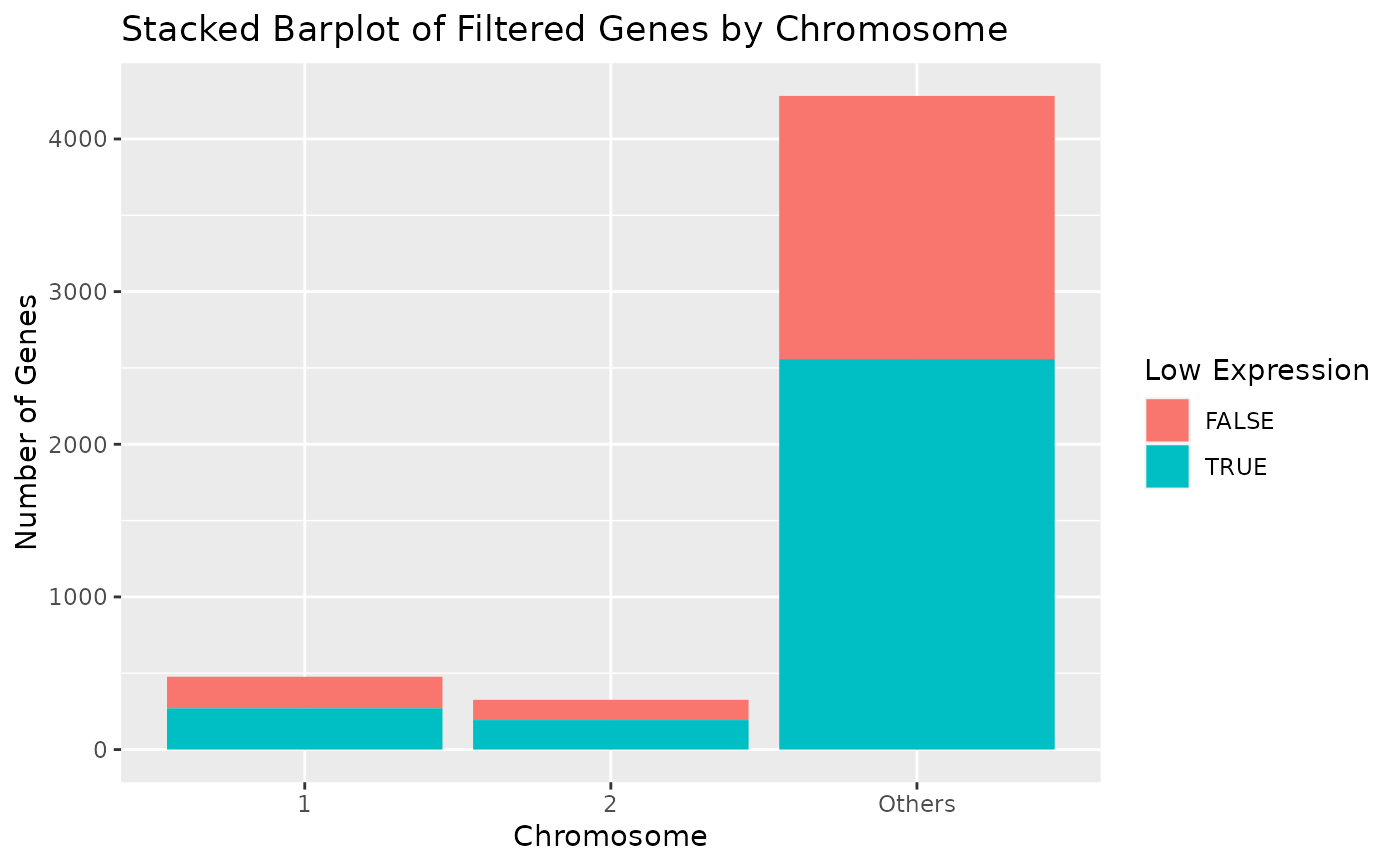
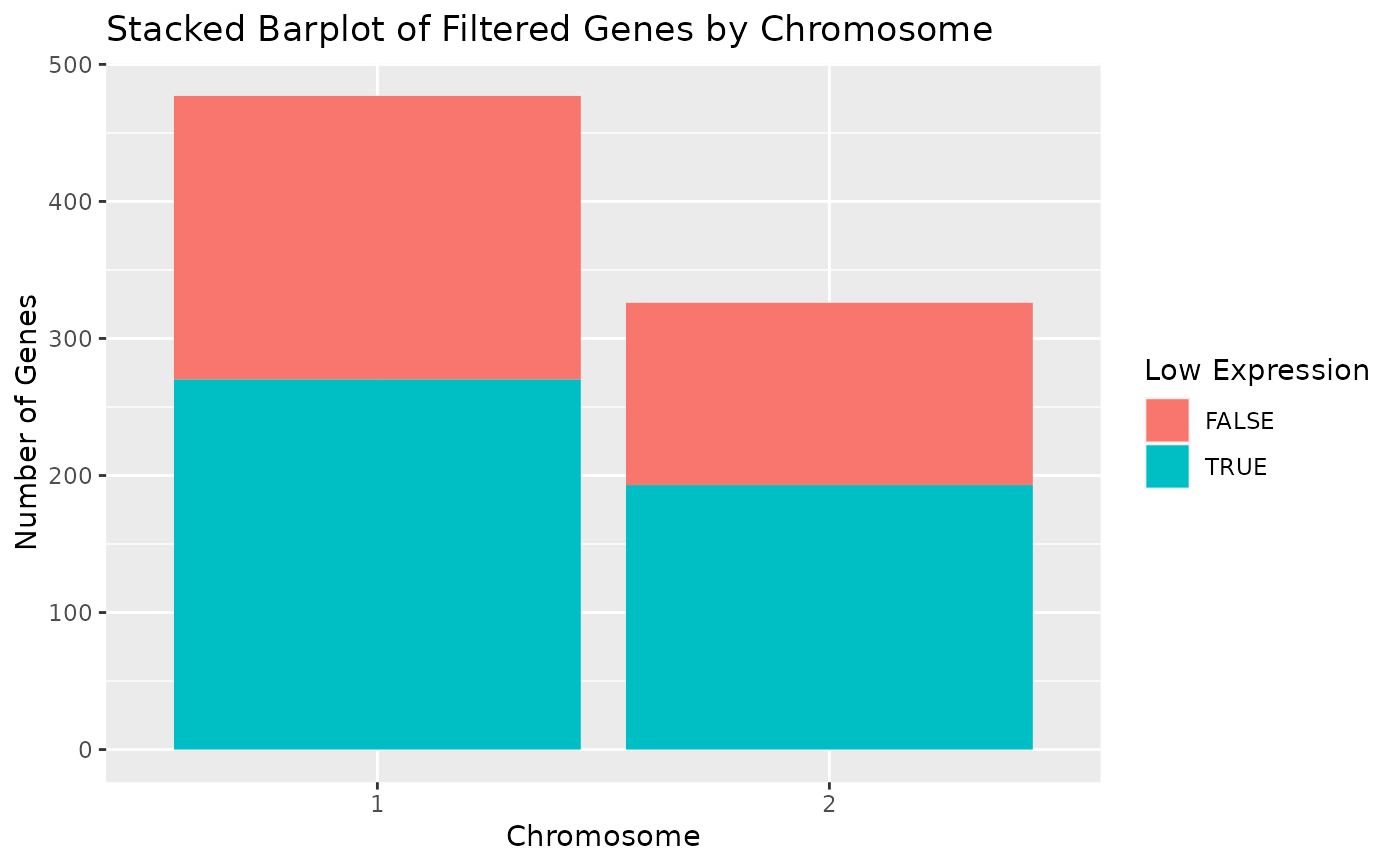
This creates a barplot of chromosomes for the AnyHermesData object with the proportions of low expression genes.
Arguments
- object
(
AnyHermesData)
input.- chromosomes
(
character)
names of the chromosomes which should be displayed.- include_others
(
flag)
option to show the chromosomes not inchromosomesas "Others".
Value
The ggplot object with the histogram.
Examples
object <- hermes_data

# Display chromosomes 1-22, X, Y, and MT. Other chromosomes are displayed in "Others".
# To increase readability, we can have flip the coordinate axes.
draw_genes_barplot(object) + coord_flip()


# Alternatively we can also rotate the x-axis tick labels.
draw_genes_barplot(object) + theme(axis.text.x = element_text(angle = 90, vjust = 0.5, hjust = 1))


# Display chromosomes 1 and 2. Other chromosomes are displayed in "Others".
draw_genes_barplot(object, chromosomes = c("1", "2"))


# Display chromosomes 1 and 2 only.
draw_genes_barplot(object, chromosomes = c("1", "2"), include_others = FALSE)
