This produces boxplots of the gene expression values of a single gene, multiple genes or a gene signature.
draw_boxplot(
  object,
  assay_name,
  genes,
  x_var = NULL,
  color_var = NULL,
  facet_var = NULL,
  violin = FALSE,
  jitter = FALSE
)

h_draw_boxplot_df(object, assay_name, genes, x_var, color_var, facet_var)
Arguments
- object
(
AnyHermesData)
input.- assay_name
(
string)
selects assay from input for the y-axis.- genes
(
GeneSpec)
for which genes or which gene signature to produce boxplots.- x_var
(
stringorNULL)
optional stratifying variable for the x-axis, taken from input sample variables.- color_var
(
stringorNULL)
optional color variable, taken from input sample variables.- facet_var
(
stringorNULL)
optional faceting variable, taken from input sample variables.- violin
(
flag)
whether to draw a violin plot instead of a boxplot.- jitter
(
flag)
whether to add jittered original data points.
Value
The ggplot boxplot.
Functions
h_draw_boxplot_df: Helper function to prepare the data frame required for plotting.
Examples
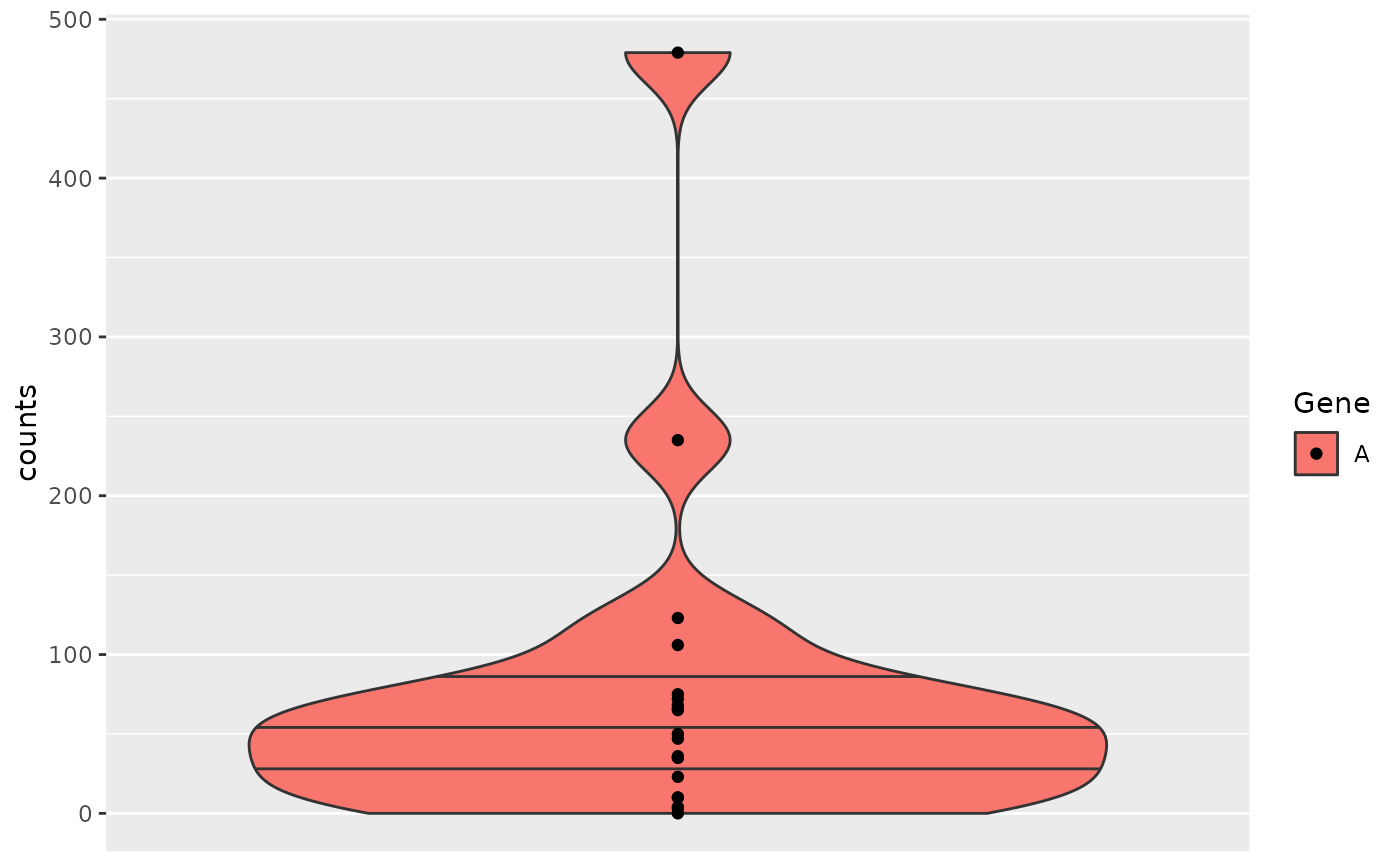
object <- hermes_data
draw_boxplot(
  object,
  assay_name = "counts",
  genes = gene_spec(c(A = genes(object)[1])),
  violin = TRUE
)


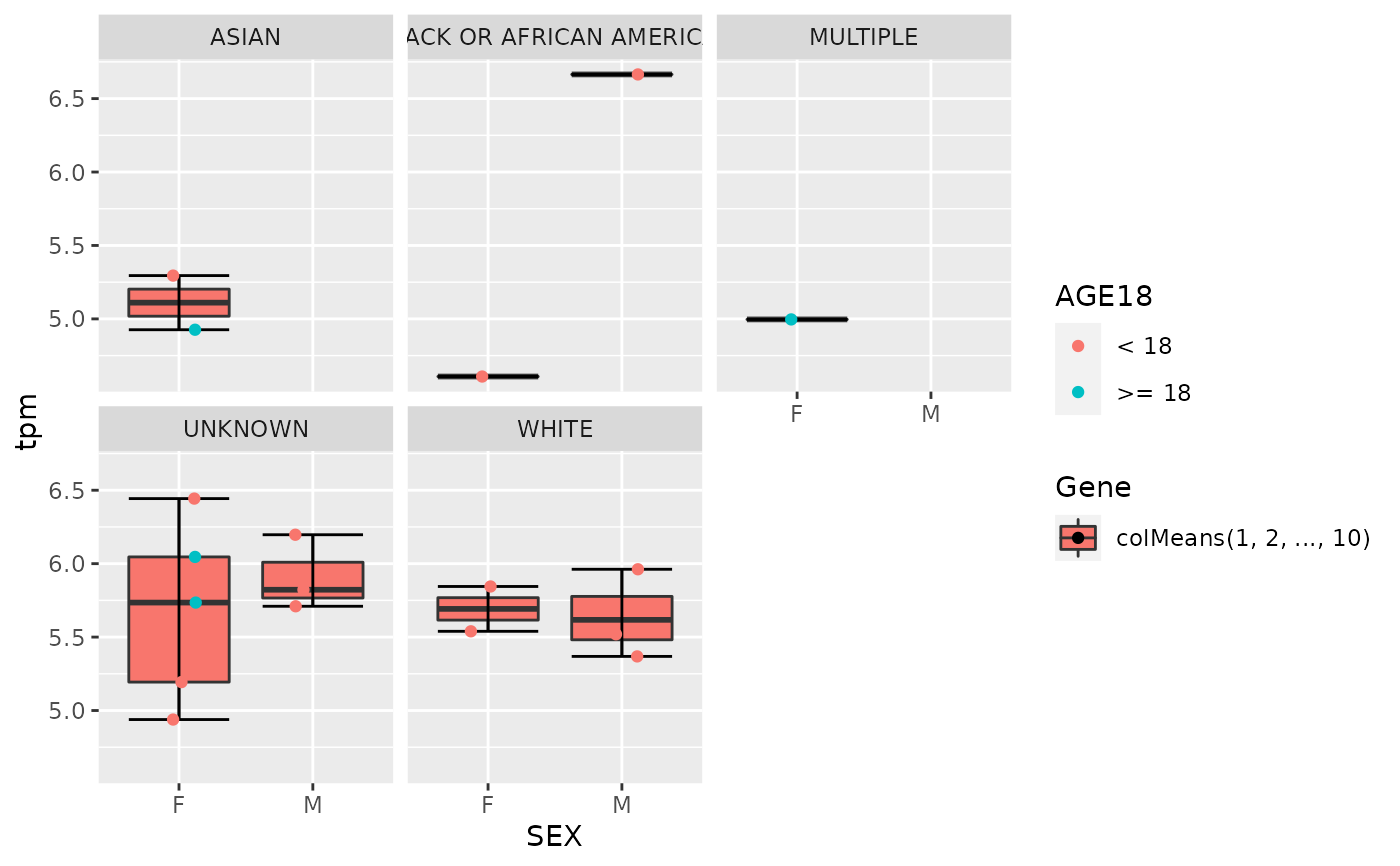
object2 <- object %>%
  add_quality_flags() %>%
  filter() %>%
  normalize()
draw_boxplot(
  object2,
  assay_name = "tpm",
  x_var = "SEX",
  genes = gene_spec(setNames(genes(object2)[1:10], 1:10), fun = colMeans),
  facet_var = "RACE",
  color_var = "AGE18",
  jitter = TRUE
)


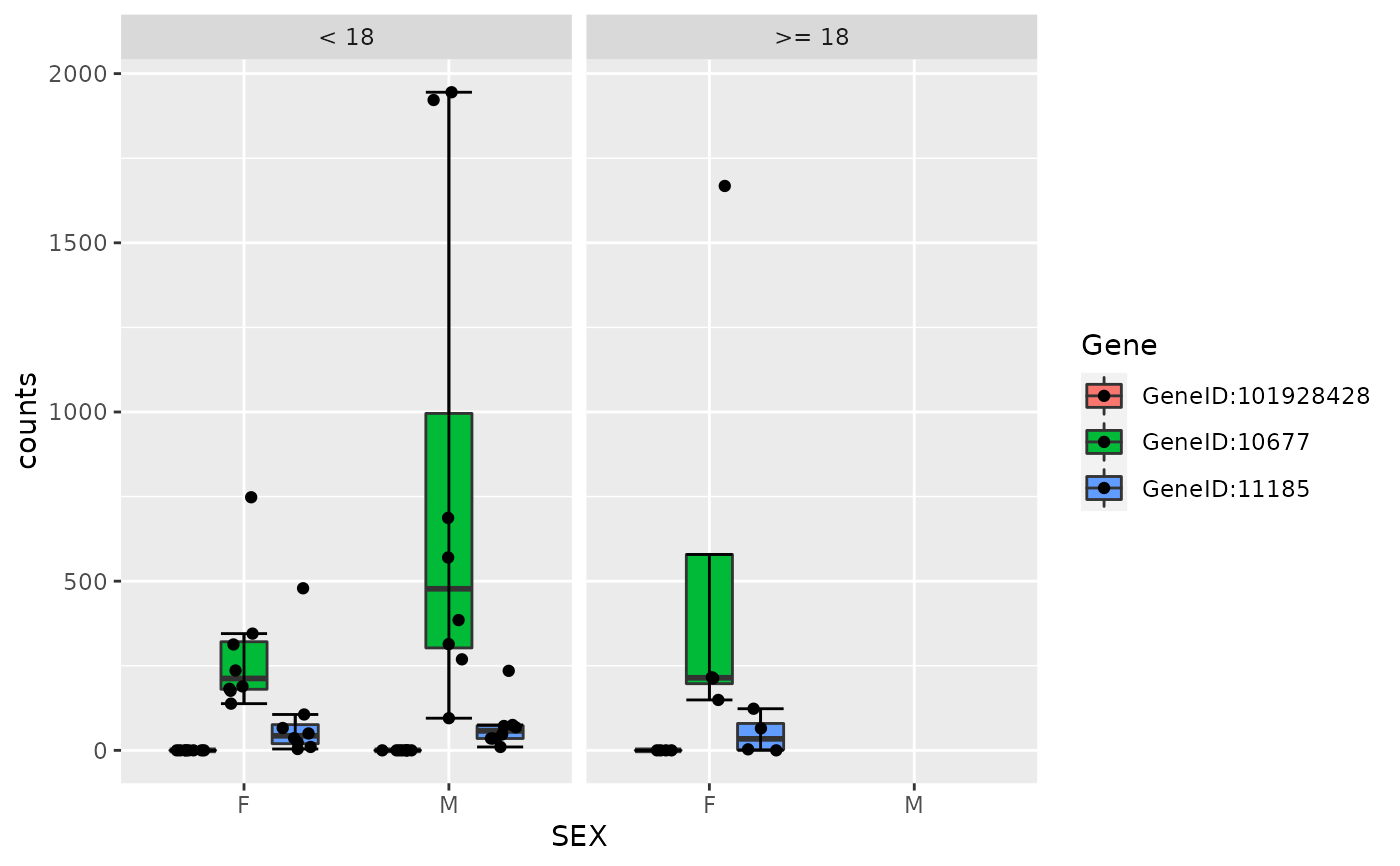
draw_boxplot(
  object,
  assay_name = "counts",
  x_var = "SEX",
  genes = gene_spec(genes(object)[1:3]),
  jitter = TRUE,
  facet_var = "AGE18"
)


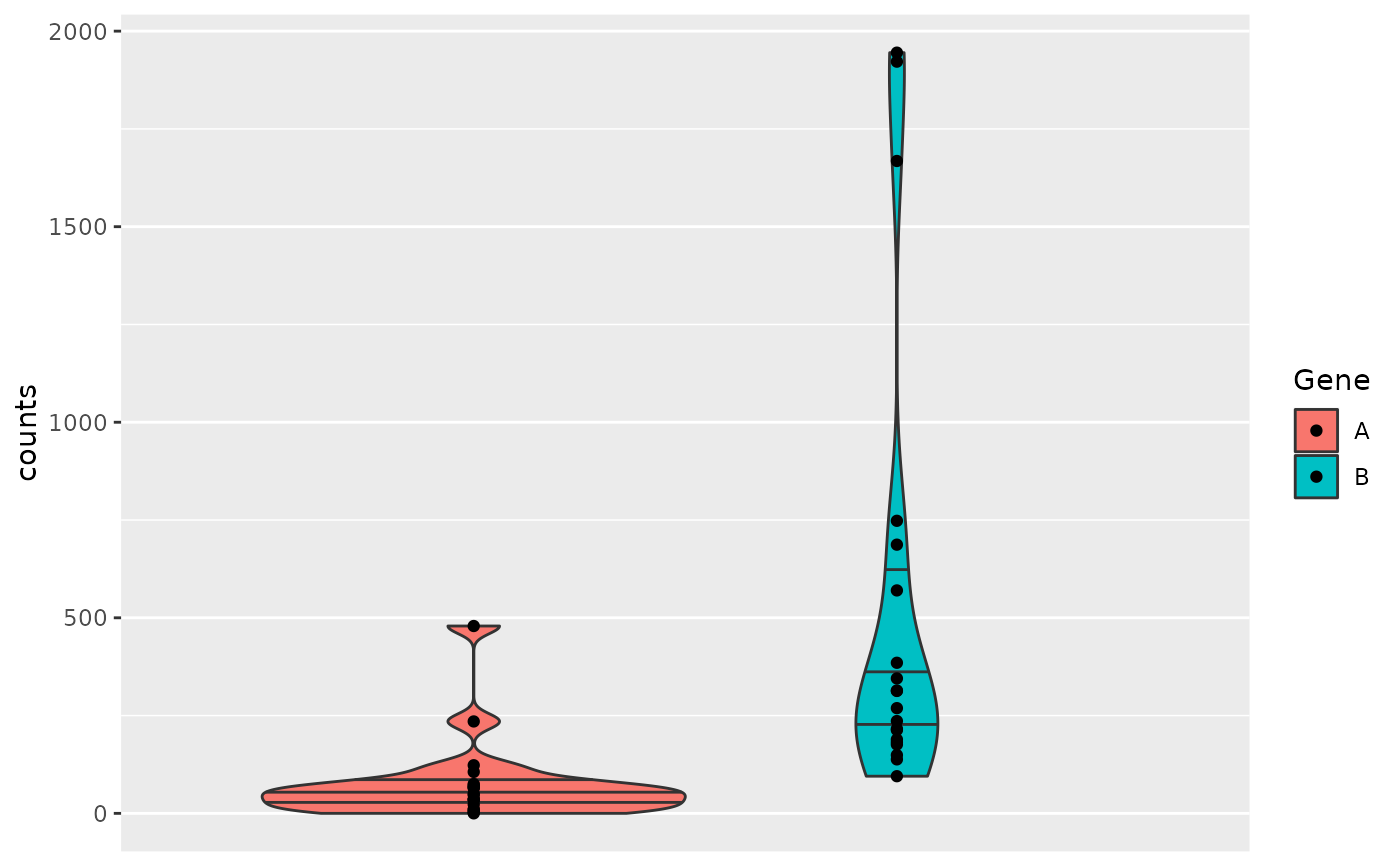
draw_boxplot(
  object,
  assay_name = "counts",
  genes = gene_spec(c(A = "GeneID:11185", B = "GeneID:10677")),
  violin = TRUE
)
