![[Experimental]](figures/lifecycle-experimental.svg)
This produces a barplot of the dichotomized gene expression counts into two or three categories based on custom defined percentiles.
draw_barplot(
  object,
  assay_name,
  x_spec,
  facet_var = NULL,
  fill_var = NULL,
  percentiles = c(1/3, 2/3)
)
Arguments
- object
(
AnyHermesData)
input.- assay_name
(
string)
selects assay from input.- x_spec
(
GeneSpec)
gene specification for the x-axis.- facet_var
(
stringorNULL)
optional faceting variable, taken from input sample variables.- fill_var
(
stringorNULL)
optional fill variable, taken from input sample variables.- percentiles
(
vector)
lower and upper percentiles to dichotomize the gene counts into two or three categories.
Value
The ggplot barplot.
Examples
object <- hermes_data
g <- genes(object)
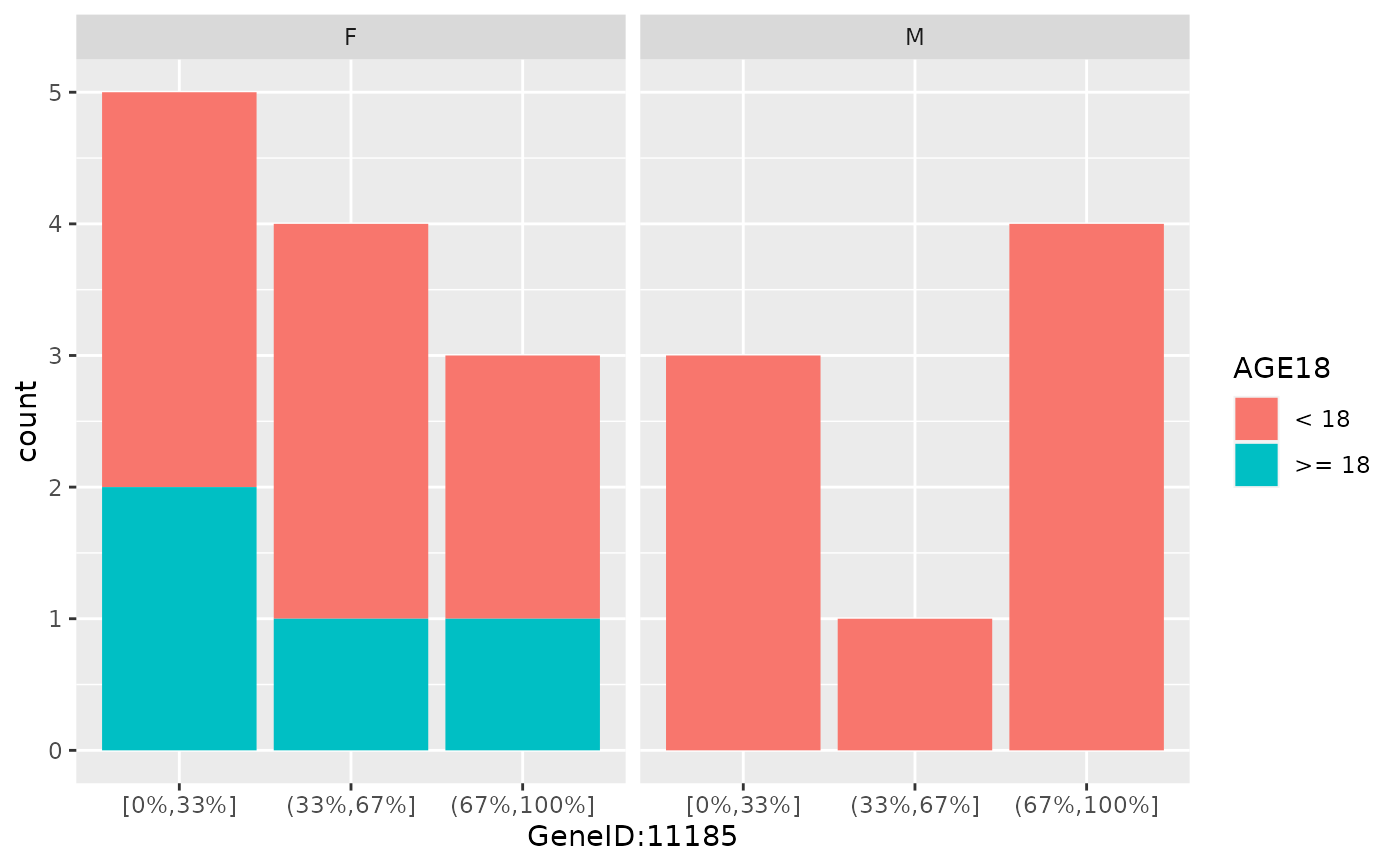
draw_barplot(
object,
assay_name = "counts",
x_spec = gene_spec(g[1]),
facet_var = "SEX",
fill_var = "AGE18"
)
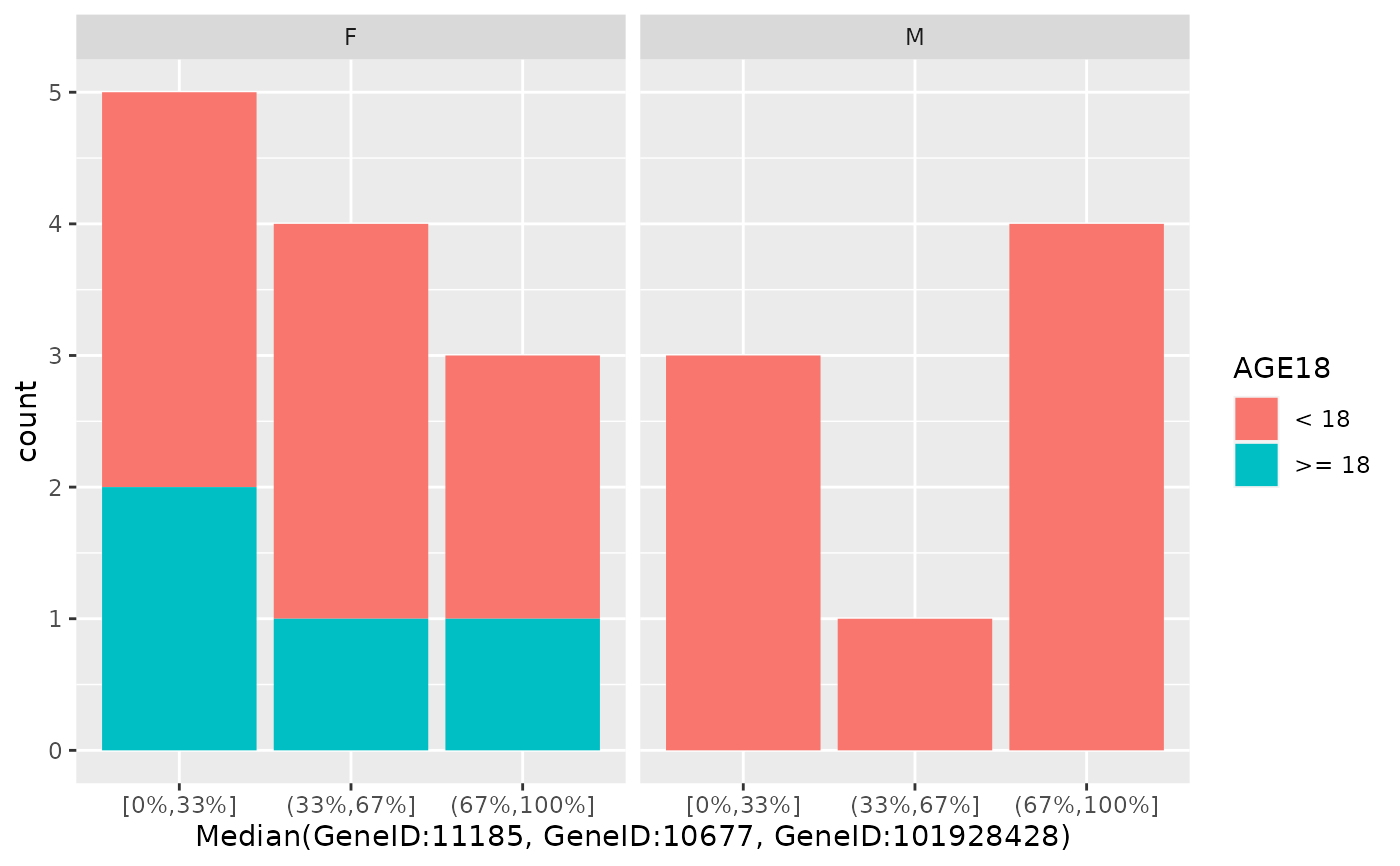
 draw_barplot(
object,
assay_name = "counts",
x_spec = gene_spec(g[1:3], colMedians, "Median"),
facet_var = "SEX",
fill_var = "AGE18"
)
draw_barplot(
object,
assay_name = "counts",
x_spec = gene_spec(g[1:3], colMedians, "Median"),
facet_var = "SEX",
fill_var = "AGE18"
)
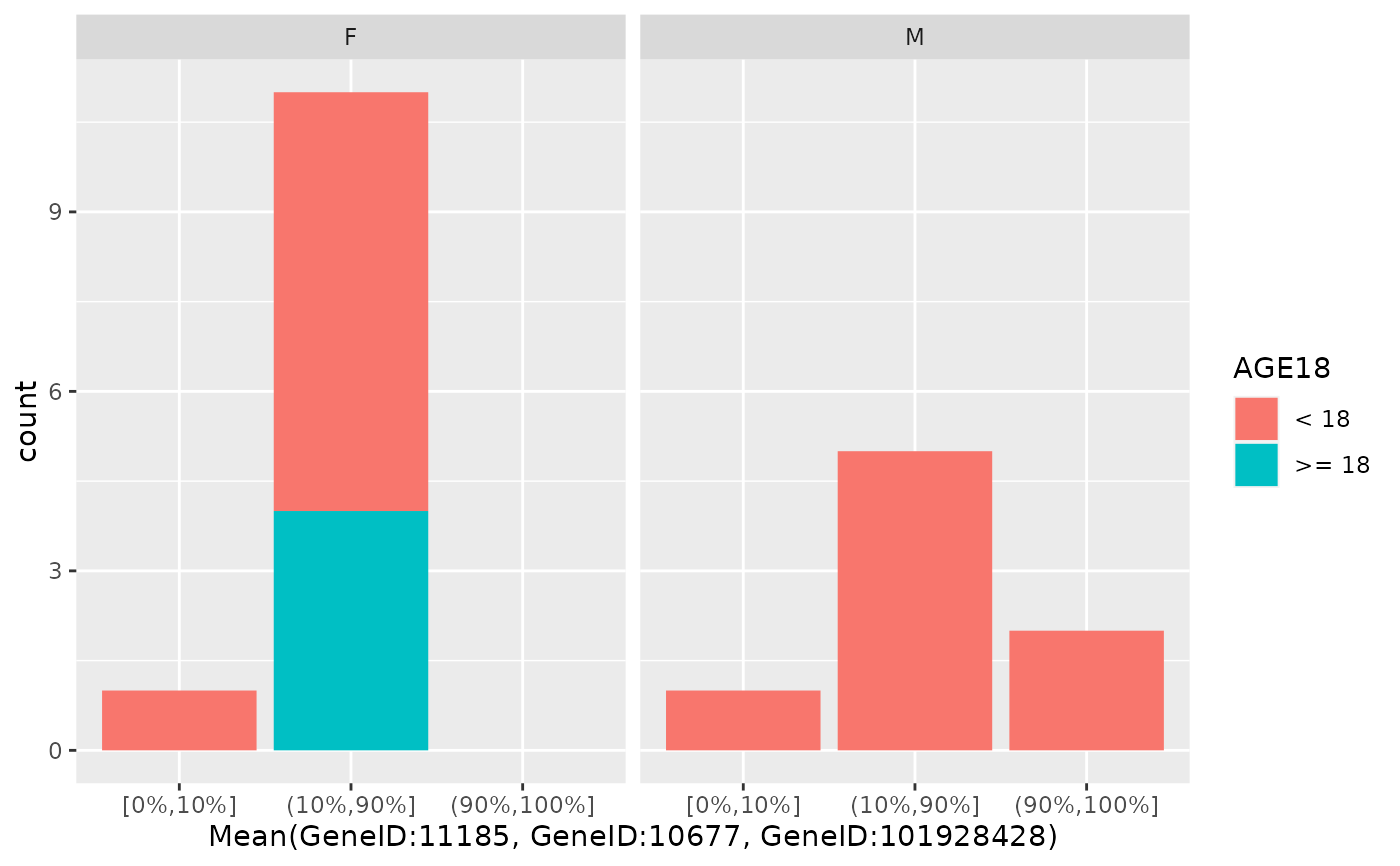
 draw_barplot(
object,
assay_name = "counts",
x_spec = gene_spec(g[1:3], colMeans, "Mean"),
facet_var = "SEX",
fill_var = "AGE18",
percentiles = c(0.1, 0.9)
)
draw_barplot(
object,
assay_name = "counts",
x_spec = gene_spec(g[1:3], colMeans, "Mean"),
facet_var = "SEX",
fill_var = "AGE18",
percentiles = c(0.1, 0.9)
)