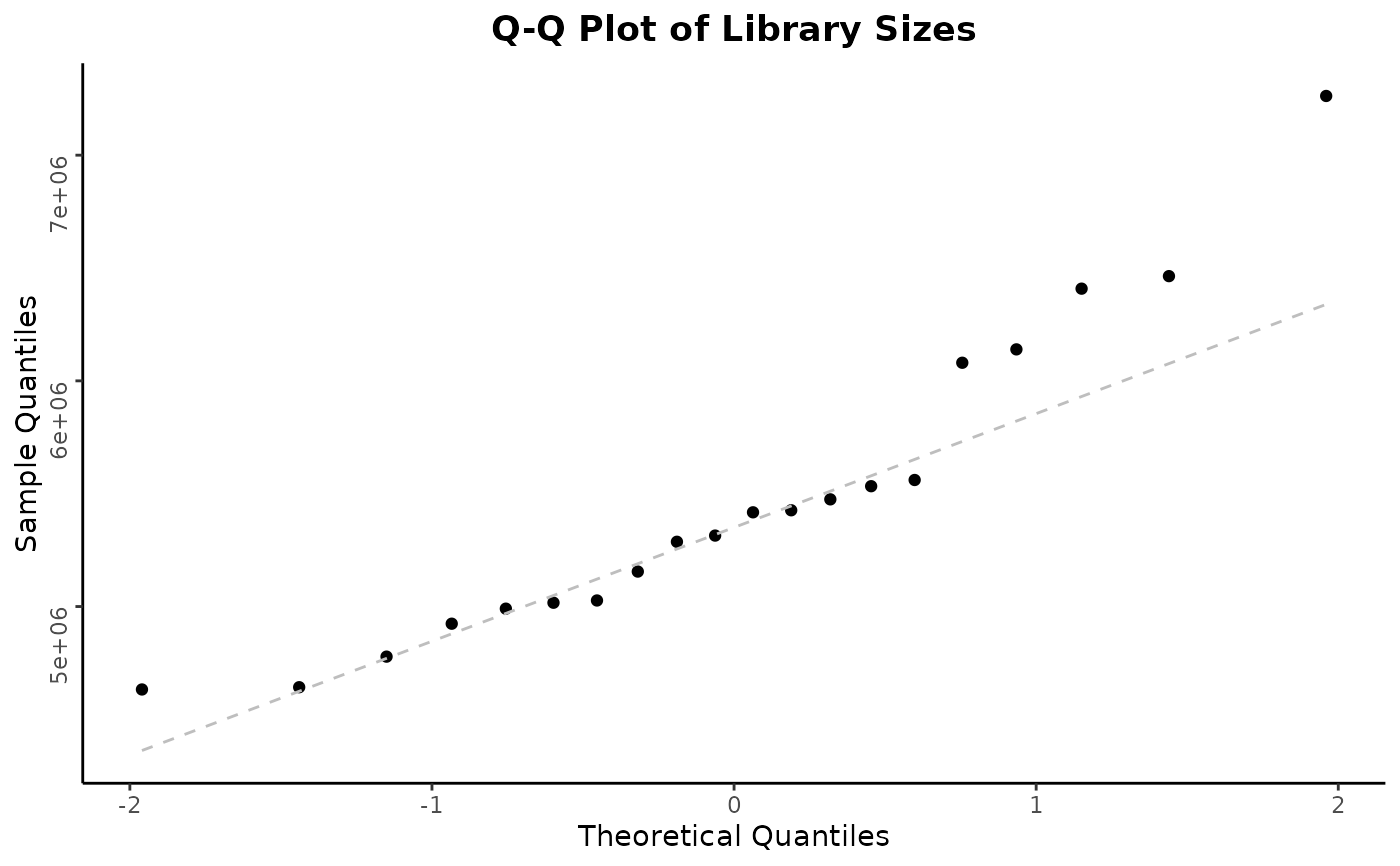
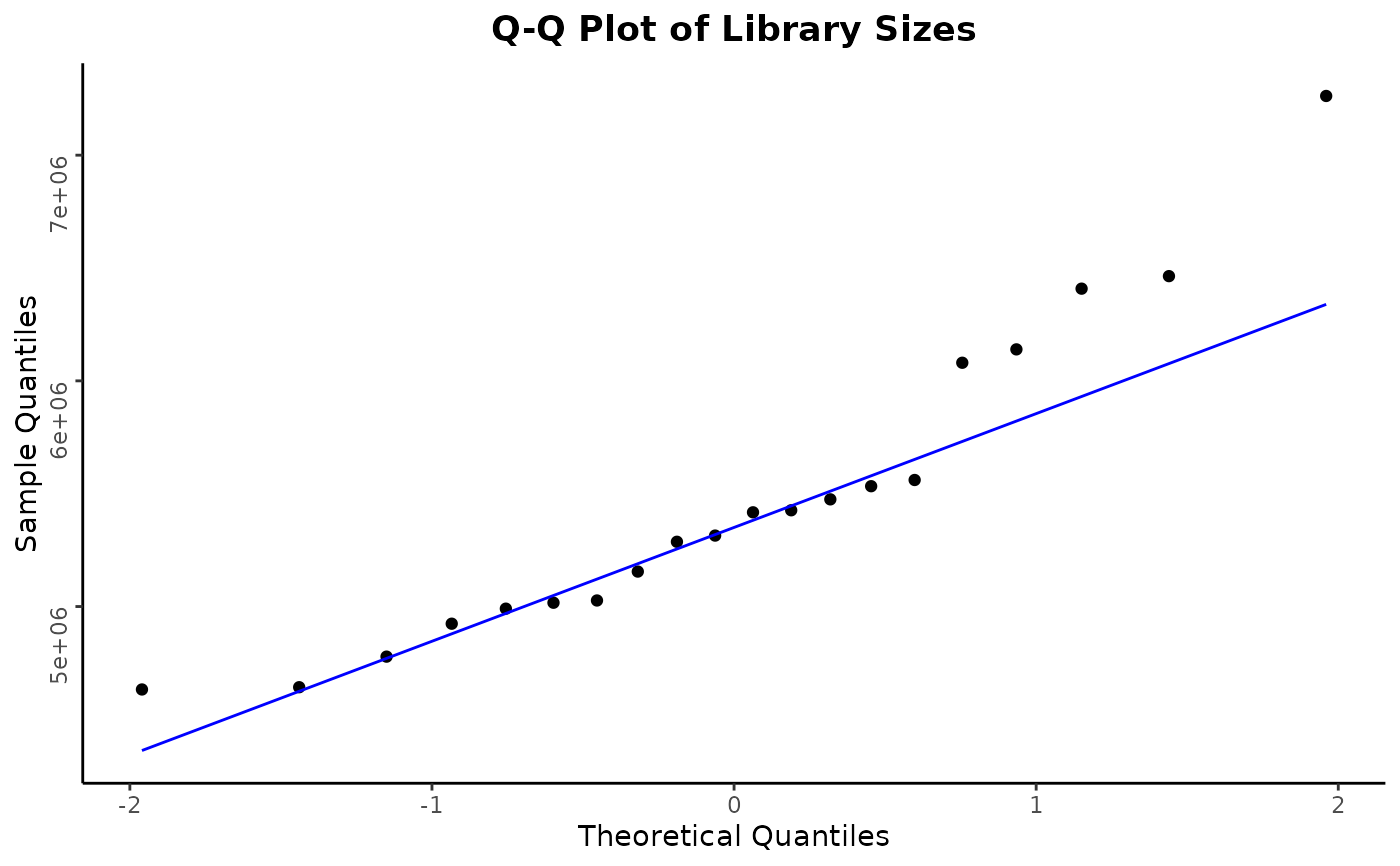
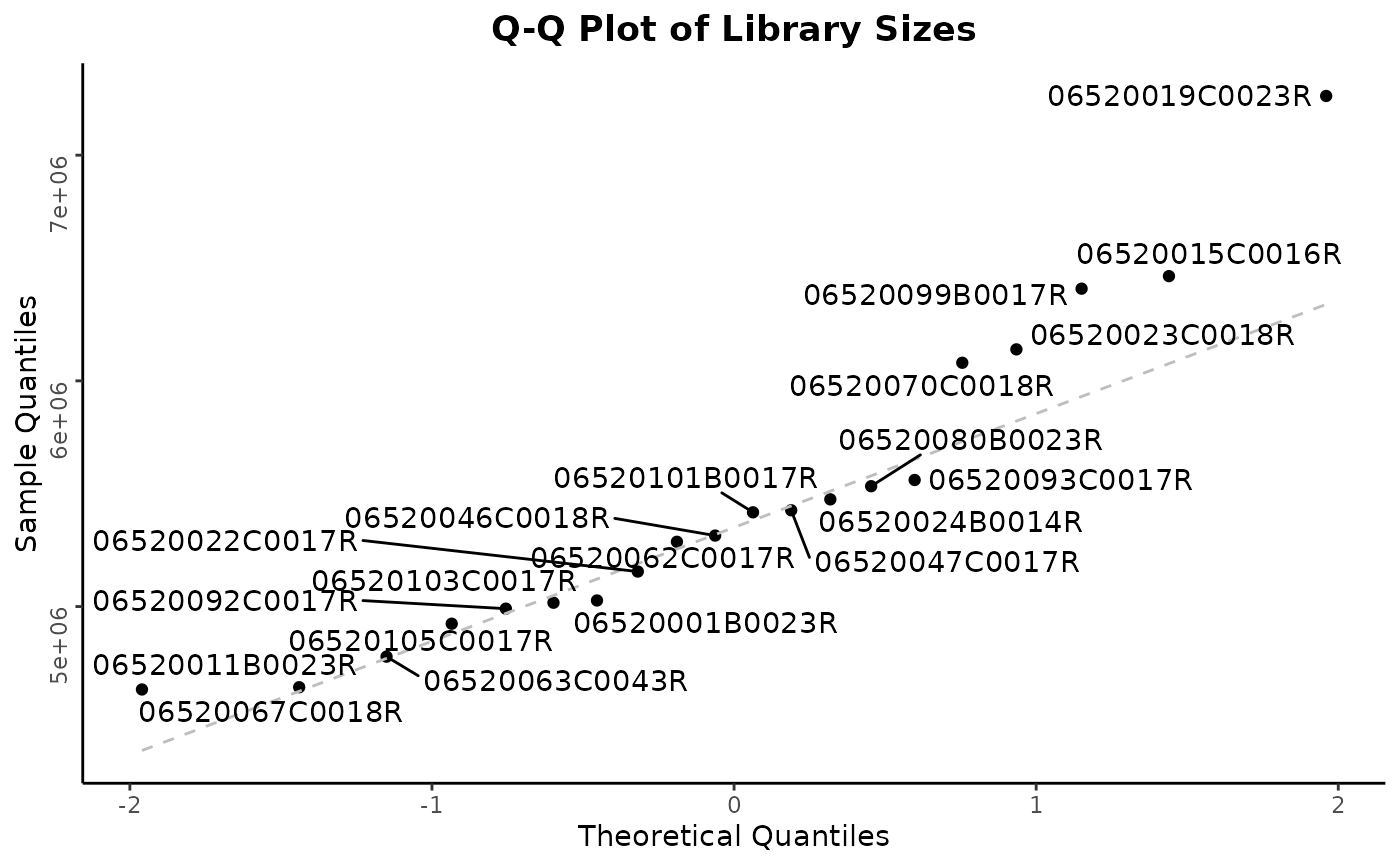
This creates a Q-Q plot of the library sizes of the AnyHermesData object.
Examples
result <- hermes_data
draw_libsize_qq(result)

draw_libsize_qq(result, color = "blue", linetype = "solid")


# We can also add sample names as labels.
library(ggrepel)
draw_libsize_qq(result) + geom_text_repel(label = colnames(result), stat = "qq")

