This creates a histogram of the library sizes of the AnyHermesData object.
Usage
draw_libsize_hist(object, bins = 30L, fill = "darkgrey")
Arguments
- object
(AnyHermesData)
input.
- bins
(count)
number of evenly distributed groups desired.
- fill
(string)
color of the bars filling.
Value
The ggplot object with the histogram.
Examples
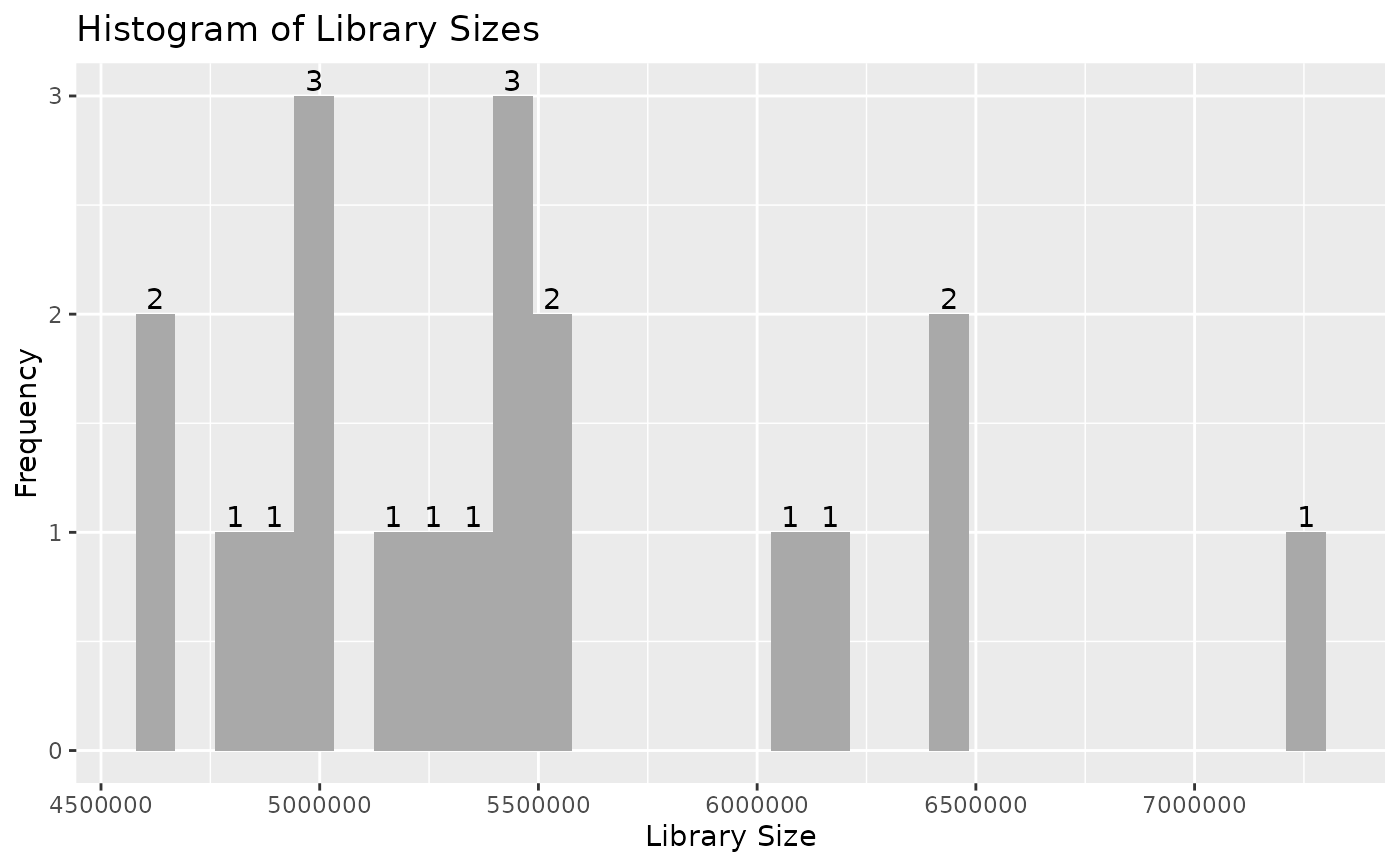
result <- hermes_data
draw_libsize_hist(result)
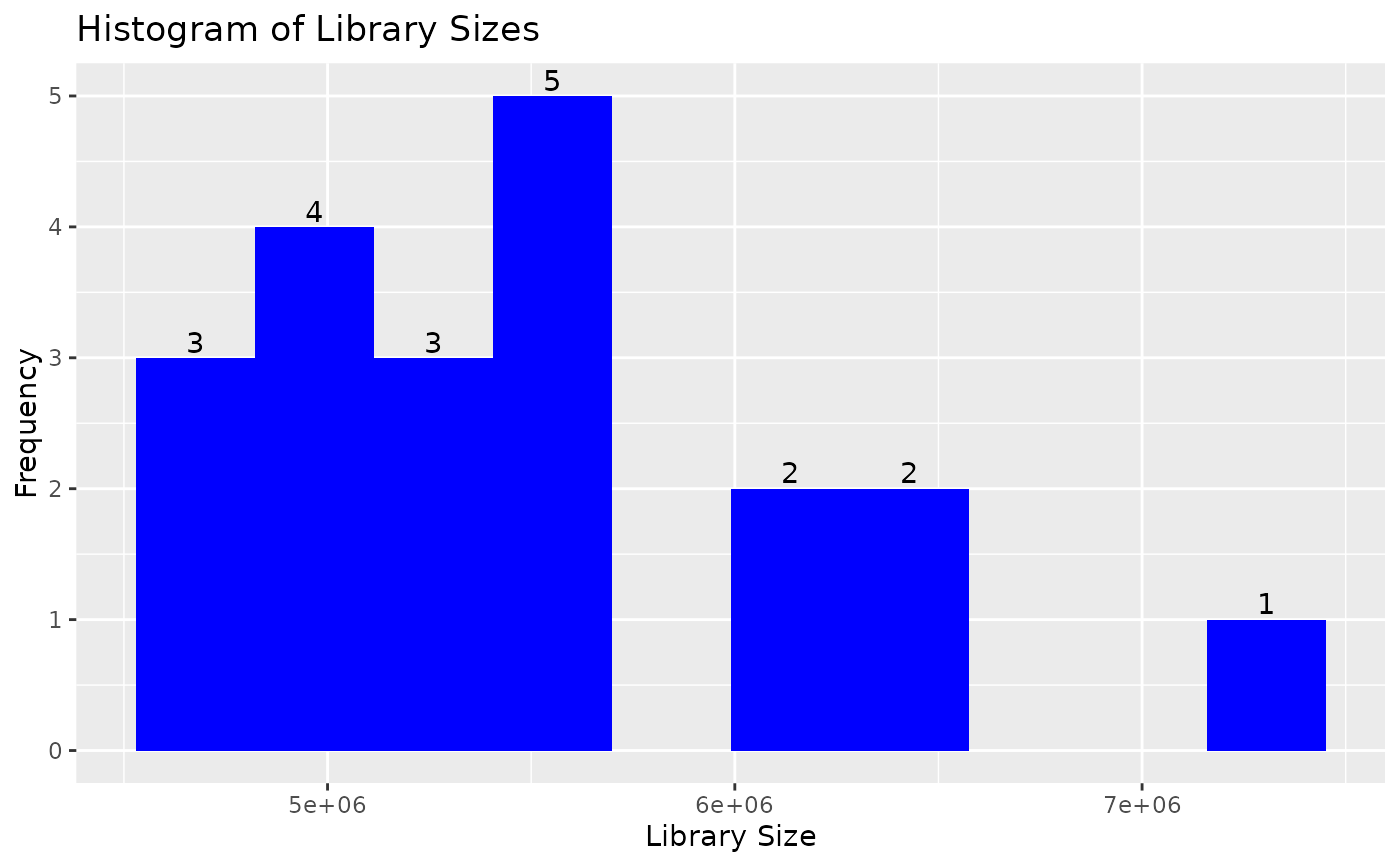
 draw_libsize_hist(result, bins = 10L, fill = "blue")