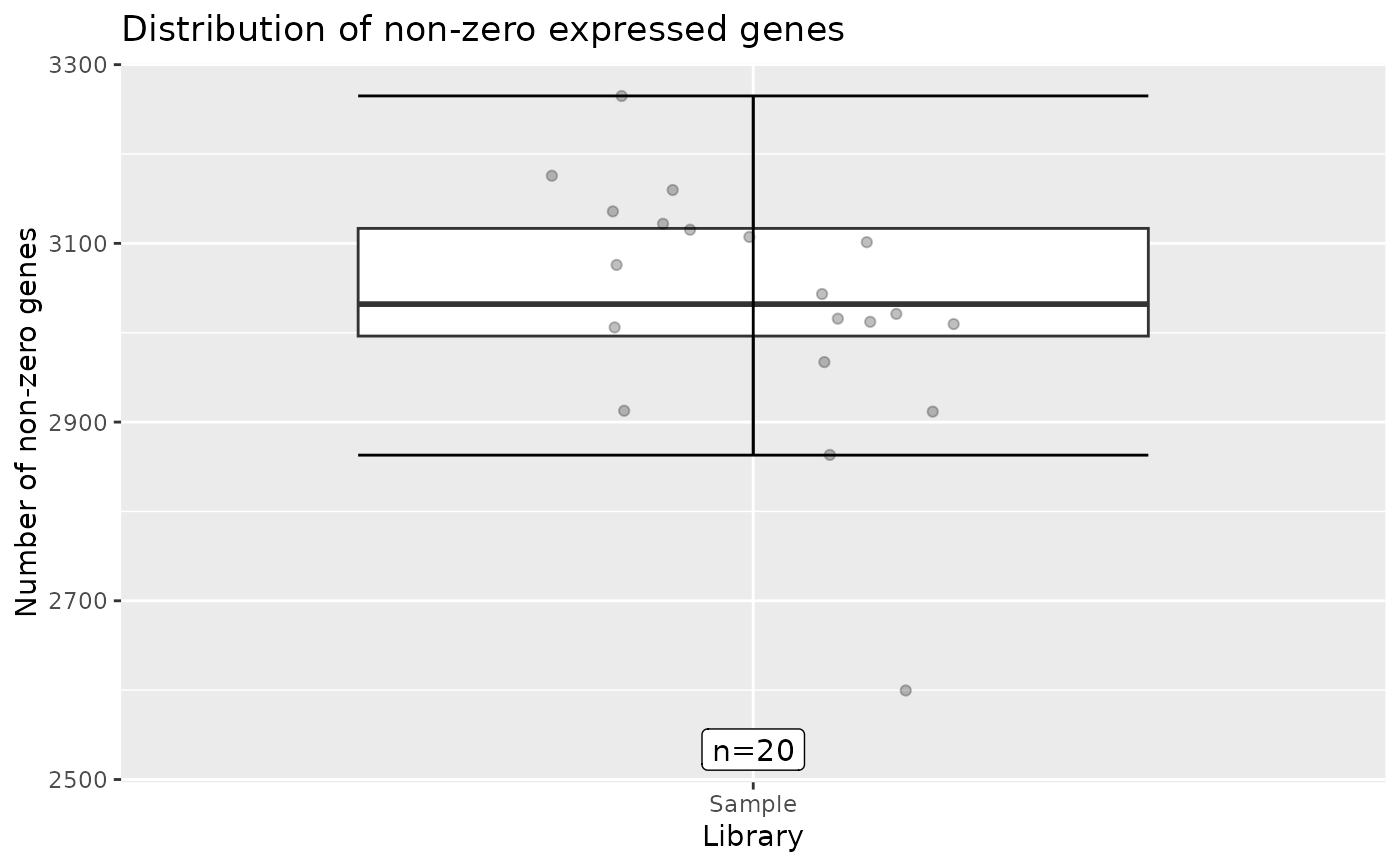
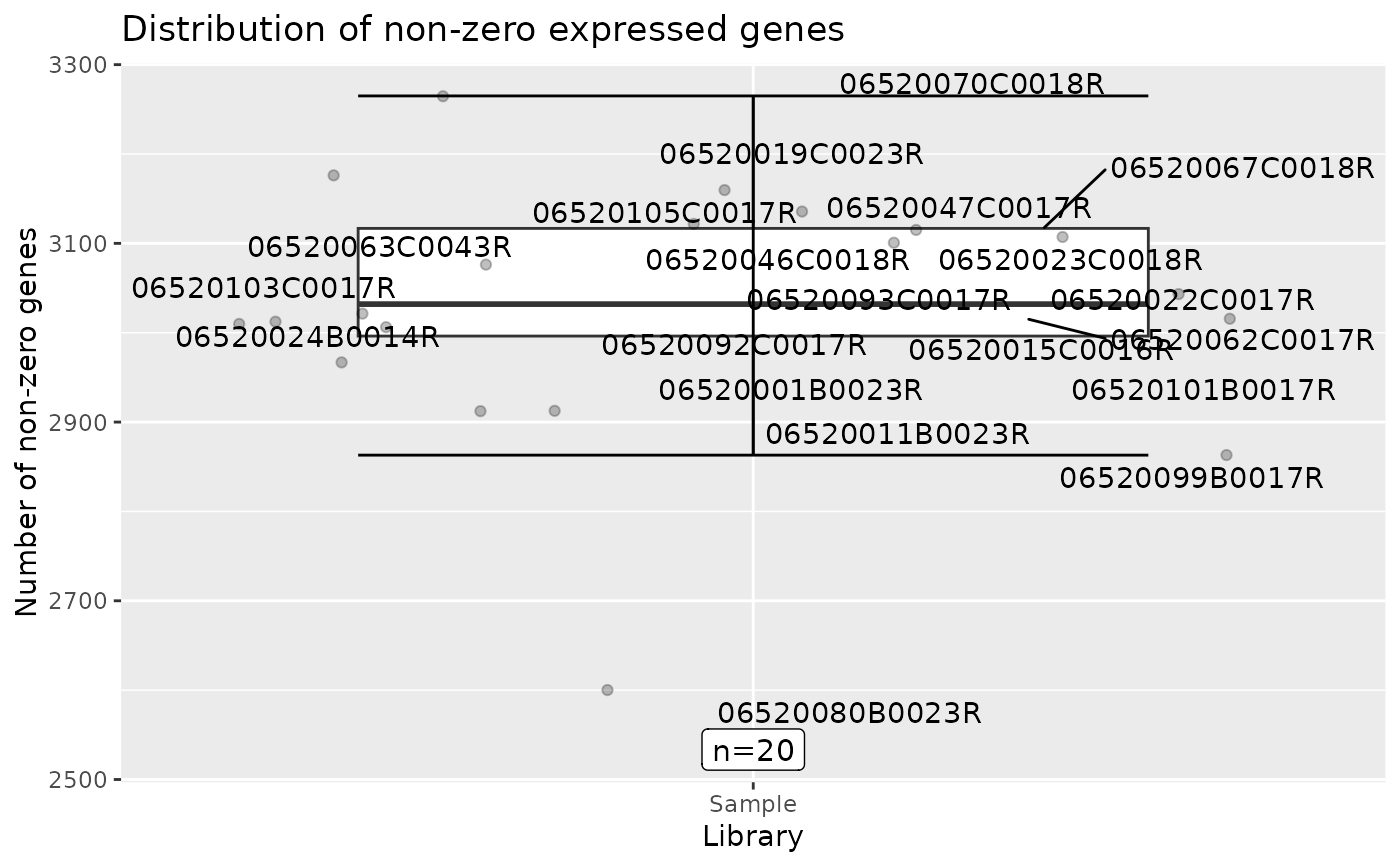
This draws a boxplot, with overlaid data points, of the number of non-zero expressed genes per sample.
Usage
draw_nonzero_boxplot(object, position = position_jitter(0.2), alpha = 0.25)Examples
# Default boxplot.
result <- hermes_data
draw_nonzero_boxplot(result)


# Reusing the same position for labeling.
library(ggrepel)
pos <- position_jitter(0.5)
draw_nonzero_boxplot(result, position = pos) +
  geom_text_repel(aes(label = samples(result)), position = pos)

