A box plot is a method for graphically depicting groups of numerical data through their quartiles. Box plots may also have lines extending vertically from the boxes (whiskers) indicating variability outside the upper and lower quartiles, hence the term box-and-whisker. Outliers may be plotted as individual points. Box plots are non-parametric: they display variation in samples of a statistical population without making any assumptions of the underlying statistical distribution. The spacings between the different parts of the box indicate the degree of dispersion (spread) and skewness in the data, and show outliers. In addition to the points themselves, they allow one to visually estimate various L-estimators, notably the interquartile range, midhinge, range, mid-range, and trimean.
Usage
g_boxplot(
  data,
  biomarker,
  param_var = "PARAMCD",
  yaxis_var,
  trt_group,
  xaxis_var = NULL,
  loq_flag_var = "LOQFL",
  loq_legend = TRUE,
  unit = NULL,
  color_manual = NULL,
  shape_manual = NULL,
  box = TRUE,
  ylim = c(NA, NA),
  dot_size = 2,
  alpha = 1,
  facet_ncol = NULL,
  rotate_xlab = FALSE,
  font_size = NULL,
  facet_var = NULL,
  hline_arb = numeric(0),
  hline_arb_color = "red",
  hline_arb_label = "Horizontal line",
  hline_vars = character(0),
  hline_vars_colors = "green",
  hline_vars_labels = hline_vars
)
Arguments
- data
ADaMstructured analysis laboratory data frame e.g.ADLB.- biomarker
biomarker to visualize e.g.
IGG.- param_var
name of variable containing biomarker codes e.g.
PARAMCD.- yaxis_var
name of variable containing biomarker results displayed on Y-axis e.g.
AVAL.- trt_group
name of variable representing treatment
trt_groupe.g.ARM.- xaxis_var
variable used to group the data on the x-axis.
- loq_flag_var
name of variable containing
LOQflag e.g.LOQFL.- loq_legend
logicalwhether to includeLoQlegend.- unit
biomarker unit label e.g. (U/L)
- color_manual
vector of color for
trt_group- shape_manual
vector of shapes (used with
loq_flag_var)- box
add boxes to the plot (boolean)
- ylim
('numeric vector') optional, a vector of length 2 to specify the minimum and maximum of the y-axis if the default limits are not suitable.
- dot_size
plot dot size.
- alpha
dot transparency (0 = transparent, 1 = opaque)
- facet_ncol
number of facets per row. NULL = Use the default for
ggplot2::facet_wrap- rotate_xlab
45 degree rotation of x-axis label values.
- font_size
point size of text to use. NULL is use default size
- facet_var
variable to facet the plot by, or
"None"if no faceting required.- hline_arb
('numeric vector') value identifying intercept for arbitrary horizontal lines.
- hline_arb_color
('character vector') optional, color for the arbitrary horizontal lines.
- hline_arb_label
('character vector') optional, label for the legend to the arbitrary horizontal lines.
- hline_vars
('character vector'), names of variables
(ANR*)or values(*LOQ)identifying intercept values. The data inside of theggplot2object must also contain the columns with these variable names- hline_vars_colors
('character vector') colors for the horizontal lines defined by variables.
- hline_vars_labels
('character vector') labels for the legend to the horizontal lines defined by variables.
Examples
# Example using ADaM structure analysis dataset.
library(nestcolor)
ADLB <- rADLB
var_labels <- lapply(ADLB, function(x) attributes(x)$label)
ADLB <- ADLB %>%
mutate(AVISITCD = case_when(
AVISIT == "SCREENING" ~ "SCR",
AVISIT == "BASELINE" ~ "BL",
grepl("WEEK", AVISIT) ~
paste(
"W",
trimws(
substr(
AVISIT,
start = 6,
stop = stringr::str_locate(AVISIT, "DAY") - 1
)
)
),
TRUE ~ NA_character_
)) %>%
mutate(AVISITCDN = case_when(
AVISITCD == "SCR" ~ -2,
AVISITCD == "BL" ~ 0,
grepl("W", AVISITCD) ~ as.numeric(gsub("\\D+", "", AVISITCD)),
TRUE ~ NA_real_
)) %>%
mutate(ANRLO = .5, ANRHI = 1) %>%
rowwise() %>%
group_by(PARAMCD) %>%
mutate(LBSTRESC = ifelse(
USUBJID %in% sample(USUBJID, 1, replace = TRUE),
paste("<", round(runif(1, min = .5, max = 1))), LBSTRESC
)) %>%
mutate(LBSTRESC = ifelse(
USUBJID %in% sample(USUBJID, 1, replace = TRUE),
paste(">", round(runif(1, min = 1, max = 1.5))), LBSTRESC
)) %>%
ungroup()
attr(ADLB[["ARM"]], "label") <- var_labels[["ARM"]]
attr(ADLB[["ANRLO"]], "label") <- "Analysis Normal Range Lower Limit"
attr(ADLB[["ANRHI"]], "label") <- "Analysis Normal Range Upper Limit"
# add LLOQ and ULOQ variables
ADLB_LOQS <- goshawk:::h_identify_loq_values(ADLB, "LOQFL")
ADLB <- left_join(ADLB, ADLB_LOQS, by = "PARAM")
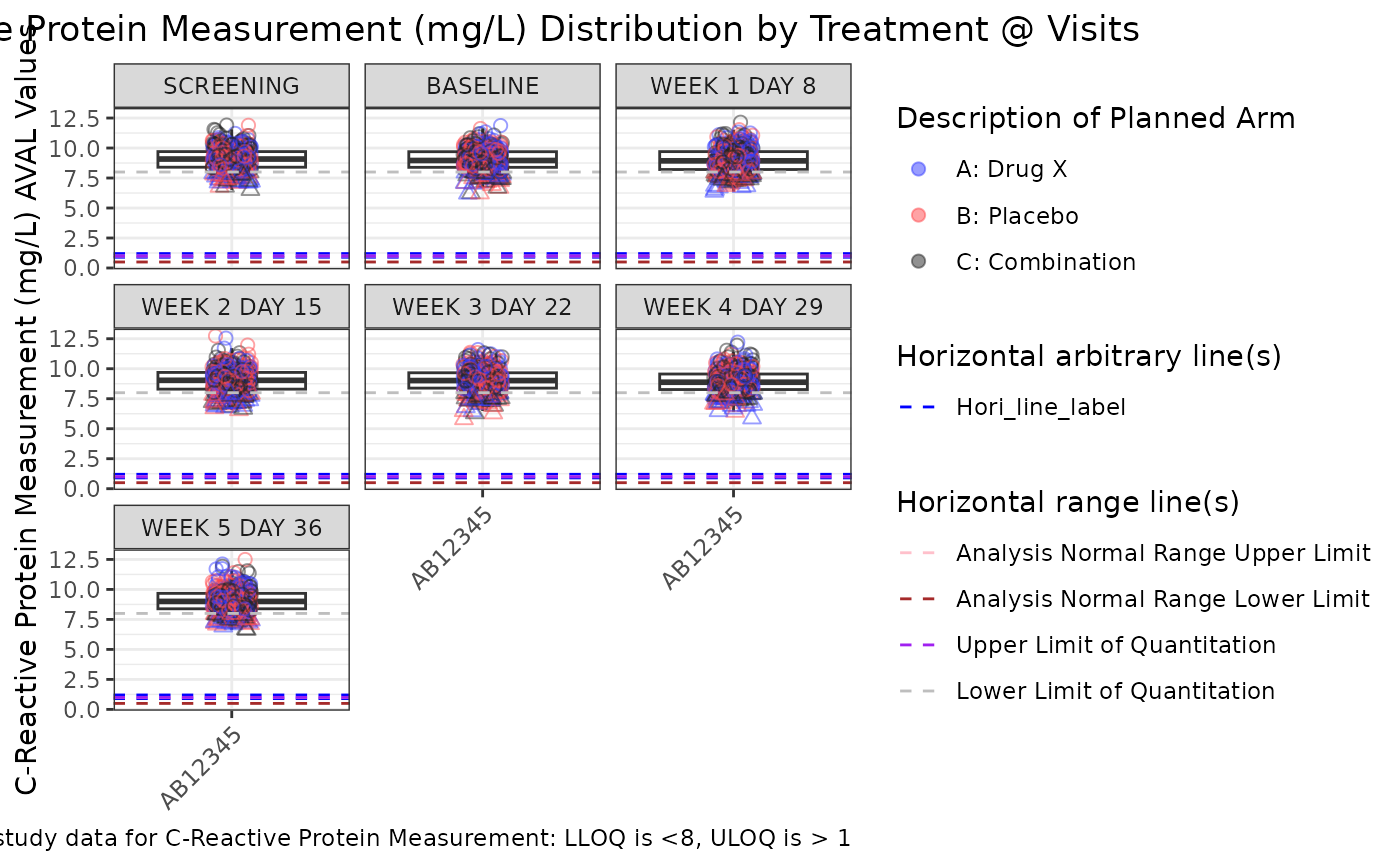
g_boxplot(ADLB,
biomarker = "CRP",
param_var = "PARAMCD",
yaxis_var = "AVAL",
trt_group = "ARM",
loq_flag_var = "LOQFL",
loq_legend = FALSE,
unit = "AVALU",
shape_manual = c("N" = 1, "Y" = 2, "NA" = NULL),
facet_var = "AVISIT",
xaxis_var = "STUDYID",
alpha = 0.5,
rotate_xlab = TRUE,
hline_arb = c(.9, 1.2),
hline_arb_color = "blue",
hline_arb_label = "Hori_line_label",
hline_vars = c("ANRHI", "ANRLO", "ULOQN", "LLOQN"),
hline_vars_colors = c("pink", "brown", "purple", "gray"),
hline_vars_labels = c("A", "B", "C", "D")
)