Creates a ggplot object containing text data for use as a table component beneath a main plot.
g_lineplot_table(
  df_stats,
  x = "AVISIT",
  group_var = NULL,
  table = c("n", "mean"),
  table_font_size = 3,
  decimal_places = 2
)
Arguments
- df_stats
(
data.frame)
containing pre-calculated statistics.- x
(
string)
Column name for the x-axis (must be indf_stats).- group_var
(
string)
Column name for the grouping/stratification variable (can beNULL).- table
(
character)
A character vector of statistic column names to display in the table (e.g., c("n","mean","mean_ci")).- table_font_size
(
integer)
Font size for the table text.- decimal_places
(
integer)
Integer specifying the number of decimal places for numeric statistics (like 'mean').
Value
A ggplot object formatted as a table.
Examples
# Create example statistics data frame
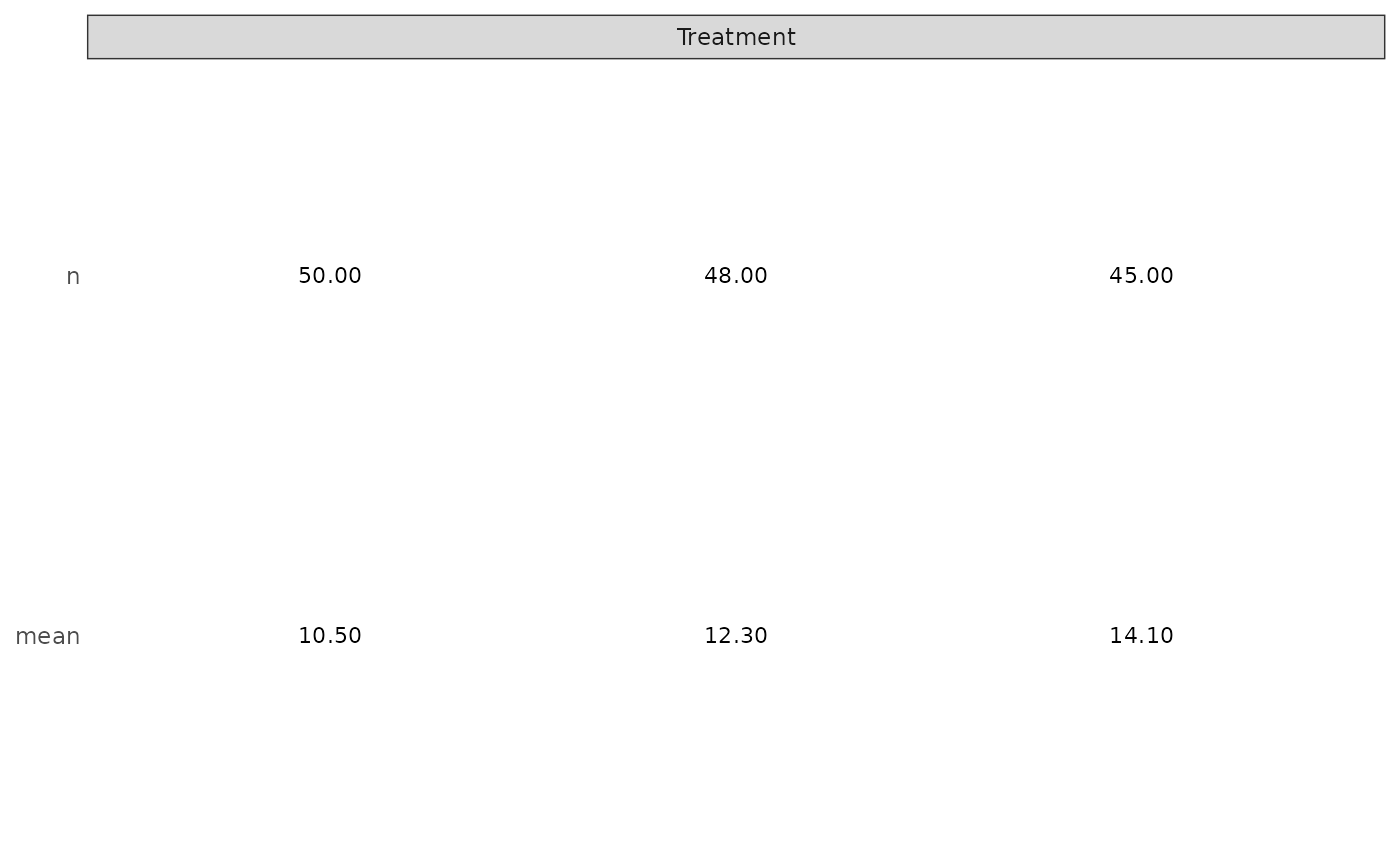
df_stats <- data.frame(
AVISIT = factor(c("Baseline", "Week 4", "Week 8")),
ARM = c("Treatment", "Treatment", "Treatment"),
n = c(50, 48, 45),
mean = c(10.5, 12.3, 14.1),
mean_ci = c("9.20 11.80", "11.00 13.60", "12.80 15.40")
)
# Generate table with n and mean
g_lineplot_table(
df_stats = df_stats,
x = "AVISIT",
group_var = "ARM",
table = c("n", "mean")
)