Creates a ggplot line plot of mean (or other mid-point) and
confidence intervals from a summary data frame.
g_lineplot(
  df_stats,
  x = "AVISIT",
  mid = "mean",
  strata_N = NULL,
  whiskers = c("mean_ci_lwr", "mean_ci_upr"),
  mid_type = "pl",
  mid_point_size = 2,
  position = position_dodge(width = 0.4),
  errorbar_width = 0.45,
  col = NULL,
  linetype = NULL
)
Arguments
- df_stats
(
data.frame)
containing pre-calculated statistics (e.g., mean, CIs, N).- x
(
string)
Column name for the x-axis (must be indf_stats).- mid
(
string)
Column name for the y-axis middle point (e.g., "mean").- strata_N
(
string)
Column name for the stratification variable used for grouping/coloring (can beNULL).- whiskers
(
character)
A vector of two column names for the lower and upper error bar limits.- mid_type
(
string)
String indicating whether to plot points ("p"), lines ("l"), or both ("pl").- mid_point_size
(
numeric)
Numeric value for the size of points.- position
(
position)
Position adjustment for dodging points and lines (default:position_dodge(width = 0.4)).- errorbar_width
(
numeric)
Width of error bars (default: 0.45).- col
(
character)
Vector of color values for manual color scaling.- linetype
(
character)
Vector of line type values for manual line type scaling.
Value
A ggplot object.
Examples
library(ggplot2)
# Create example statistics data frame
df_stats <- data.frame(
AVISIT = factor(c("Baseline", "Week 4", "Week 8")),
ARM = c("Treatment", "Treatment", "Treatment"),
mean = c(10.5, 12.3, 14.1),
mean_ci_lwr = c(9.2, 11.0, 12.8),
mean_ci_upr = c(11.8, 13.6, 15.4)
)
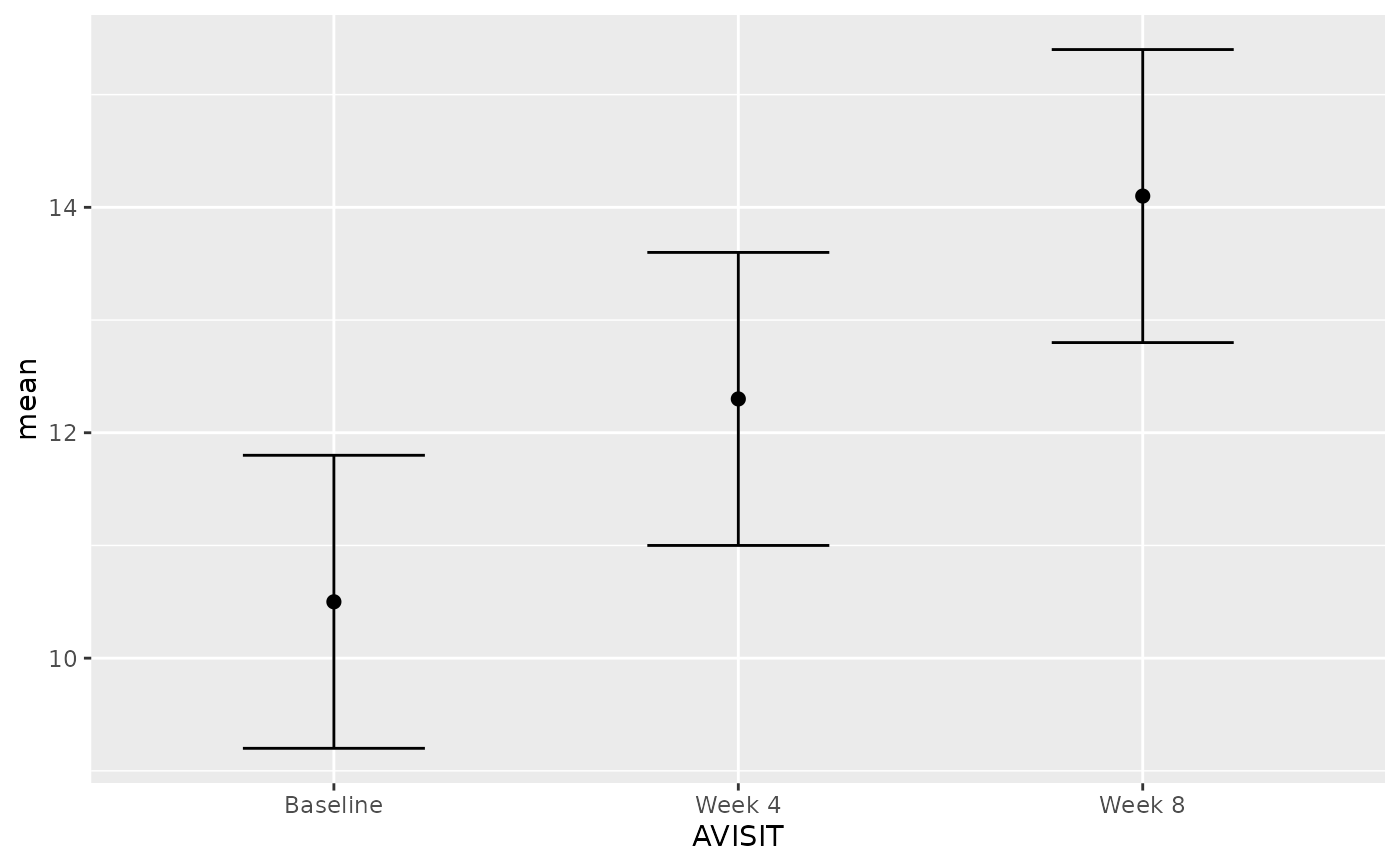
# Basic line plot without stratification
g_lineplot(
df_stats = df_stats,
x = "AVISIT",
mid = "mean",
whiskers = c("mean_ci_lwr", "mean_ci_upr")
)
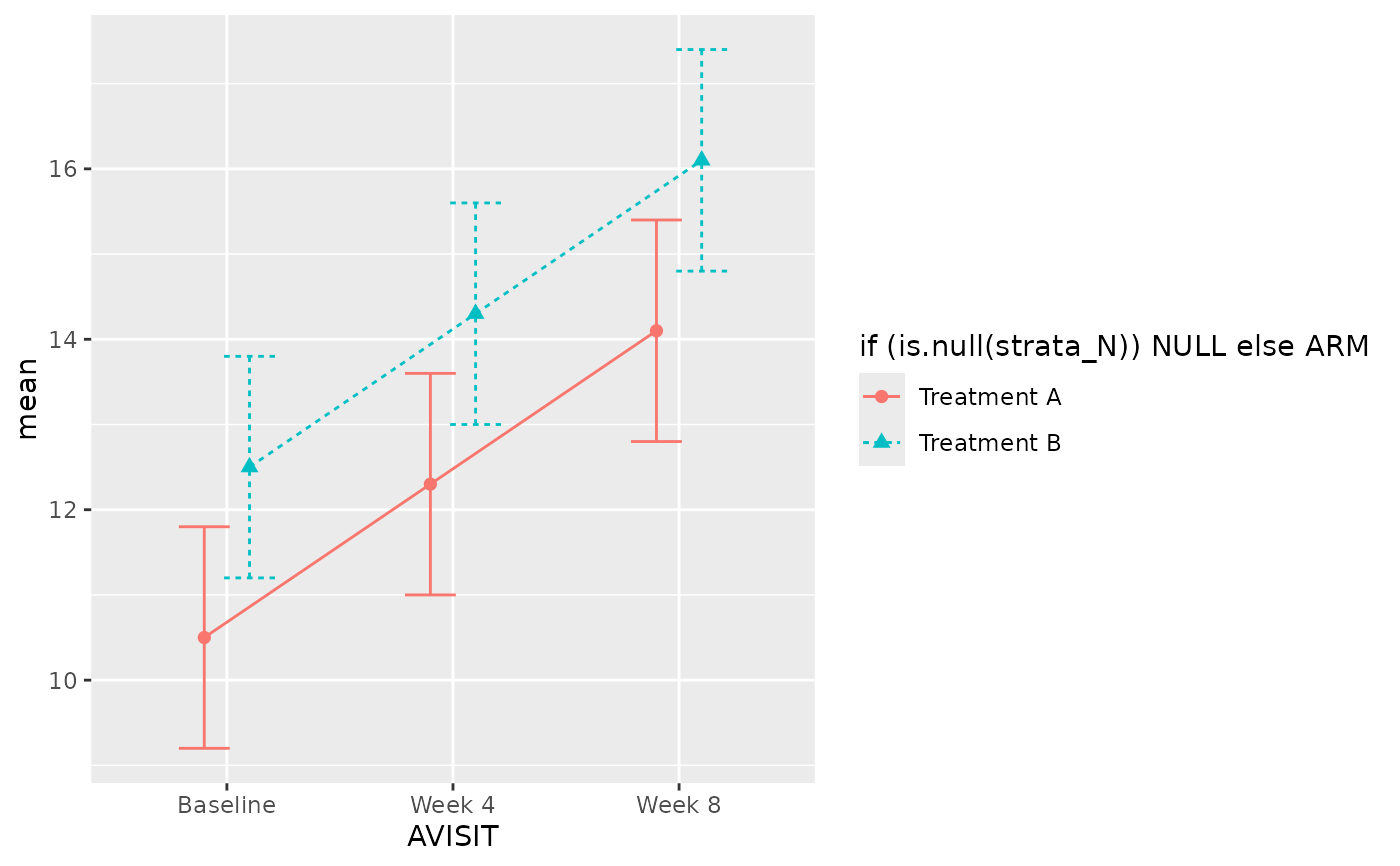
 # Line plot with stratification
df_stats_strat <- rbind(
transform(df_stats, ARM = "Treatment A"),
transform(df_stats,
ARM = "Treatment B", mean = mean + 2,
mean_ci_lwr = mean_ci_lwr + 2, mean_ci_upr = mean_ci_upr + 2
)
)
g_lineplot(
df_stats = df_stats_strat,
x = "AVISIT",
mid = "mean",
strata_N = "ARM",
whiskers = c("mean_ci_lwr", "mean_ci_upr")
)
# Line plot with stratification
df_stats_strat <- rbind(
transform(df_stats, ARM = "Treatment A"),
transform(df_stats,
ARM = "Treatment B", mean = mean + 2,
mean_ci_lwr = mean_ci_lwr + 2, mean_ci_upr = mean_ci_upr + 2
)
)
g_lineplot(
df_stats = df_stats_strat,
x = "AVISIT",
mid = "mean",
strata_N = "ARM",
whiskers = c("mean_ci_lwr", "mean_ci_upr")
)