These functions provide capabilities to annotate Kaplan-Meier plots (gg_km())
with additional summary tables, including median survival times, numbers at
risk, and cox proportional hazards results. The annotations are added using
the cowplot package for flexible placement.
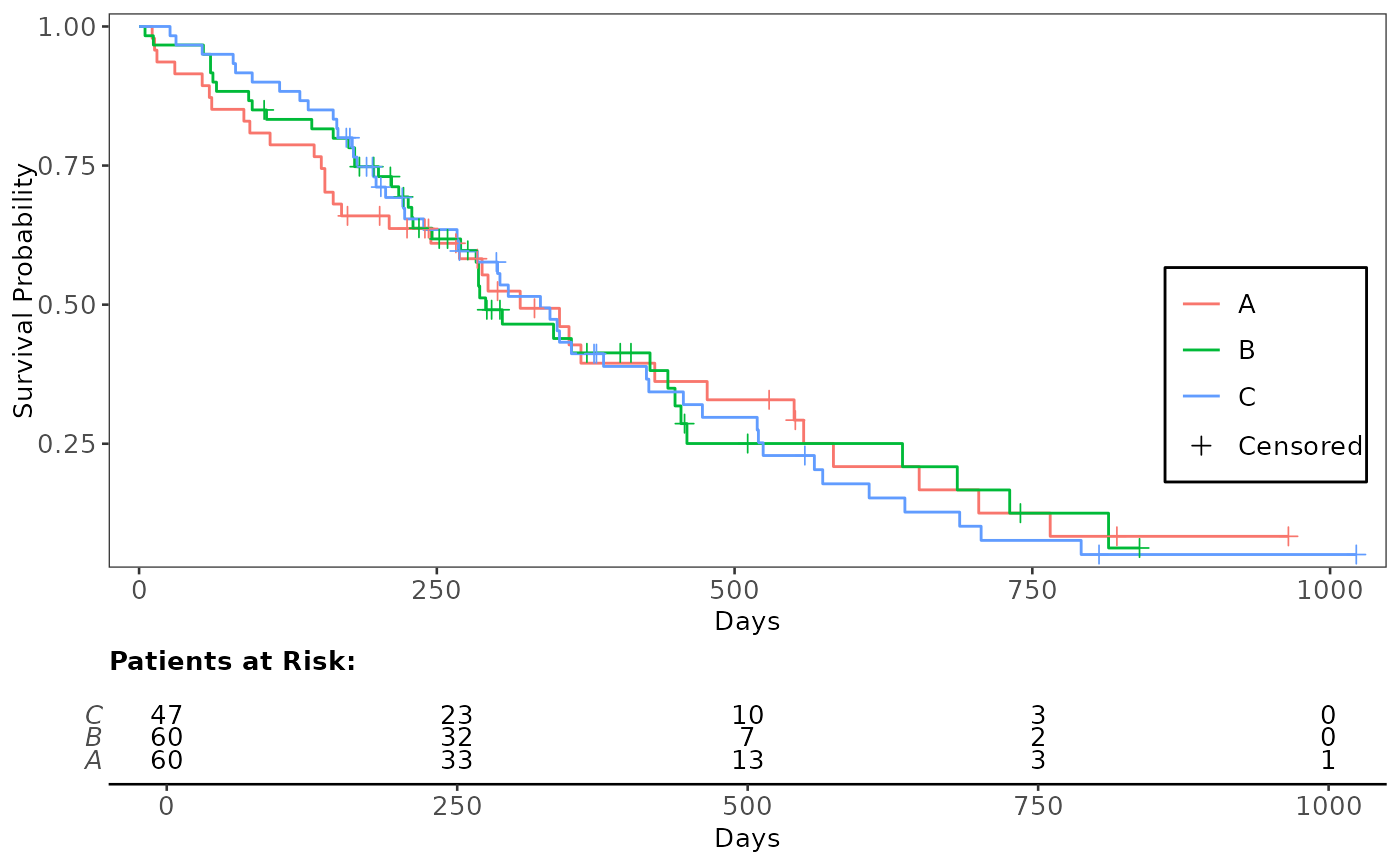
annotate_riskdf(
gg_plt,
fit_km,
title = "Patients at Risk:",
rel_height_plot = 0.75,
xlab = "Days",
...
)
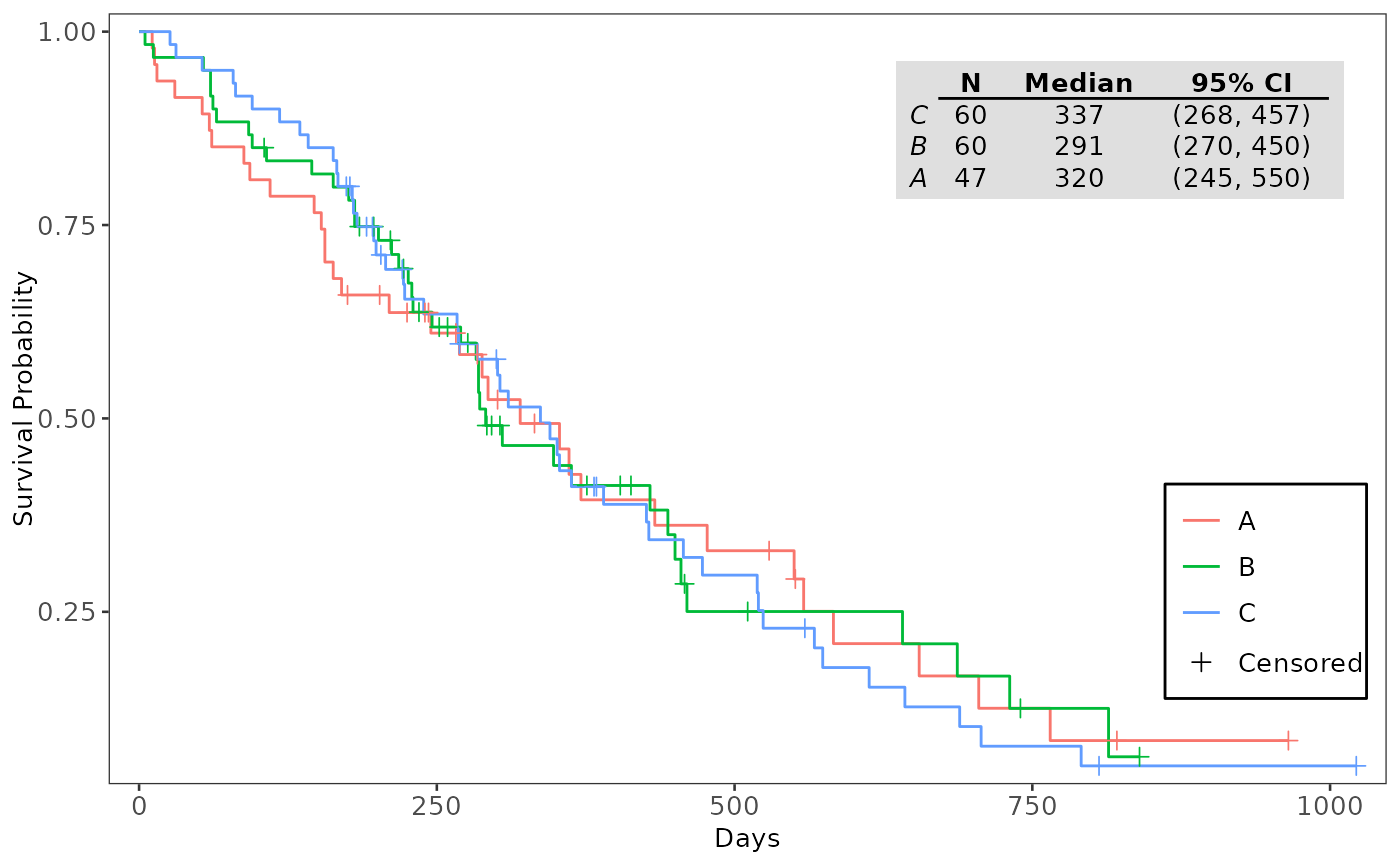
annotate_surv_med(
gg_plt,
fit_km,
table_position = c(x = 0.8, y = 0.85, w = 0.32, h = 0.16),
...
)
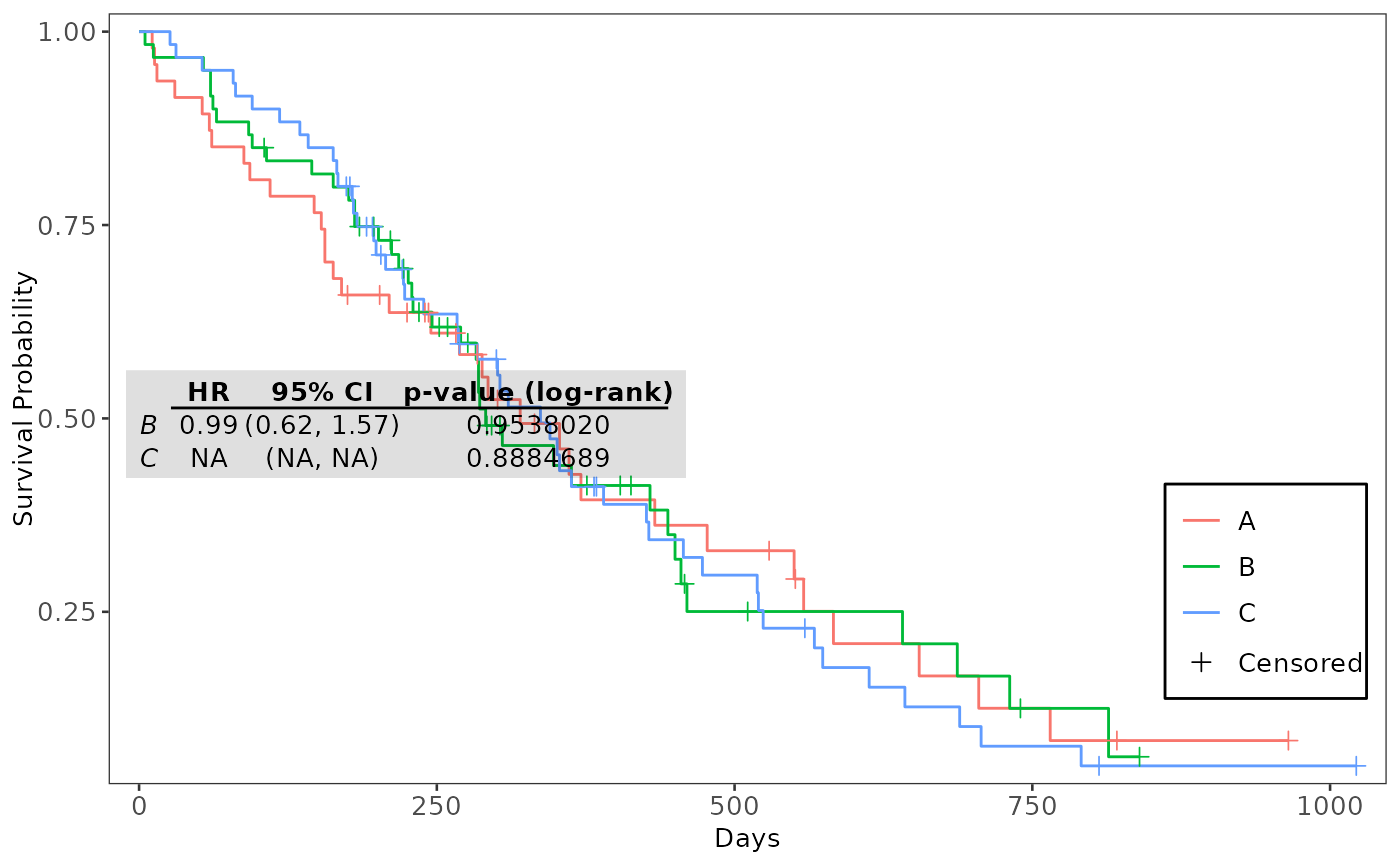
annotate_coxph(
gg_plt,
coxph_tbl,
table_position = c(x = 0.29, y = 0.51, w = 0.4, h = 0.125),
...
)Arguments
- gg_plt
(
ggplot2orcowplot)
The primary plot object of the Kaplan-Meier plot. Note: While floating tables acceptcowplotobjects, aligned tables (like the risk table) require a pureggplot2object.- fit_km
(
survfit)
A fitted Kaplan-Meier object of classsurvfit(from thesurvivalpackage). This object contains the necessary survival data used to calculate and generate the content displayed in the annotation table.- title
(
character)
A single string value indicating whether to include a title above the table. Defaults to"Patients at Risk:". IfNULL, no title is added.- rel_height_plot
(
numeric)
A single numeric value defining the relative height of the main Kaplan-Meier plot area compared to the 'at-risk' table. This value should be between 0 and 1, where a value closer to 1 gives the main plot more vertical space. Defaults to0.75.- xlab
(
character)
A single character string for the x-axis label on the 'at-risk' table. This typically represents time (e.g., "Days").- ...
Additional arguments passed to the control list for the annotation box. These arguments override the default values.
Accepted arguments include:fill(logical): Whether the annotation box should have a background fill. Default isTRUE.font_size(numeric): Base font size for the text inside the annotation box. Default is10.
- table_position
(
numeric)
A named numeric vectorc(x, y, w, h)defining the position and size of the floating table.xandyare the coordinates (0 to 1), whilewandhrepresent width and height (0 to 1). Defaults vary by function.- coxph_tbl
(
data.frame)
A data frame containing the pre-calculated Cox-PH results, derived using functionget_cox_pairwise_df().
Value
The function annotate_riskdf returns a cowplot object combining
the KM plot and the 'Numbers at Risk' table.
The function annotate_surv_med returns a cowplot object
with the median survival table annotation added.
The function annotate_coxph returns a cowplot object
with the Cox-PH table annotation added.
Functions
annotate_riskdf(): The functionannotate_riskdfadds a "Numbers at Risk" table below a Kaplan-Meier plot usingpatchwork.
Note: For this specific function,gg_pltmust be a pureggplot2object (not a combinedcowplotobject) because it requires exact X-axis extraction.annotate_surv_med(): Theannotate_surv_medfunction adds a median survival time summary table as an annotation box.annotate_coxph(): The functionannotate_coxph()adds a Cox Proportional Hazards summary table as an annotation box.
See also
gg_km(), process_survfit(), and get_cox_pairwise_df() for
related functionalities.
Examples
# Preparing the Kaplan-Meier Plot
library(survival)
use_lung <- lung
use_lung$arm <- factor(sample(c("A", "B", "C"), nrow(use_lung), replace = TRUE))
use_lung$status <- use_lung$status - 1 # Convert status to 0/1
use_lung <- na.omit(use_lung)
formula <- Surv(time, status) ~ arm
fit_kmg01 <- survfit(formula, use_lung)
surv_plot_data <- process_survfit(fit_kmg01)
plt_kmg01 <- gg_km(surv_plot_data)
# Annotate Plot with Numbers at Risk Table
annotate_riskdf(plt_kmg01, fit_kmg01)
 # Change order of y-axis (arm)
use_lung2 <- use_lung
use_lung2$arm <- factor(use_lung2$arm, levels = c("C", "B", "A"))
fit_kmg01 <- survival::survfit(formula, use_lung2)
annotate_riskdf(plt_kmg01, fit_kmg01) # rerun gg_km to change legend order
# Change order of y-axis (arm)
use_lung2 <- use_lung
use_lung2$arm <- factor(use_lung2$arm, levels = c("C", "B", "A"))
fit_kmg01 <- survival::survfit(formula, use_lung2)
annotate_riskdf(plt_kmg01, fit_kmg01) # rerun gg_km to change legend order
 # Annotate Kaplan-Meier Plot with Median Survival Table
annotate_surv_med(plt_kmg01, fit_kmg01)
# Annotate Kaplan-Meier Plot with Median Survival Table
annotate_surv_med(plt_kmg01, fit_kmg01)
 # Annotate Kaplan-Meier Plot with Cox-PH Table
coxph_tbl <- get_cox_pairwise_df(
formula,
data = use_lung, arm = "arm", ref_group = "A"
)
result <- annotate_coxph(plt_kmg01, coxph_tbl)
# Extract original plots from any annotated result
attr(result, "plotlist")$main
# Annotate Kaplan-Meier Plot with Cox-PH Table
coxph_tbl <- get_cox_pairwise_df(
formula,
data = use_lung, arm = "arm", ref_group = "A"
)
result <- annotate_coxph(plt_kmg01, coxph_tbl)
# Extract original plots from any annotated result
attr(result, "plotlist")$main