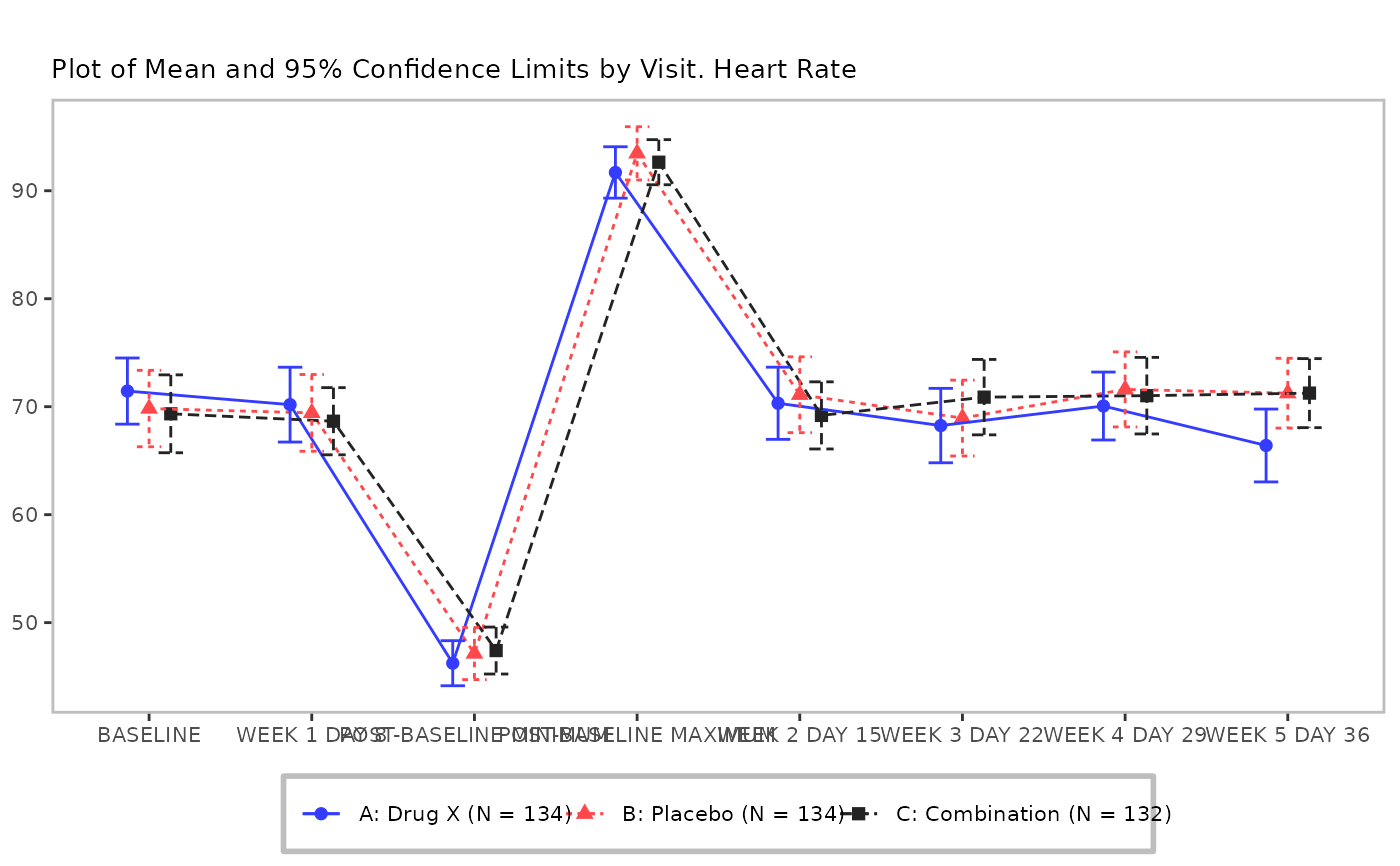
Wrapper for `g_mean_general()`. Requires filtering of the datasets (e.g. using SUFFIX in spec.yml)
Usage
g_eg_slide(
  adsl,
  adeg,
  arm = "TRT01P",
  paramcd = "PARAM",
  subtitle = "Plot of Mean and 95% Confidence Limits by Visit.",
  ...
)Examples
library(dplyr)

adeg_filtered <- eg_adeg %>% filter(
  PARAMCD == "HR"
)
plot_eg <- g_eg_slide(
  adsl = eg_adsl,
  adeg = adeg_filtered,
  arm = "TRT01P",
  paramcd = "PARAM",
  subtitle_add_unit = FALSE
)
plot_eg

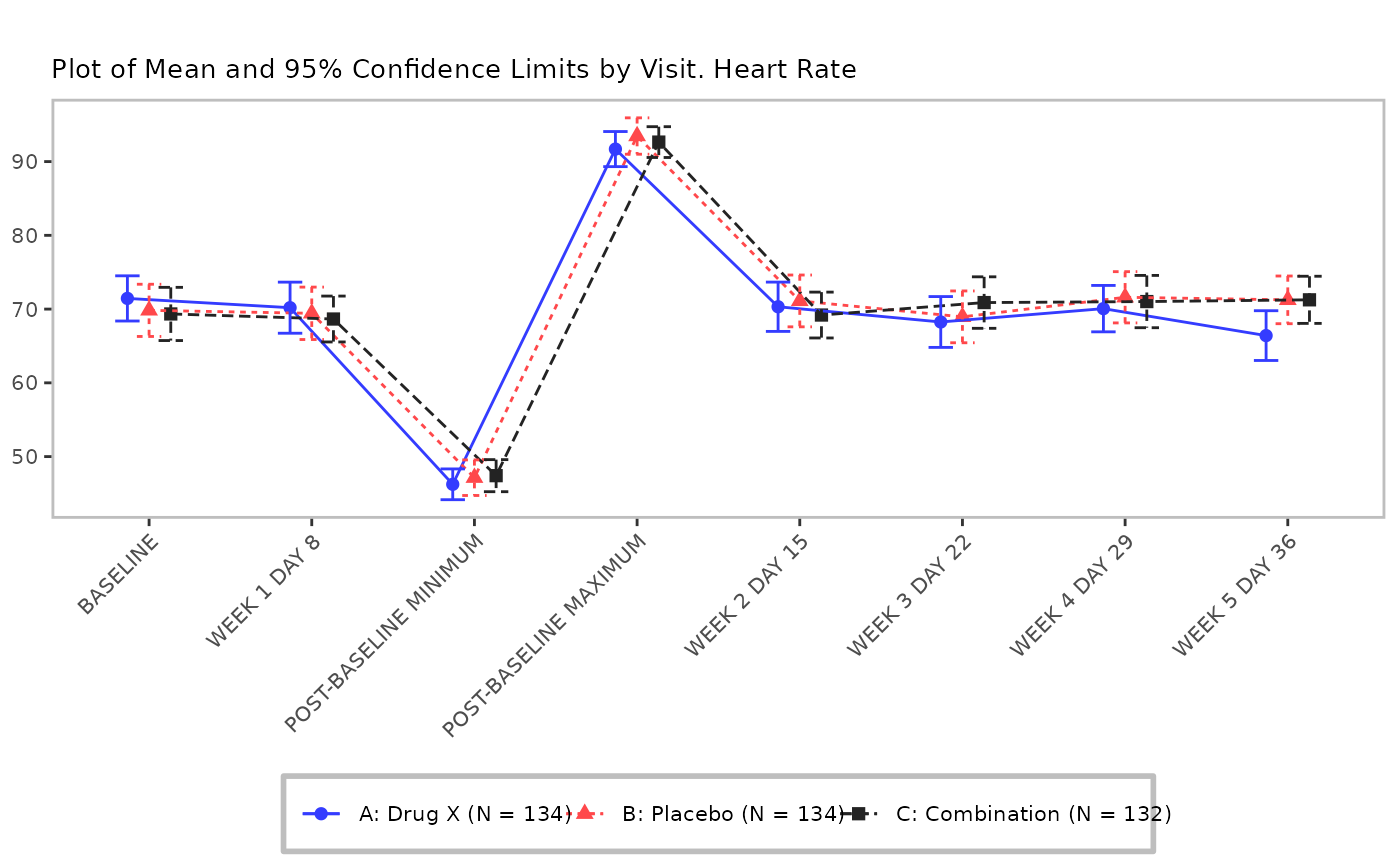
# you want x-axis tilted labels? No problem:
plot_eg +
  ggplot2::theme(axis.text.x = ggplot2::element_text(angle = 45, hjust = 1))
